
Impacts of Spatio-Temporal Changes in Rainfall and Temperature on Different Crops in Selected Districts of Punjab, Pakistan


Impacts of Spatio-Temporal Changes in Rainfall and Temperature on Different Crops in Selected Districts of Punjab, Pakistan
Muhammad Waqar Yasin*, Mobushir Riaz Khan and Muhammad Amin
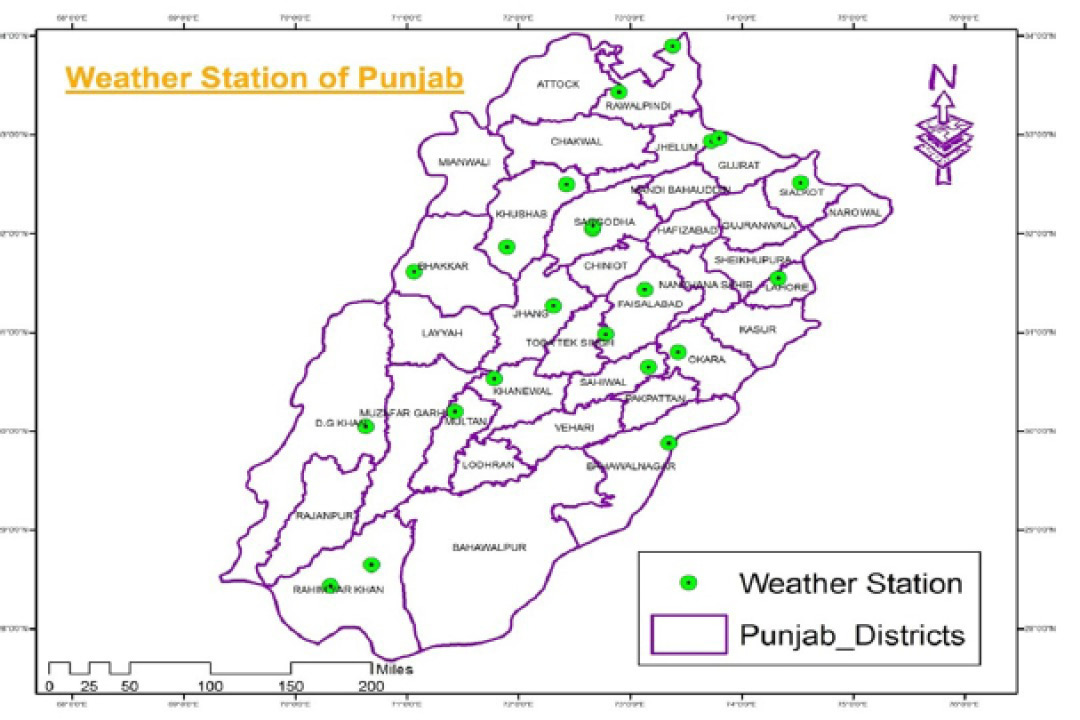
Pakistan Metrological Department Weather Stations which observe and record continuously temperature, rainfall and many other type of climatic data and are located mostly in every district of Punjab.
Average temperature Map (0C) 1951 – 1980 map of Punjab
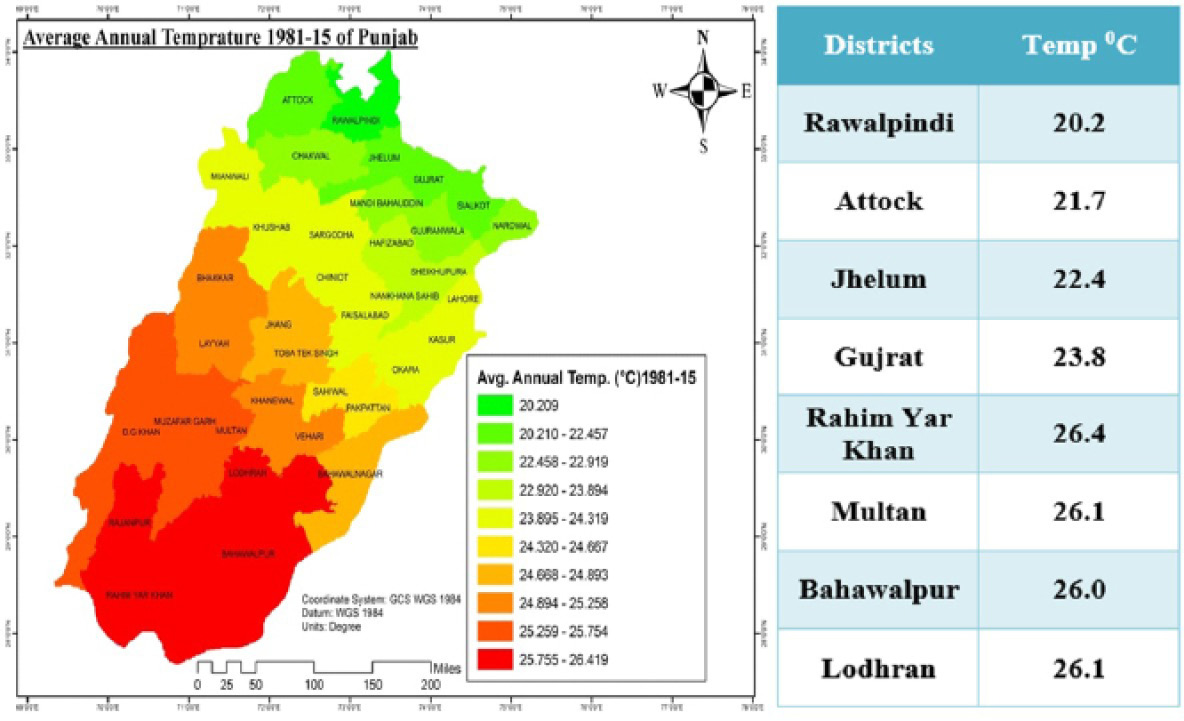
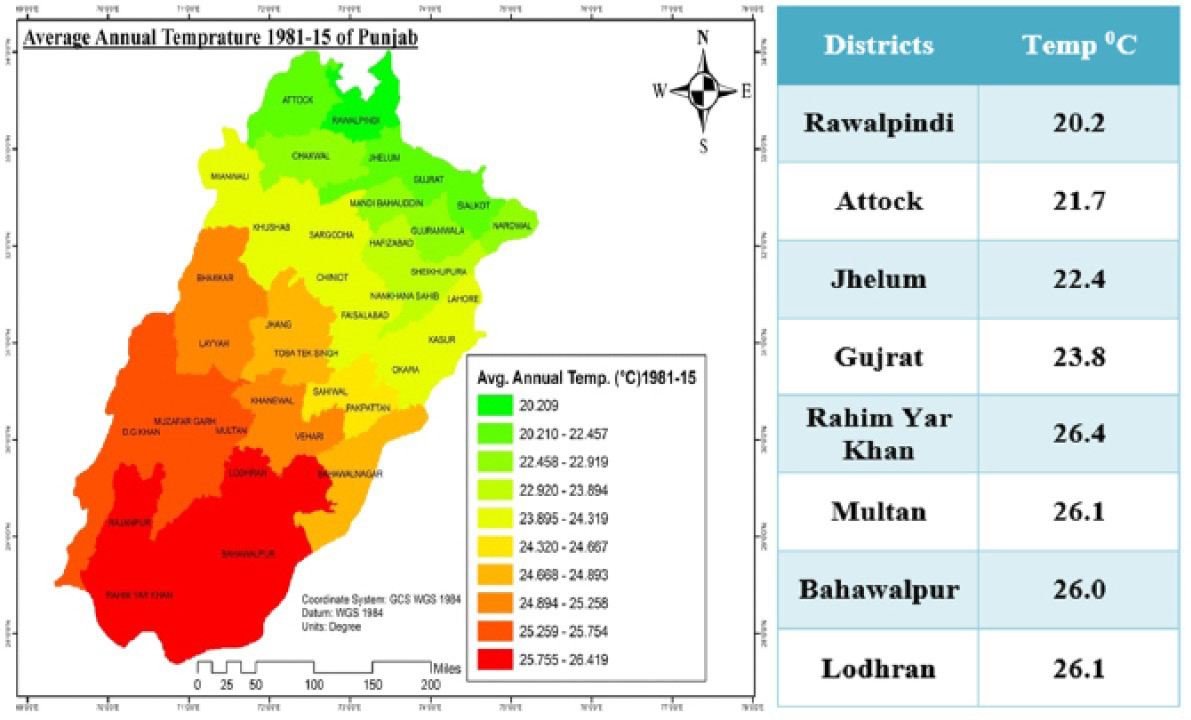
Average temperature Map (0C) 1981 – 2015 map of Punjab.

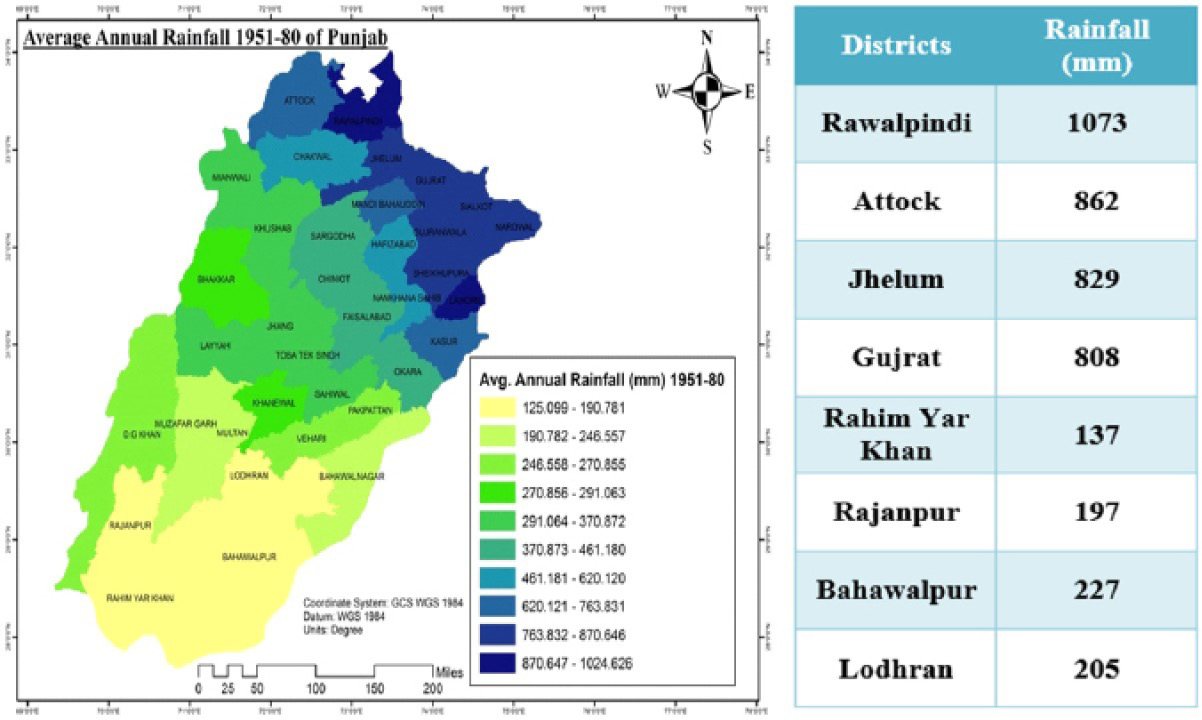
Average rainfall (mm) 1951 – 1980 map of Punjab.

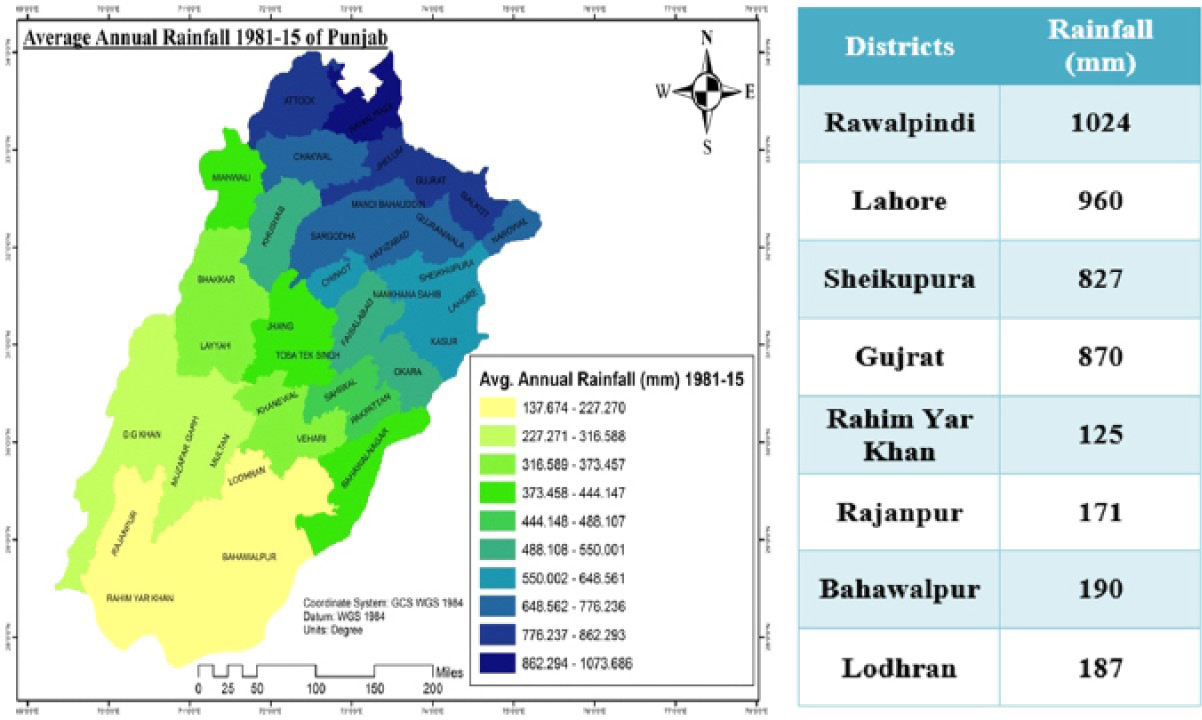
Average rainfall (mm) 1981 – 2015 map of Punjab.

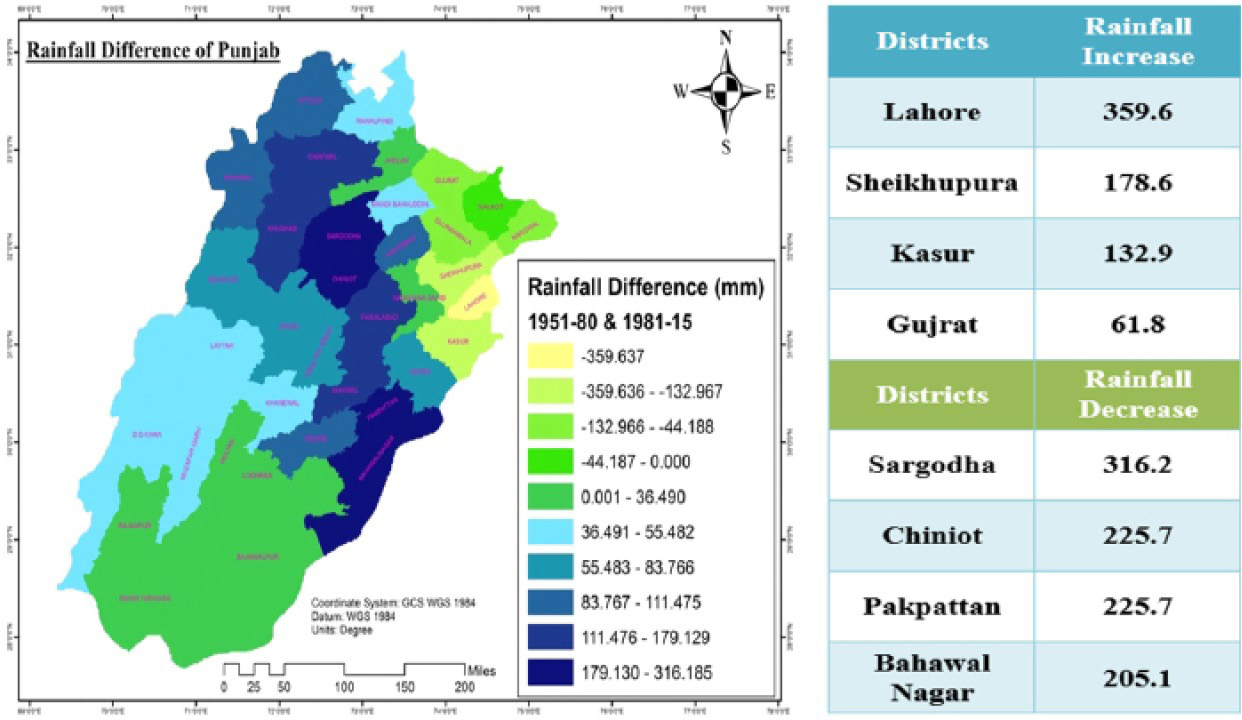
Rainfall change (mm) 1951 – 2015 map of Punjab.
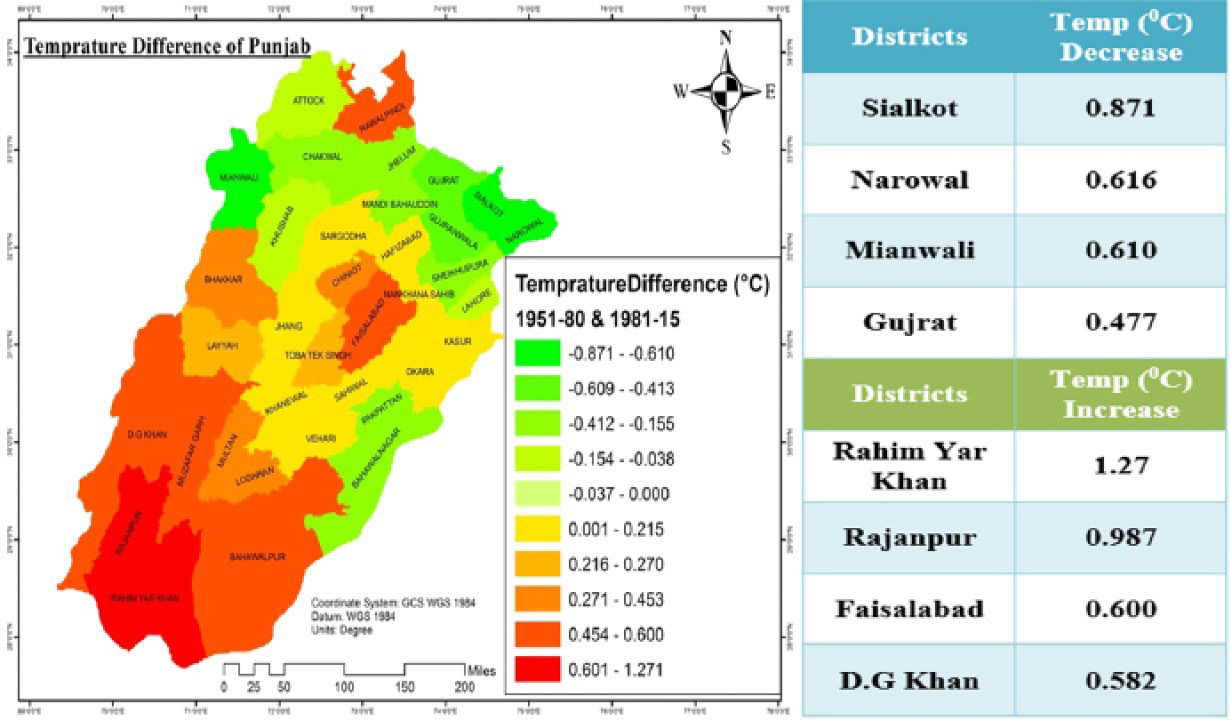
Temperature change (0C) 1951 – 2015 map of Punjab.
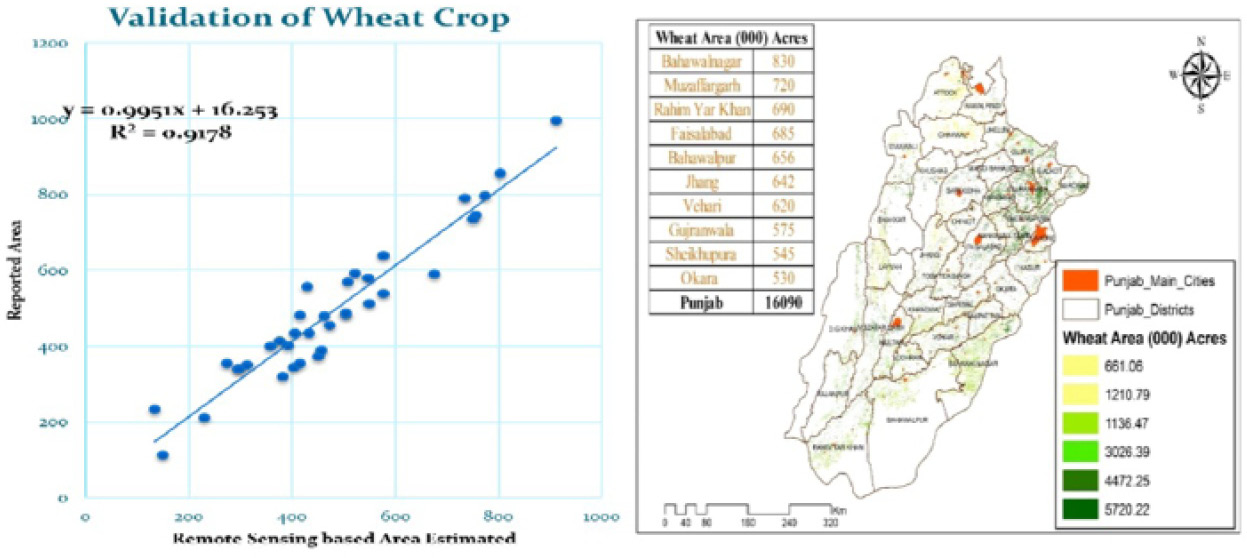
Validation – Remote sensing vs reported data of wheat crop.
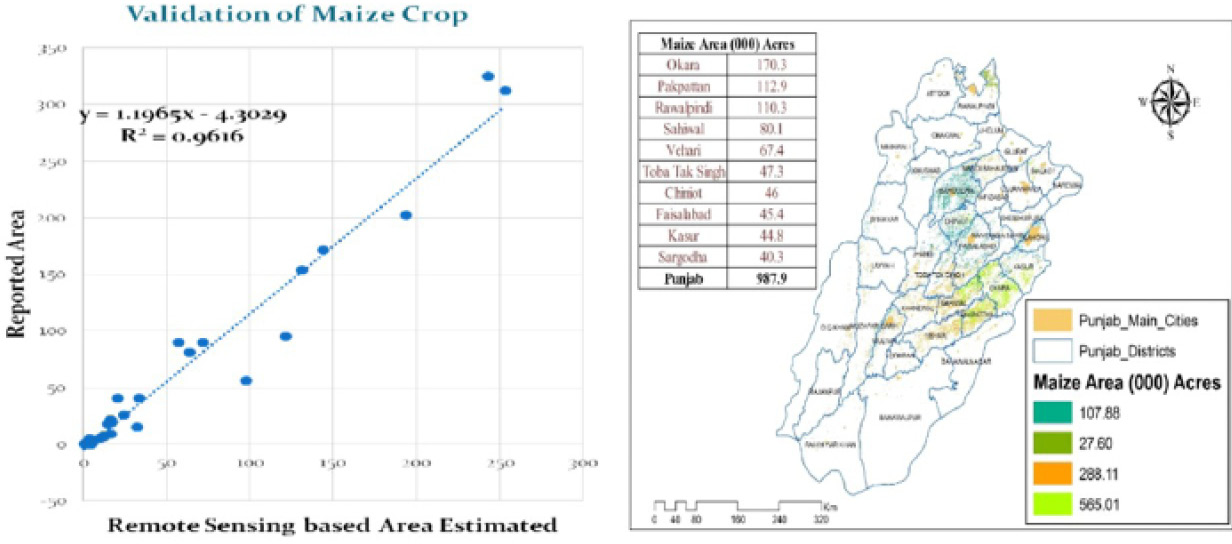
Validation – Remote sensing vs reported data of maize crop.

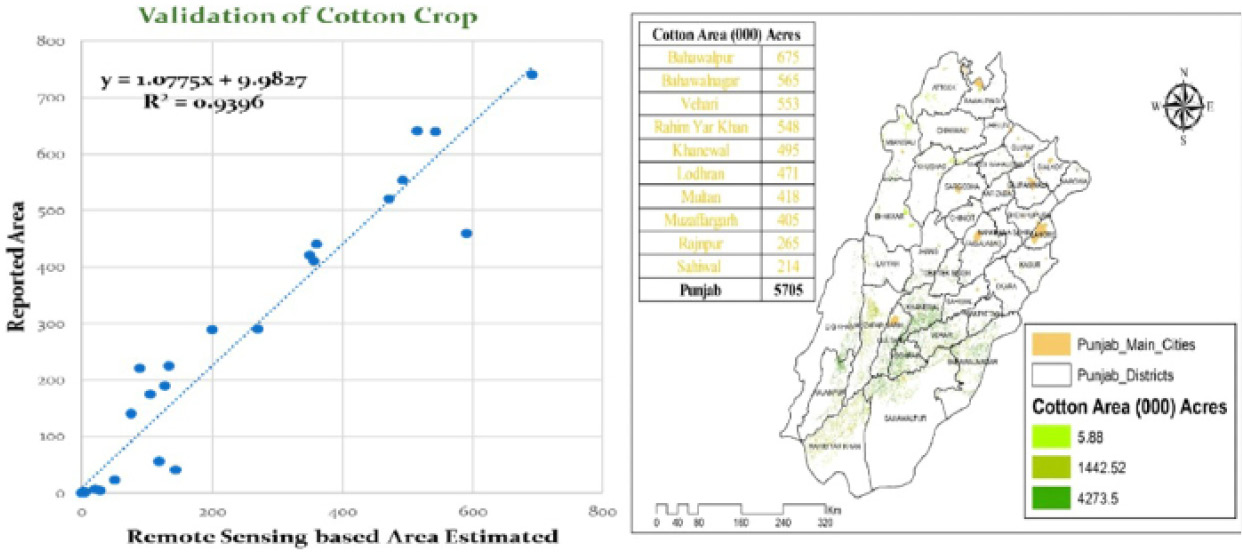
Validation – Remote Sensing vs Reported Data of Cotton Crop.

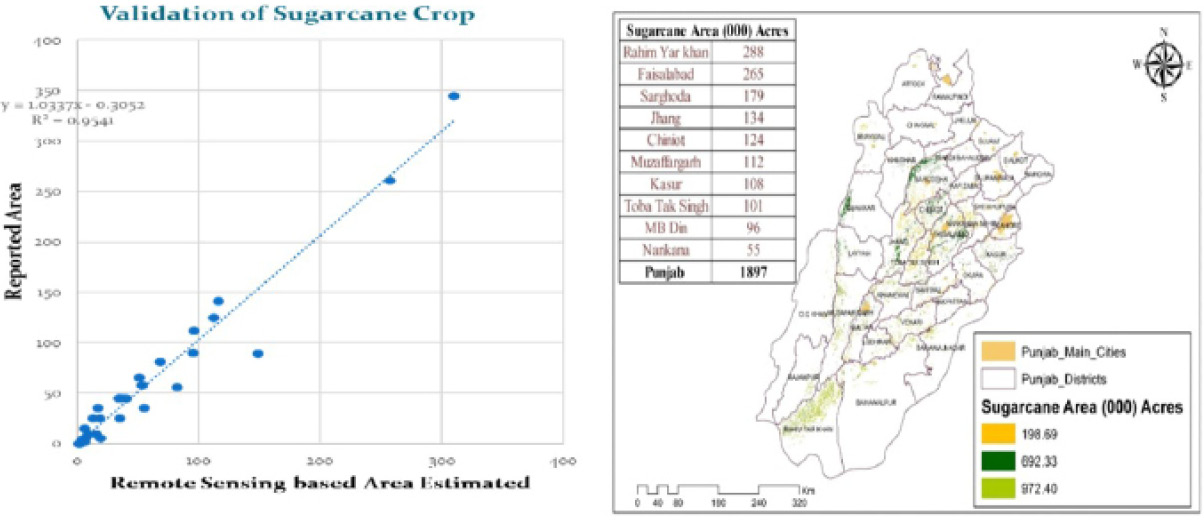
Validation – Remote Sensing vs Reported Data of Sugarcane Crop.

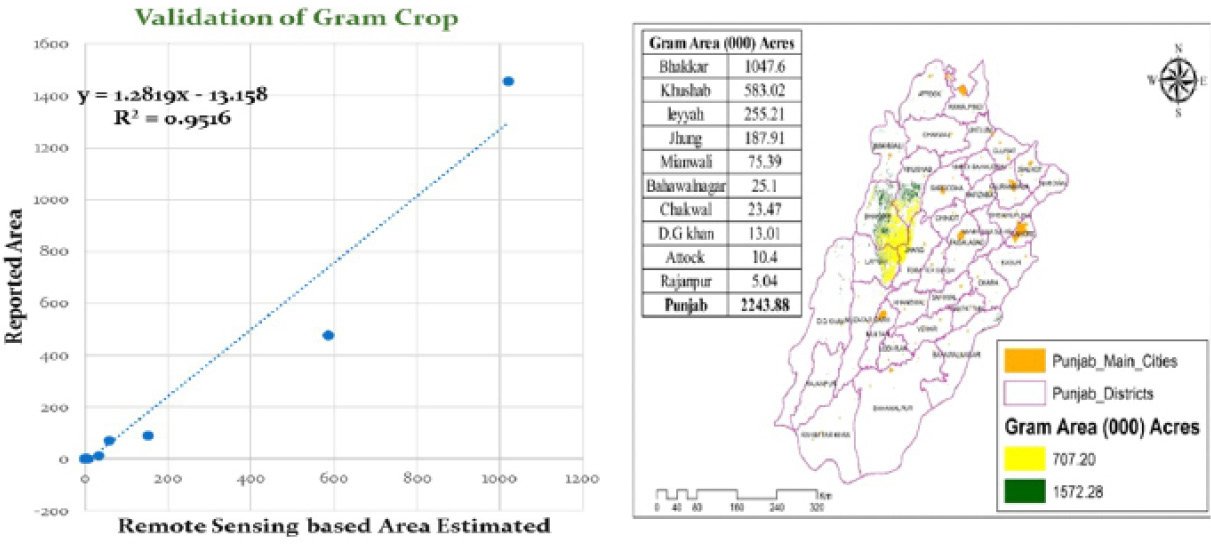
Validation – Remote Sensing vs Reported Data Gram Crop.

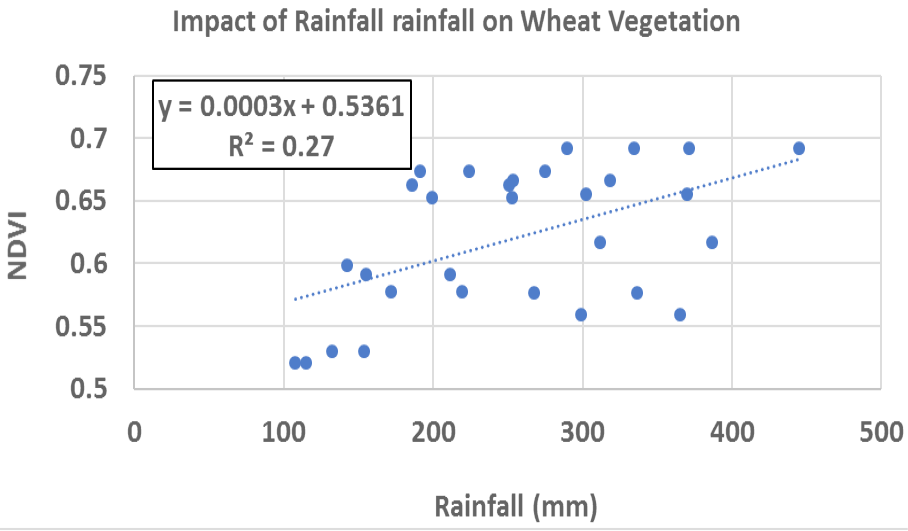
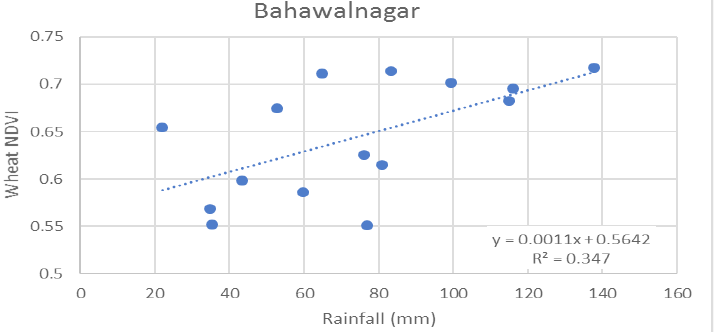
Impact of Rainfall on wheat Vegetation

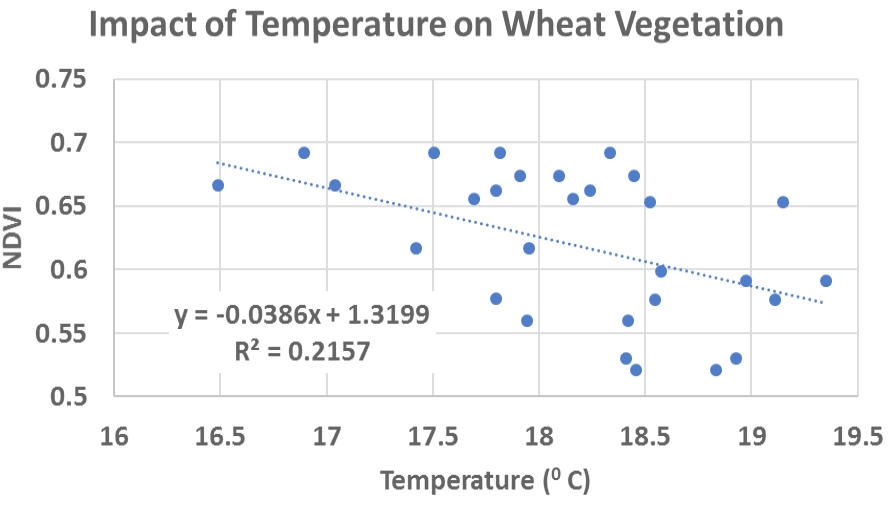
Impact of Temperature on wheat Vegetation.
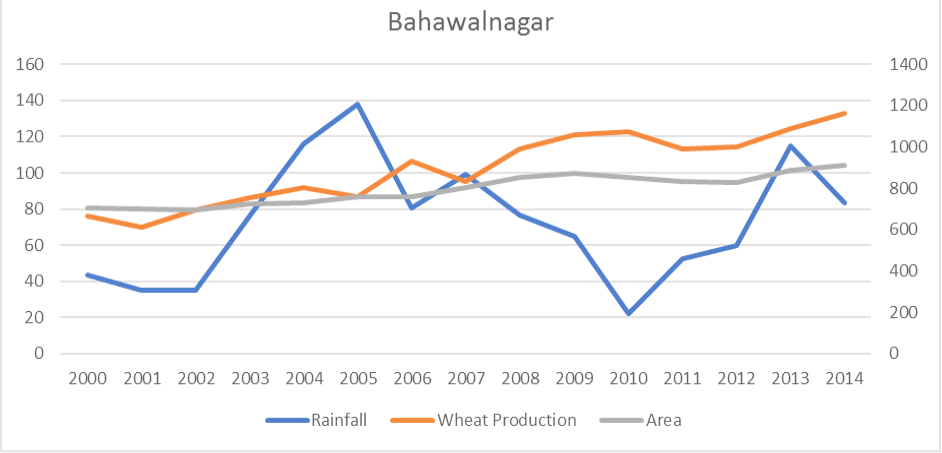
Impact of climate change on crop performance in District Bahawalnagar.
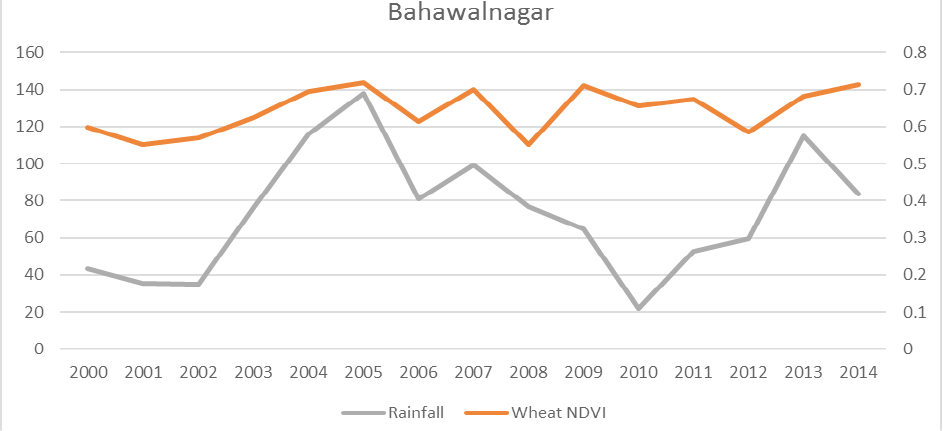
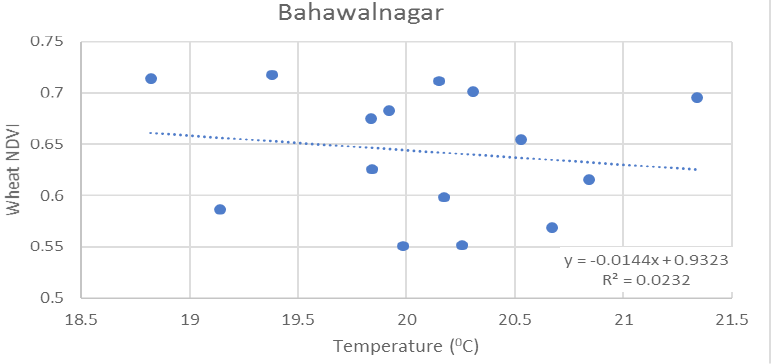
Impact of climate change on wheat NDVI in District Bahawalnagar.

Impact of rainfall on crop performance in District Bahawalnagar.
Impact of temperature on crop performance in Bahawalnagar.
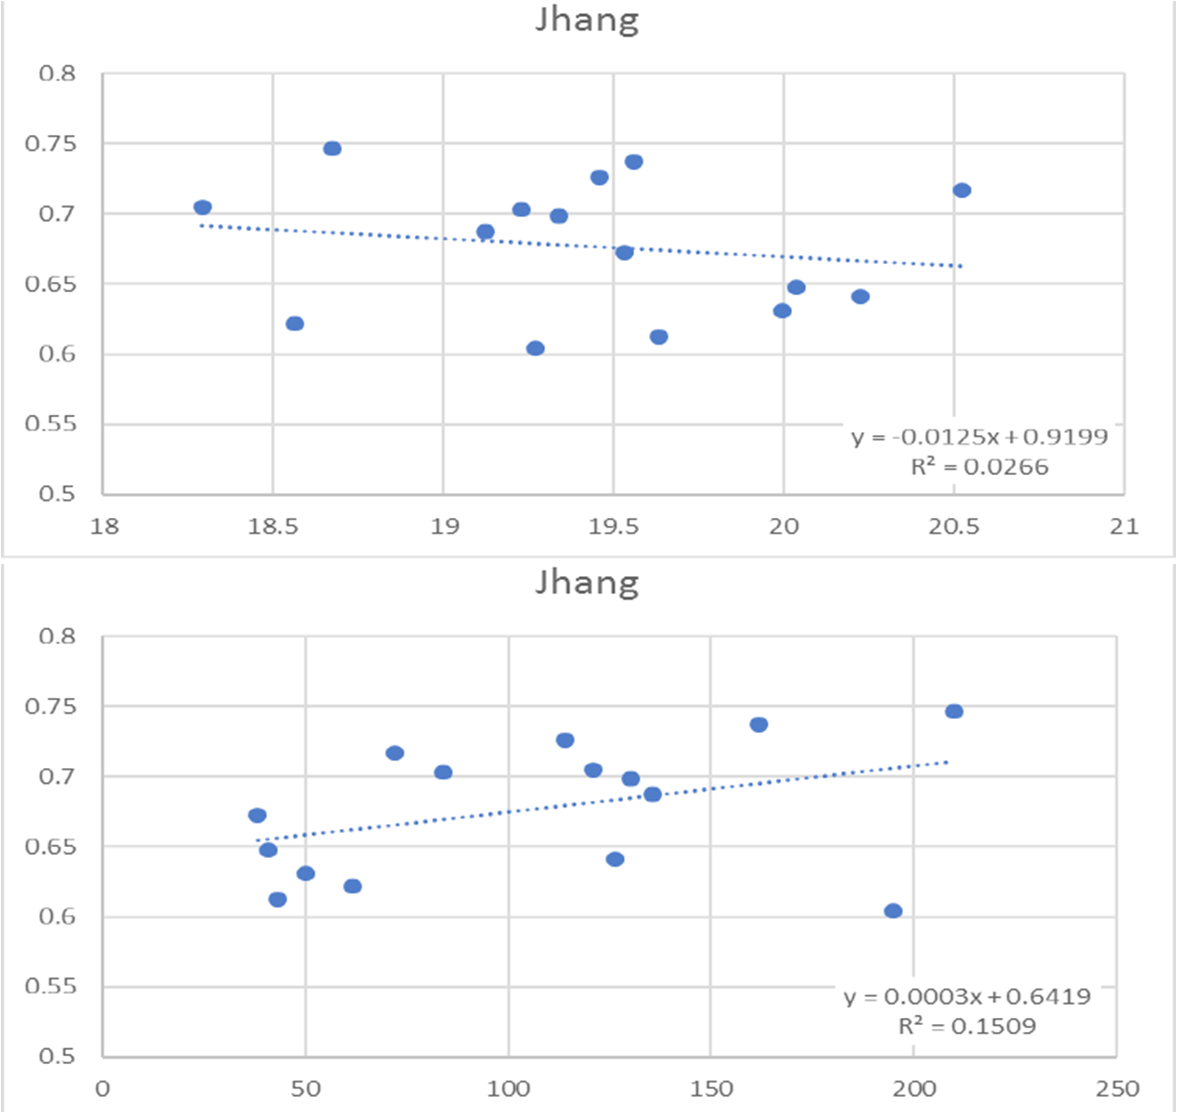
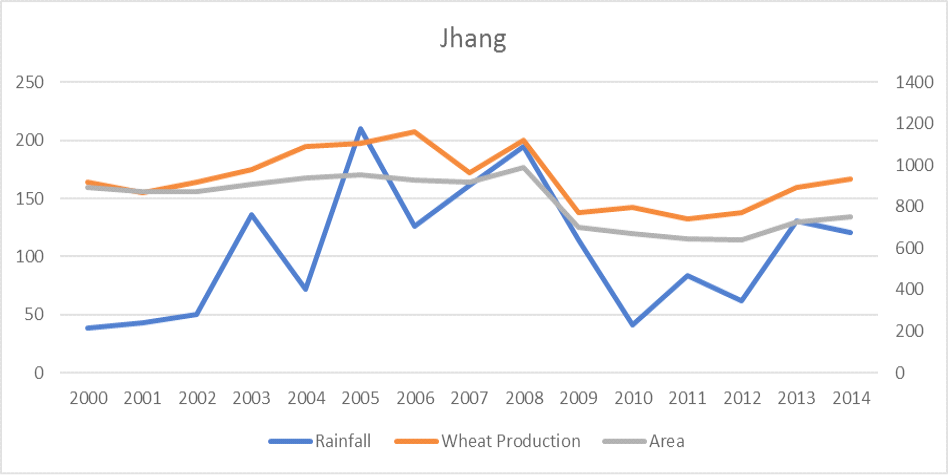
Impact of climate change on crop performance in Jhang.
Impact of climate change on crop Performance.

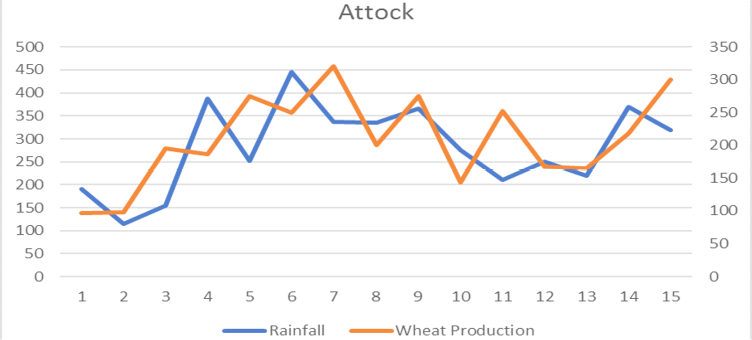
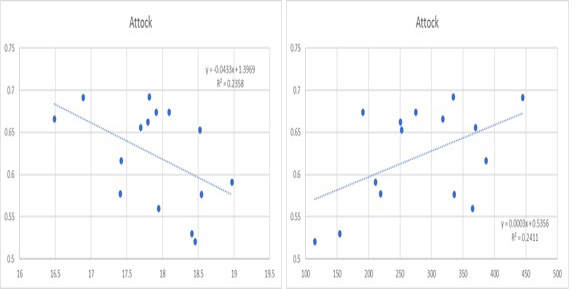
Impact of climate change on crop performance in Attock.

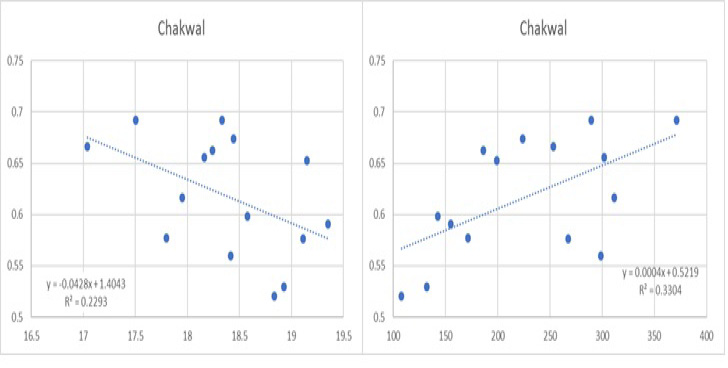
Impact of climate change on crop performance in Chakwal.
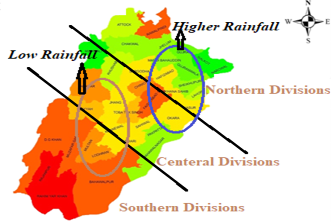
Zoning of Punjab with regards to temperature and rainfall.

Impact of climate change on crop performance.


