

Identification of Immune-Related LncRNA for Predicting Survival in Skin Cutaneous Melanoma


Identification of Immune-Related LncRNA for Predicting Survival in Skin Cutaneous Melanoma
Qi Jiayi1, Huang XuMiao2, Lin Wei3, Ao YaHui3, Zhao Wenting2* and Cao Chunhao3*

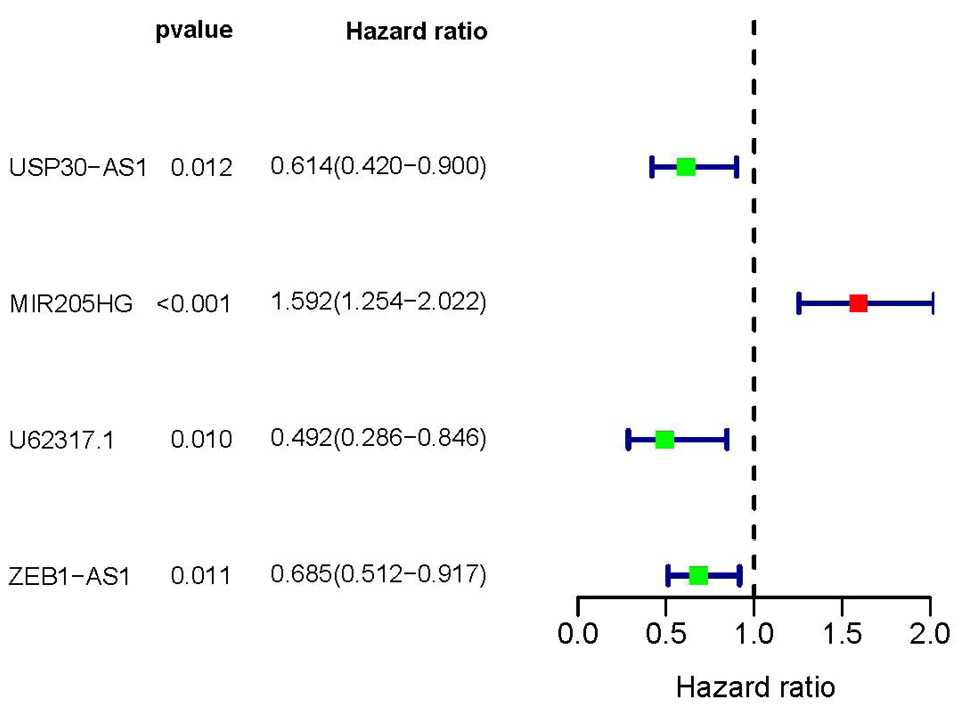
Prognostic model of 4-LncRNA by multifactorial analysis. The red box represents the adverse prognostic factor; Blue box represents the favorable prognostic factor.

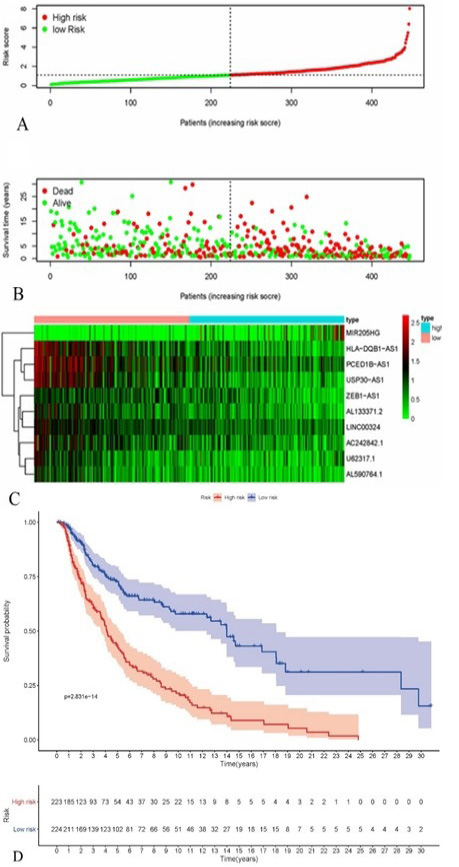
Construction and validation of the 10 survival-related immune lncRNAs signature for survival prediction. (A) The risk score of each patient. (B) The scatter plot of the sample survival overview, the green and red dots respectively represent survival and death. (C) The heatmap showed the 10 differentially expressed lncRNAs. (D) Kaplan-Meier plot for overall survival (OS) based on risk score of the 4 gene-based signatures of patients with primary SKCM in the TCGA cohort.
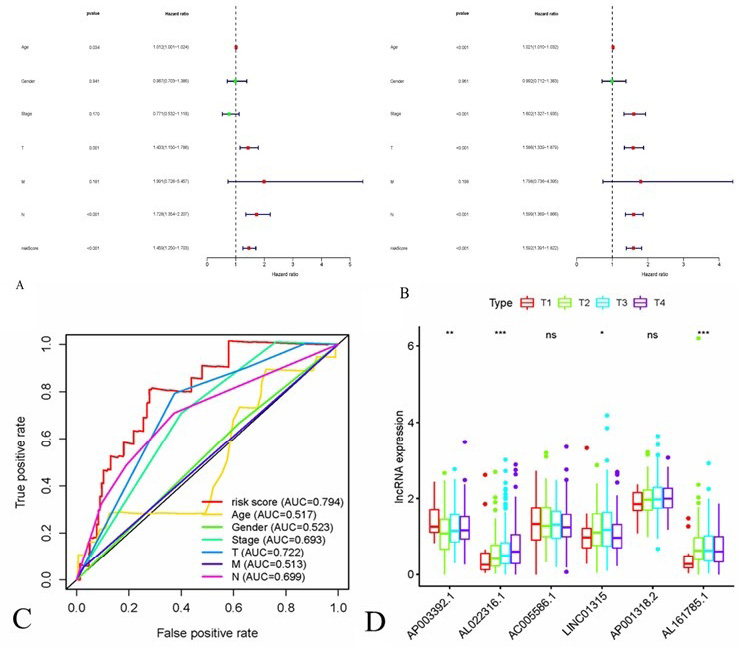
Correlations between risk score of the 10 immune-related lncRNA-based model with clinicopathological characteristics. The Cox regression analysis for evaluating the independent prognostic value of the risk score. Univariate (A) and multivariate Cox regression analyses (B). (C) A comparison of 5-year ROC curves with other common clinical characteristics. (D) The box-plot showed that The box-plot showed that there were statistical different expressions of the candidate immune-related lncRNAs in T stage.
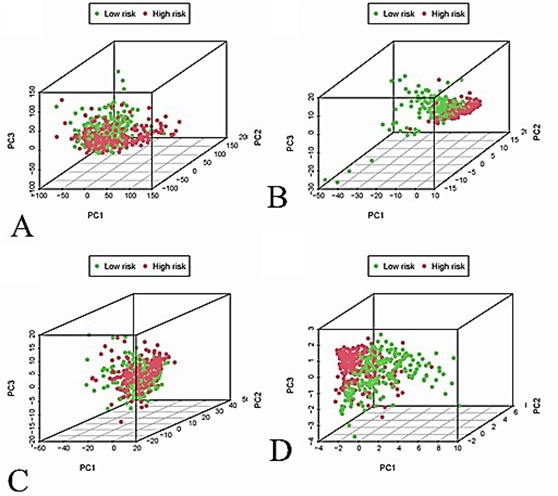
PCA analysis. (A) all genes; (B) immune genes; (C) immune LncRNAs; (D) risk genes. Red and green dots, respectively, represent the high-risk and low-risk groups.

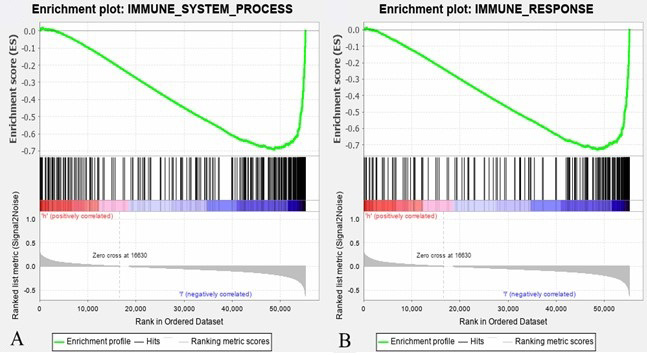
Gene set enrichment analysis (GSEA). Immune-related genes were screened out utilizing GSEA in immune system process gene sets. GSEA was made utilizing immune system process gene sets (A) and immune response gene sets (B).
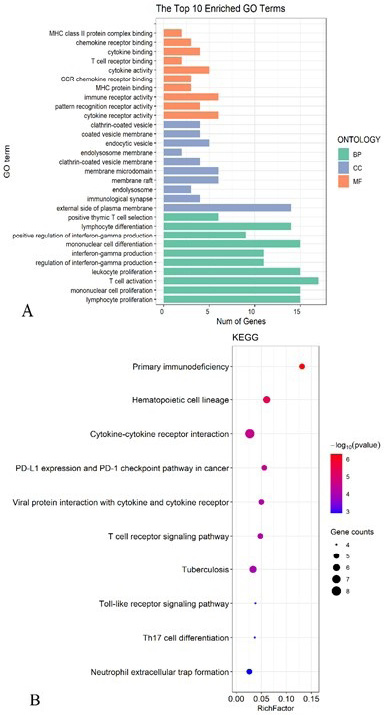
GO and KEGG enrichment analyses for the differentially expressed genes between the high-risk group and the low-risk group. (A) GO enrichment analysis. (B) KEGG enrichment analysis.


