
Histomorphometrical and Histochemical Study of Caecum in Adult Muscovy Ducks (Cairina moschata)


Histomorphometrical and Histochemical Study of Caecum in Adult Muscovy Ducks (Cairina moschata)
Thekra Fadel Saleh, Omar Younis Altaey*
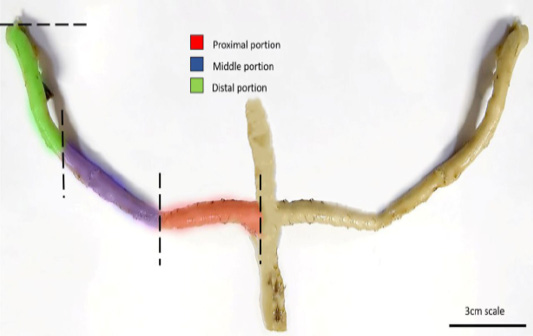
Photograph illustrates caecum of Muscovy duck with it is distinct portions, scale bar= 3cm.
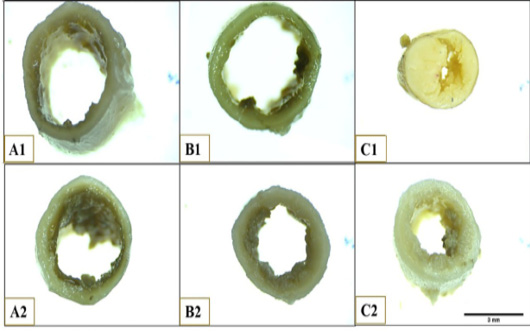
Photograph illustrates the lumen and wall of Muscovy duck’s caecum at anterior end of proximal portion (A1), posterior end of proximal portion (A2), anterior end of middle portion (B1), posterior end of middle portion (B2), anterior end of distal portion (C1), posterior end of distal portion. Scale bar =3mm

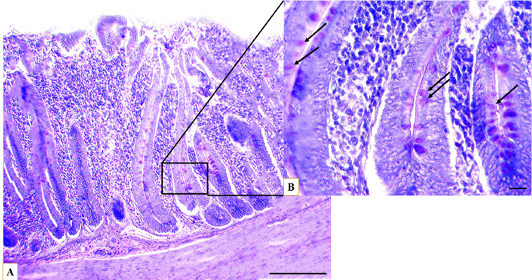
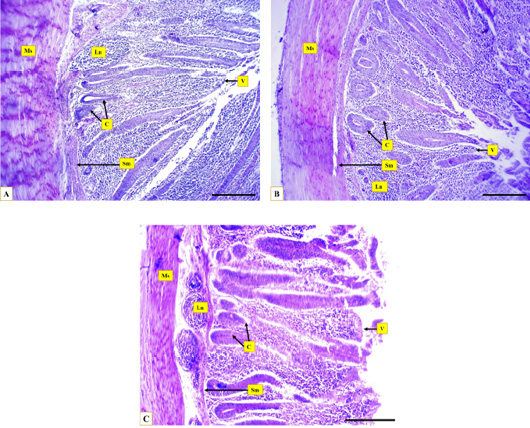
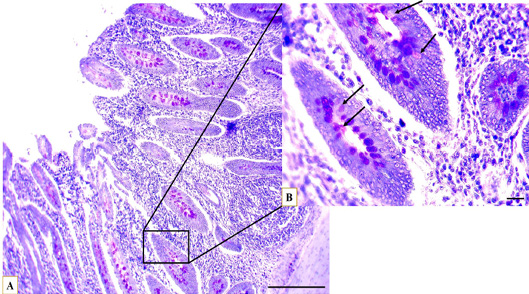
Microphotographs show the layers of Muscovy duck’s caecum, the muscular layer (Ms), the submucosa (Sm), caecal crypts (C), caecal villi (V), the lymph nodules (Ln) at proximal portion (A), middle portion (B), distal portion (C), Hematoxylin and eosin stain, Scale bar = 200µm.
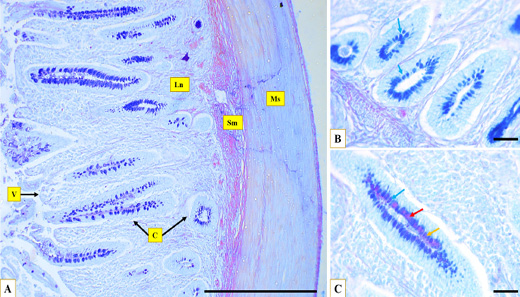
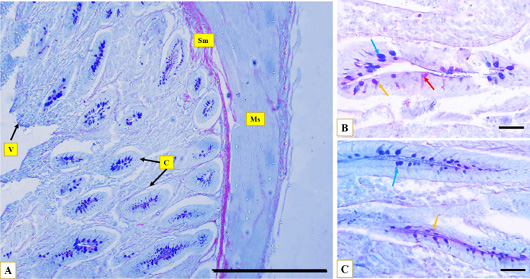
Microphotographs show the glycoprotein distribution through the caecum, the muscular layer (Ms), the submucosa (Sm), caecal crypts (C), caecal villi (V), the lymph nodules (Ln) at proximal portion (A), at the basal crypt (B), and at the longitudinal crypt (C), acidic reaction (blue arrow) neutral reaction (red arrow), and mixed reaction (yellow arrow), AB/PAS stain, (A) Scale bar=200 µm, (B)(C) Scale bar=20 µm.


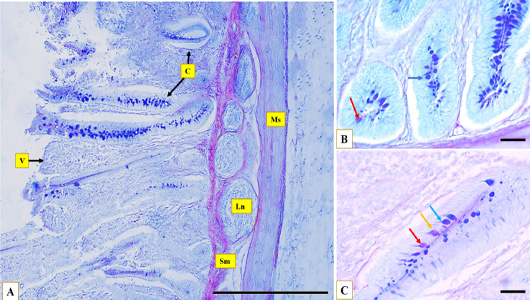
Microphotographs show the glycoprotein distribution through the caecum, the muscular layer (Ms), the submucosa (Sm), caecal crypts (C), caecal villi (V), the lymph nodules (Ln), at distal portion (A), at the basal crypt (B), and at the longitudinal crypt (C), acidic reaction (blue arrow), neutral reaction (red arrow), and mixed reaction (yellow arrow), AB/PAS stain, (A) Scale bar=200 µm, (B)(C) Scale bar=20 µm.

Microphotographs show the glycosaminoglycans distribution through the caecum, at proximal portion (A), the longitudinal crypt (B) GAGs containing goblet cells (arrows), toluidine blue stain, (A) Scale bar=200 µm, (B) Scale bar=20 µm.

Microphotograph show the glycosaminoglycans distribution through the caecum, at distal portion (A), the longitudinal crypt (B) GAGs containing goblet cells (arrows), toluidine blue stain, (A) Scale bar=200 µm, (B) Scale bar=20 µm.

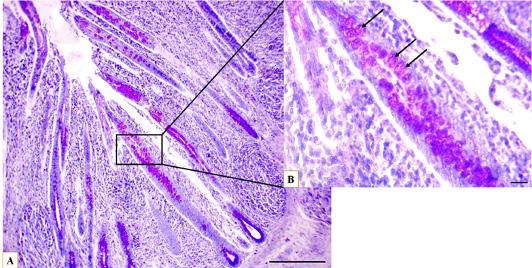
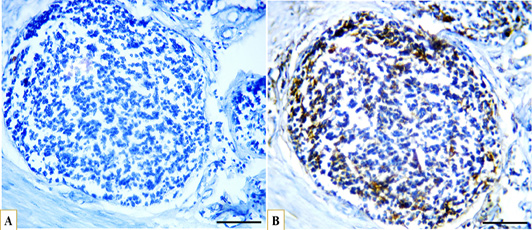
Microphotographs showing immunohistochemical expression of CD40 in B lymphocytes in the proximal caecal portion and distribution of B lymphocytes (A) control with negative CD40 expression, (B) strong positive expression of CD40 (brown) localized to the cell membrane of B lymphocytes (blue), IHC, scale bar = 50 µm.

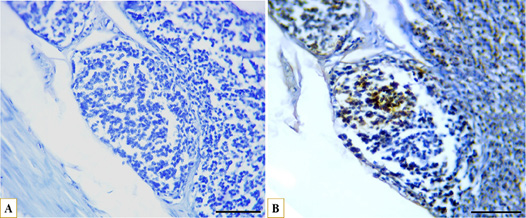
Microphotographs showing immunohistochemical expression of CD40 in B lymphocytes in the middle caecal portion and distribution of B lymphocytes (A) control with negative CD40 expression, (B) strong positive expression of CD40 (brown) localized to the cell membrane of B lymphocytes (blue), IHC, scale bar = 50 µm.

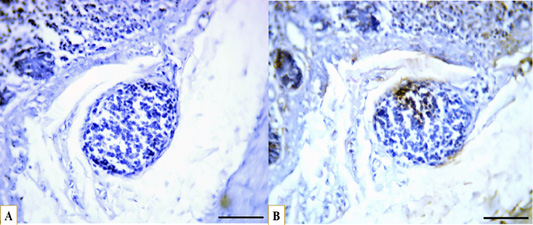
Microphotographs showing immunohistochemical expression of CD40 in B lymphocytes in the distal caecal portion and distribution of B lymphocytes (A) control with negative CD40 expression, (B) strong positive expression of CD40 (brown) localized to the cell membrane of B lymphocytes (blue), IHC, scale bar = 50 µm.

