
Heavy Metals Accumulation in Vegetables Irrigated with Industrial Influents and Possible Impact of such Vegetables on Human Health


Research Article
Heavy Metals Accumulation in Vegetables Irrigated with Industrial Influents and Possible Impact of such Vegetables on Human Health
Fawad Ali1 *, Hidayat Ullah2, Ikhtiar Khan1
1Institute of Chemical Sciences, University of Peshawar, Peshawar, Khyber Pakhtunkhwa, Pakistan; 2Institute of Chemical Sciences, Gomal University, Dera Ismail Khan, Pakistan.
Abstract | The practice of using highly polluted wastewater for irrigation by local farmers since long has contaminated the soil and now the pollution is being transferred to our food chain. An investigation has been done to ascertain toxic heavy metal concentration in the wastewater, irrigated soil, their accumulation in vegetables, and potential human health risks. The results reveal that Cr concentration in the wastewater, Cd and Zn in soil and in vegetables have been found well above the permissible limits of World Health Organization (WHO) which may lead to a detrimental effect on soil quality, leading to food contamination. The extractable concentration of metals viz Pb, Cr, Cd and Zn through ammonium bicarbonate diethylenetriaminpenta acetic acid (AB-DTPA) showed significant differences between the two studied localities. Linear regression analysis indicates that concentration of the heavy metal (Pb, Cr, Cd, Ni, Zn) in vegetables are significantly correlated at R2 value of 0.956 at P≤0.001 with their extractable concentration in soil. Health risk index (HRI) has been found>1 for Pb in Abelmoschus esculentus while rest of the heavy metals have been noted less than 1 indicating relative absence of risk concerned with ingestion of adulterated vegetables. This study highlights that health risk assessment of this unhygienic practice is important to provide information about any serious threat to the health of the local population.
Received | January 09, 2017; Accepted | August 11, 2017; Published | September 19, 2017
*Correspondence | Fawad Ali, Institute of Chemical Sciences, University of Peshawar, Peshawar, Khyber Pakhtunkhwa, Pakistan; Email: fawadalistd@upesh.edu.pk
Citation | Ali, F., H. Ullah and I. Khan. 2017. Heavy metals accumulation in vegetables irrigated with industrial influents and possible impact of such vegetables on human health. Sarhad Journal of Agriculture, 33(3): 489-500.
DOI | http://dx.doi.org/10.17582/journal.sja/2017/33.3.489.500
Keywords | Heavy metals, Wastewater, Food chain, Contamination, Vegetables, Population
Introduction
Wastewater is used for irrigation due to lack of freshwater and ground water in urban areas. The increase in water deficiency problem has adverse effects on the development, human life and quality of environment all over the globe. People normally use wastewater because of its affordable price along with high quantity of nutrients. Heavy metals are important for proper functioning of biological systems but their deficiency or excess could lead to a number of disorders. Urban development changes the quality of environment by accumulation of heavy metals through human activities (Chen et al., 2005). Wastewater increases the yield of vegetables together with contamination of agricultural land. Wastewater contains high amounts of heavy metals which load toxic metals to soil (Mapanda et al., 2005). Abrupt urbanization and industrialization dispose huge amounts of wastewater, which is ultimately used for irrigation in urban and peri urban areas. Continuous irrigation with wastewater accumulates heavy metals in soil and vegetables (Sharma et al., 2007). Heavy metals have negative impact on soil quality and poses threat to human health because of toxic nature (Khan et al., 2008). These toxic metals increase antioxidant activities of enzymes in vegetables. Heavy metals are non-biodegradable and deposits in delicate parts in human body like kidneys, bones etc and cause serious health disorders. Other serious health risks such as growth retardation, psycho-social behaviour disabilities and gastro intestinal cancer develop due to consumption of contaminated food. Wastewater irrigation is carried out in urban areas of Peshawar city, Khyber Pakhtunkhwa (KPK), Pakistan. Therefore the main objective of the present investigation is to quantify the concentration levels of heavy metals in water, soil, their transfer and accumulation in vegetables irrigate with wastewater and the associated potential human health risk.
Materials and methods
Site description
Peshawar is the capital city of Khyber Pakhtunkhwa Province, Pakistan having an area of 77 km2 with a population of 1, 785, 000. It is situated between 34.0150° N and 71.5805° E at the north west of Pakistan. Climate of Peshawar is semi arid with average maximum temperature of more than 40oC in hottest month and with mean minimum temperature of 4oC in the coolest month. The mean annual precipitation level is 400 mL and highest level recorded up till now was 904.5 mL. Hayatabad Industrial Estate discharges effluents passing from southwest to northeast ultimately flowing to River Kabul which is main irrigating canal of Peshawar (Shakirullah et al., 2005). The study area was divided into two locations (A and B) receiving industrial wastes and domestic waste and about forty two different micro sites from the two locations were selected where wastewater was used for irrigation purposes. Location A micro sites consist of Nasirbagh, Agriculture university, Board Bazaar area, Arbab road, Tehkal bala,Tehkal payan and Defence colony and in Locations B were Pir bala, Dag lar, Yousaf karkhana, Babu garhe, Kababyan, Hasangarhe and Tablighi markaz (Figure 1). Wastewater samples were collected from irrigation channels in the north and north east of the municipal area of Peshawar city (area between warsak road and university road). Location A receives more industrial effluents as compared to location B and is at risk of contamination.
Water sampling and digestion
Wastewater samples were collected in high density pre cleaned polythene bottles. The empty bottles were
first washed with metal free soap and then rinsed with 10% HNO3 to avoid contamination and finally washed with double de-ionized water (Chary et al., 2008). The wastewater was collected during the period January, 2014 to December, 2014. Some important parameters like pH and EC were measured at the time of sample collection. Then collected samples were directly carried to laboratory and about 1 mL concentrated nitric acid was used for each sample to combat microbial growth. The samples were placed at room temperature for heavy metals detection. Heavy metals were measured with Atomic Absorption Spectrophotometer (AAS, Perkin- Elmer 700).
Soil sampling and digestion
Soil samples were taken from the top layer (0-20 cm) manually through plastic shovel. Samples were taken in tightly packed zip plastic bag. Soil samples were manually cleaned by removing leaves, rocks particles etc using standard sampling technique. Soil samples were oven dried and then sieved by passing through 2 mm sieve and then stored in polythene bags. About 20 g of 0.05 M ammonium bi-carbonate diethylenetriaminepenta acetic acid (AB- DTPA) at pH 7 was added to air dried 10 g sample and then after shaking for 30 min, the filtrate were used for heavy metals deter- mination using Atomic Absorption Spectrophotom- eter (AAS, Perkin- Elmer 700) (Lei et al., 2008) in Centralized Resource Laboratory, University of Peshawar, Pakistan.
Vegetables sampling and digestion
Vegetable samples of lady’s finger (Abelmoschus esculentus) and tomatoes (Lycopersicon esculentum) were collected from the two selected zones in replicates and were stored in pre cleaned polythene bags. The samples were washed with tap water to remove the dirt of deposition like soil particles. Selected parts of vegetables were oven dried and then ground to powder form for digestion (Jamali et al., 2009). 1 g vegetable samples were taken and digested by 15 mL tri acid i.e. HNO3, HClO4, and H2SO4 at 5:1:1 ratio at 80oC until the solution became transparent and was filtered with whatman no. 42 filter paper. The volume of filtrate was made 50 mL with double de-ionized water and was used for heavy metal determination using AAS.
Data analysis
Transfer factor (TF): Transfer factor is the amount of metal transferred from soil to vegetables. The concentration was determined in the extracts of soil and vegetables on dry weight premise. The ratios ˃ 1 shows metal accumulation in vegetables by transfer from soil.
Transfer factor was calculated as:
TF = Cvegetable / Csoil (Liu et al., 2005)
Where;
Cvegetable: Concentration of metal in the vegetable; Csoil: Concentration of metal in soil.
Daily intake of metals (DIM): The normal daily admission of vegetables in adult and children was obtained during study through a survey. The daily intakes of metals were determined by mathematical relation;
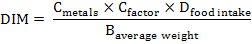
Where;
Cmetal: Toxic metal uptake in vegetable; Cfactor: Transformation element (0.085); Dfood intake: Daily intake of vegetable; Baverage weight: Average body weight.
Both male and female grown- ups (18- 60 years) and youngsters (7- 17 years) were considered in poll review. Normal weight for grown-ups and youngster body were proposed to be 60 kg and 35 kg, respectively (Chary et al., 2008).
Health risk index (HRI): The health risk index was figured as the proportion of assessed presentation of test harvests and oral reference measurement (Cui et al., 2004). The HRI ˃1 was considered as the uncovered population is not safe.

Where;
DIM: Daily intake of metals; RfD: Oral reference dose of US Environmental Protection Agency (USEPA, 2002).
Statistical analysis
Statistical Package for Social Sciences, (SPSS) software version 22 was used for statistical analysis of data. Correlation, regression and t- test were applied to find out about relationships between metals.
Results and Discussion
Physico- chemical analysis of wastewater
Physical characteristics and their statistical data are
Table 1: Physico- chemical parameters and heavy metals of wastewater used for irrigation of lady’s finger and tomatoes in Peshawar.
| PH | EC (dS/m) | TS (mg/L) | TSS (mg/L) | TDS (mg/L) | Pb (mg/L) | Cr (mg/L) | Cd (mg/L) | Ni (mg/L) | Zn (mg/L) | |
| Wastewater used for irrigation of lady’s finger in location A | ||||||||||
| Mean | 7.7-9.4 | 1.5-2.6 | 860-1235 | 350-495 | 435-700 | 0.645-1.394 | 9.254-18.365 | 0.012-0.031 | 0.431-0.574 | 0.056-0.097 |
| Range Sd | 8.6 (0.54) | 1.9 (0.35) | 1056 (113) | 420 (44.3) | 568 (82.4) | 0.978 (0.316) | 13.979 (3.266) | 0.021 (0.007) | 0.514 (0.049) |
0.077 (0.015) |
| Wastewater used for irrigation of lady’s finger in location B | ||||||||||
| Mean | 7.4-9.4 | 1.1-2.3 | 850-1160 | 340-465 | 390-620 | 0.569-1.135 | 1.023-12.985 | 0.011-0.023 | 0.314-0.664 | 0.021-0.083 |
| Range Sd | 8.4 (0.64) | 1.5 (0.37) | 1020 (109.78) | 393 (42.83) | 547.8 (65.8) | 0.788 (0.180) | 7.609 (3.237) | 0.016 (0.004) | 0.477 (0.133) | 0.058 (0.022) |
| t test for mean wastewater location A vs B | ||||||||||
| ns | * | Ns | * | Ns | * | * | * | ns | * | |
| Wastewater used for irrigation of tomato in location A | ||||||||||
| Mean | 7.4-9.3 | 1.1-2.6 | 880-1258 | 340-480 | 440-750 | 0.525-1.379 | 9.235-18.951 | 0.016-0.048 | 0.356-0.859 | 0.061-0.098 |
| Range Sd | 8.3 (0.63) | 1.8 (0.47) | 1079 (121.8) | 404 (48.6) | 586 (112) | 0.929 (0.248) | 13.529 (3.363) | 0.026 (0.010) | 0.540 (0.147) | 0.083 (0.012) |
| Wastewater used for irrigation of tomato in location B | ||||||||||
| Mean | 7.3-9.2 | 1.1-2.1 | 840-1195 | 330-410 | 390-600 | 0.556-0.975 | 5.147-11.586 | 0.011-0.023 | 0.325-0.665 | 0.051-0.088 |
| Range Sd | 8.4 (0.63) | 1.4 (0.32) | 982 (117) | 380 (21.6) | 524 (68) | 0.791 (0.147) | 8.758 (1.871) | 0.014 (0.004) | 0.512 (0.126) | 0.064 (0.012) |
| t test for mean wastewater location A vs B | ||||||||||
| ns | * | * | * | * | * | * | * | * |
* |
|
shown (Table 1). Physico- chemical analysis of wastewater showed significant differences for EC and TSS for lady’s finger and EC, TS, TSS and TDS for tomatoes in the two locations. Significant differences were not found in pH, TS and TDS in lady’s finger and also in pH for tomatoes. High values of EC and pH depend on the type of chemicals disposed off by the factories. pH (8.9) and TSS (1980 mg L-1) were found higher than permissible limit of National Environmental Quality Standards (NEQS) in previous study of Hayatabad Industrial Estate (HIE), Peshawar, Pakistan (Tariq et al., 2006). Sewage water of Peshawar city was analyzed which revealed low level of TSS (7 mg L-1) (Hussain et al., 2012). High level of TSS was found in wastewater of Hattar Industrial Estate (Hussain et al., 2014). Significant differences were found in total dissolved solid and total suspended solid in wastewater. The amount of total solid varied from place to place in different samples because of variation in source of sewage contamination. Different types of contaminants are added to wastewater in different areas, which results into changes of total solids in wastewater.
Heavy metals in wastewater
Heavy metal concentration in wastewater used for irrigation of lady’s finger and tomatoes is given in (Table 1). Amounts of Pb, Cr, Cd and Zn differ significantly for lady’s finger and tomatoes except for Ni in lady’s finger. No significant differences were found for lady’s finger and tomatoes in location A and B. Concentration of heavy metals in wastewater depends upon the kind of discharges from the factories. Heavy metals disposed to wastewater, find its way to soil and then transferred to vegetables. The average concentration of Cr (10.96 mg L-1) and Ni (0.50 mg L-1) in the two locations of the wastewater was higher than permissible limit. Ni and Pb were observed to be higher than permissible limit of NEQS in previous work in Peshawar (Tariq et al., 2006). Cr was found within permissible range while Cd, Pb and Ni were found in toxic range in sewage contaminated water (Perveen et al., 2012). In one study carried out in Peshawar, Ni (0.65 mg L-1) was found to be 30 times higher whereas Cd (0.03 mg L-1) and Pb (0.09 mg L-1) were found to be 10 times higher than World Health Organization (WHO) recommended values (Khan et al., 2011). Higher concentrations of heavy metals like Pb, Zn, Cu, Co, Cr, As, Cd, Fe, Mn and Ni were also found in wastewater (Rattan et al., 2002). High concentration of heavy metal near source of effluent discharge was also reported. Physico- chemical analysis of soil samples and wastewater found out loading of heavy metals in to agricultural fields. The mean concentration of Zn was found within safe range of permissible limits. All physical parameters were positively significantly correlated with heavy metals in wastewater used for irrigation of tomatoes (Table 5). In wastewater irrigating lady’s finger, pH was negatively significantly correlated with Cd and Ni, where as positive significant correlation was observed for EC with Cr, for TS with TSS, for TSS with TDS while Pb was positively significantly correlated with Cr, Cd, Ni and Zn.
Heavy metals extractable in soil: The ammonium bicarbonate diethylenetriamine penta acetic acid extractable concentrations of Pb, Cr, Cd, Ni and Zn in soil of location A and B are given (Table 2). The AB- DTPA extractable concentrations of Pb, Cr, Cd, Ni and Zn in soil irrigated with wastewater in location A and B were substantially greater. The mean extractable concentrations of Cd (0.91 mg kg-1) and Zn (4.68 mg kg-1) in soil of both locations were above the allowable limit of 0.31 mg kg-1 and 1.50 mg kg-1 of World Health Organization (WHO, 1996). However, the mean extractable concentrations of the both locations for Pb (6.35 mg kg-1), Cr (0.91 mg kg-1) and Ni (3 mg kg-1) were within the permissible levels. Previous study concluded higher accumulation of heavy metals in sewage irrigated soil in comparison to less polluted water irrigated soil (Khurana et al., 2004). Significant differences were found in all heavy metals for lady’s finger and tomatoes except Ni in case of soil irrigating lady’s finger. No significant differences were observed in location A for heavy metals in soil used for irrigation of lady’s finger and tomatoes. While in location B, significant difference was found for Pb, Ni and Zn. Previous study found out quality enhancement of soil with sewage water on one hand and metal cations deposition on the other hand (Malla et al., 2007). In soil irrigating lady’s finger, Pb was positively significantly correlated with Cr (r2=0.945), Cd (r2=0.948), Ni (r2=0.939) and Zn (r2=0.941) at P≤0.0001. Pb was positively significantly correlated with Cr (r2=0.950), Cd (r2=0.965), Ni (r2=0.957) and Zn (r2=0.907) in tomatoes respectively (Table 6).
Heavy metals concentration in vegetables: The deposition and uptake of toxic metals such as Cr, Cd, Ni, Pb and Zn was significant for lady’s finger (Figure 2). There were significant differences in concentrations of Pb, Cd and Zn in tomatoes (Figure 3) while no substantial difference was seen for Cr and Ni between the two locations A and B. No significant difference was observed for Cr in location A between lady’s finger and tomatoes. In case of location B, no significant difference was observed for Cd. Significant difference was observed in Zn concentration of lady’s finger and tomatoes. There was significant difference found in Zn concentration between lady’s finger and tomatoes. Concentrations of heavy metals were found to be higher in lady’s finger and tomatoes grown on soil contaminated with wastewater. Concentrations of Zn and Cd were higher followed by Pb, Cr and Ni for lady’s finger and tomatoes in the two locations. Higher concentration of Cd was observed in lady’s finger (0.33 mg kg-1) and tomatoes (0.31 mg kg-1) which was higher than permissible limit of 0.02 mg kg-1. Zn also exceeded permissible limit of 5 mg/kg in lady’s finger
Table 2: Heavy metal concentration extracted by AB-DTPA solution from soil irrigated with wastewater used for irrigation of lady’s finger and tomato in Peshawar.
| Concentration (mg kg-1) | |||||
| Pb | Cr | Cd | Ni | Zn | |
| Extractable conc. in soil used for lady’s finger in location A | |||||
| Range | 0.645-1.394 | 9.254-18.365 | 0.012-0.031 | 0.431-0.574 | 0.056-0.097 |
| Mean ± SD | 0.978 (0.316) | 13.979 (3.266) | 0.021 (0.007) | 0.514 (0.049) | 0.077 (0.015) |
| Extractable conc. in soil used for lady’s finger in location B | |||||
| Range | 0.569-1.135 | 1.023-12.985 | 0.011-0.023 | 0.314 (0.664) | 0.021-0.083 |
|
Mean ± SD |
0.788 (0.180) | 7.609 (3.237) | 0.016 (0.004) | 0.477 (0.133) | 0.058 (0.022) |
| t test for extractable conc. used for lady’s finger in location A vs B | |||||
| * | * | * | ns | * | |
| Extractable conc. in soil used for tomato in location A | |||||
| Range | 0.525-1.379 | 9.235-18.951 | 0.016-0.048 | 0.356-0.859 | 0.061-0.098 |
| Mean ± SD | 0.929 (0.248) | 13.529 (3.363) | 0.026 (0.010) | 0.540 (0.147) | 0.083 (0.012) |
| Extractable conc. in soil used for tomato in location B | |||||
| Range | 0.556-0.975 | 5.147-11.586 | 0.011-0.023 | 0.325-0.665 | 0.051-0.088 |
|
Mean ± SD |
0.791 (0.147) | 8.758 (1.871) | 0.014 (0.004) | 0.512 (0.126) | 0.064 (0.012) |
| t test for extractable conc. in soil used for tomato in location A vs B | |||||
| * | * | * | * | * | |
| Extractable conc. in soil used for lady’s finger in location A | |||||
| Range | 0.645-1.394 | 9.254-18.365 | 0.012-0.031 | 0.431-0.574 | 0.056-0.097 |
| Mean ± SD | 0.978 (0.316) | 13.979 (3.266) | 0.021 (0.007) | 0.514 (0.049) | 0.077 (0.015) |
| Extractable conc. in soil used for tomato in location A | |||||
| Range | 0.525-1.379 | 9.235-18.951 | 0.016-0.048 | 0.356-0.859 | 0.061-0.098 |
|
Mean ± SD |
0.929 (0.248) | 13.529 (3.363) | 0.026 (0.010) | 0.540 (0.147) | 0.083 (0.012) |
| t test for extractable conc. in soil used for irrigation of lady’s finger and tomato in location A | |||||
| ns | ns | ns | ns | ns | |
| Extractable conc. in soil used for lady’s finger in location B | |||||
| Range | 0.569-1.135 | 1.023-12.985 | 0.011-0.023 | 0.314 (0.664) | 0.021-0.083 |
| Mean ± SD | 0.788 (0.180) | 7.609 (3.237) | 0.016 (0.004) | 0.477 (0.133) | 0.058 (0.022) |
| Extractable conc. in soil used for tomato in location B | |||||
| Range | 0.556-0.975 | 5.147-11.586 | 0.011-0.023 | 0.325-0.665 | 0.051-0.088 |
| Mean ± SD | 0.791 (0.147) | 8.758 (1.871) | 0.014 (0.004) | 0.512 (0.126) | 0.064 (0.012) |
| t test for extractable conc. in soil used for irrigation of lady’s finger and tomato in location B | |||||
| * | Ns | ns | * |
* |
|
Numbers in parenthesis represents standard deviation, ns not significant, * p<0.05.
(27.27 mg kg-1) and tomatoes (17.04 mg kg-1). Previous findings reported that Cd concentration was high in vegetable than the present study (Kumar et al., 2009). Maximum deposition of toxic metals like Pb, Cd and Fe in vegetable was reported (Delbari et al., 2013). In lady’s finger, concentration of Cd (0.33 mg kg-1) crossed the permissible limit of SEPA, 2005 which was 0.1-0.2 mg kg-1 (Kumar et al., 2014). However, concentrations of Pb, Ni and Zn were substantially lower than SEPA limit in all selected wastewater irrigated lady’s finger samples. The mean concentration of Cd (0.31 mg kg-1) in tomatoes exceeded the permissible level of SEPA, 2005 while other metals such Pb, Cr, Ni and Zn were within permissible range. The mean concentration of Pb in lady’s finger (0.96 mg kg-1) and tomatoes (0.51 mg kg-1) exceeded safe level set by European Union (EU) 2006 (0.3 mg/kg) but were with permissible limit of (WHO/FAO, 2007) and Indian Standard (Awashti, 2000).
The average concentration of Cr in lady’s finger (0.26 mg kg-1) and tomatoes (0.33 mg kg-1) were within
Table 3: Relationship between concentrations of metals in lady’s finger and tomatoes and their extractable concentration in soil of Peshawar.
|
Soil concentration (mg kg-1) |
||||
| Elem-ents | Okra |
Tomato |
||
| Location A | Location B | Location A | Location B | |
| Pb | VPb=0.058SPb+ 0 .534 | VPb = 0.070SPb + 0.564 | VPb=0.051SPb+ 0.169 | VPb=0.043SPb+ 0.294 |
|
R2= 0.754(P<0.0001) |
R2=0.820(P<0.0001) |
R2= .758(P<0.007) |
R2=.752(P<.0001) |
|
| Cr | VCr=0.335SCr- 0.030 | VCr=0.232SCr+ 0.072 | VCr=0.174SCr+ 0.154 | VCr=0.124SC+ 0.253 |
|
R2=0.865(P<0.0001) |
R2=0.828(P<0.0001) |
R2=0.864(P<0.0001) |
R2=0.620(P<0.0001) |
|
| Cd | VCd=0.169SCd+ 0.188 | VCd=0.344SCd+ 0.100 | VCd=0.037SCd+ 0.286 | VCd=0.234SCd+ 0.168 |
|
R2= 0.711(P<0.0001) |
R2=0.878(P<0.0001) |
R2= .334(P<0.0001) |
R2=0.814(P<0.0001) |
|
| Ni | VNi=0.308SNi+ 1.631 | VNi=0.529SNi+ 0.247 | VNi=0.232SNi+ 2.483 | VNi=0.391SNi+ 2.329 |
|
R2=0.631(P<0.0001) |
R2= 0.688(P<.0001) |
R2=0.553(P<0.0001) |
R2= 0.369(P<0.0001) |
|
| Zn | VZn=1.316SZn+ 24.076 | VZn=3.100SZn+ 3.929 | VZn=0.630SZn+ 14.535 | VZn=1.030SZn+ 11.911 |
|
R2= 0.956(P<0.0001) |
R2= .850(P<0.0001) |
R2=0 .722(P<.0001) |
R2= 0.943(P<0.0001) |
|
Significant value is at P<.0.05, V vegetable, S soil
Table 4: Transfer factor of heavy metals in lady’s finger and tomatoes grown in soil irrigated with wastewater in Peshawar.
| TF | |||||
| Pb | Cr | Cd | Ni | Zn | |
| TF in lady’s finger in location A | |||||
| Range | 0.10-0.17 | 0.21-0.37 | 0.22-0.44 | 0.59-1.36 | 3.82-8.71 |
| Mean ± SD | 0.13 (0.019) | 0.30 (0.041) | 0.33 (0.061) | 0.78 (0.195) | 5.564 (1.412) |
| TF in lady’s finger in location B | |||||
| Range | 0.14-0.21 | 0.26-0.46 | 0.44-0.85 | 0.45-0.78 | 6.03-9.60 |
| Mean ± SD | 0.17 (0.019) | 0.36 (0.054) | 0.57 (0.125) | 0.66 (0.08) | 7.96 (1.11) |
| t test for TF in lady’s finger in location A vs B | |||||
| * | * | * | * | * | |
| TF in tomato location A | |||||
| Range | 0.06-0.08 | 0.27-0.39 | 0.15-0.43 | 0.61-1.33 | 2.07-5.07 |
| Mean ± SD | 0.07 (0.007) | 0.32 (0.046) | 0.28 (0.089) | 0.91 (0.207) | 3.59 (0.845) |
| TF in tomato in | location B | ||||
| Range | 0.08-0.13 | 0.35-0.88 | 0.42-1 | 1-1.81 | 3.24-6.48 |
| Mean ± SD | 0.10 (0.011) | 0.58 (0.152) | 0.599 (0.179) | 1.44 (0.275) | 4.143 (0.949) |
| t test for TF in tomato in location A vs B | |||||
| * | * | * | * |
* |
|
Numbers in parenthesis represents standard deviation, ns not significant, * p<0.05 significant
allowed range of European Union (2.3 mg kg-1) and Indian Standard, Awashti, 2000 (20 mg kg-1) respectively. Concentration of Cd in both vegetables exceeded limit of WHO/FAO (2007) and EU. But remains in safe limit of Indian Standard (Awashti, 2000; Al-Busaidi et al., 2015). Average value of Ni in both vegetable exceeded the limit of 1.5 mg kg-1 (Indian Standards, Awashti, 2000). Zn concentration in all selected sites falls in permissible limit of WHO/FAO (2007) and Indian Standard (Awashti, 2000). Significant correlation was present between concentration of heavy metals in vegetables (lady’s finger and tomatoes) and extractable concentration in soil (Table 3).
Transfer of toxic metals from soil to vegetable was important part of human impact through food chain. TF is the ratio between concentrations of heavy metals in vegetable to that of extractable concentration in soil. There was significant difference in the transfer of heavy metals in the two locations (A and B). Average TF value for toxic metals including Pb, Cr, Cd, Ni and Zn for lady’s finger was 0.15, 0.33, 0.45, 0.72 and 6.76 and for tomatoes was 0.08, 0.45, 0.43, 1.17 and 3.86 respectively (Table 4). The trend of heavy metal TF in lady’s finger was in the order of Zn˃Ni˃Cd˃Cr˃Pb and for tomatoes the trend were Zn˃Ni˃Cr˃Cd˃Pb respectively.
Correlation between selected heavy metals in lady’s finger and tomatoes were determined to find the sources of metals and were given in (Table 6). In location A of lady’s finger, Pb was positively significantly correlated with Cr (r2=0.936), Cd (r2=0.873), Ni (r2=0.718) and Zn (r2=0.968) and in location B, Pb was positively significantly correlated with Cr (r2=0.914), Cd (r2=0.914), Ni (r2=0.820) and Zn (r2=0.956) at P<0.01 level respectively. In location A of tomatoes, Pb was positively significantly correlated (r2=0.508) at P<0.05 with Cd, positively significantly correlated with Cr (r2=0.876), Ni (r2=0.839) and Zn (r2=0.949) at P<0.01 while in location B, the same positive significant correlation of Pb was observed with Cr (r2=0.894), Cd (r2=0.888), Ni (r2=0.931) and Zn (r2=0.963) at P<0.01 level respectively. The positive significant correlation represents similar and common sources for metals contamination. The overall trend for both locations (A and B) for lady’s finger and tomatoes has a positive significant correlation. No negative significant correlation was found for lady’s finger and tomatoes. Positive correlation between metals indicates use of wastewater for irrigation containing a variety of heavy metals. The accumulation of heavy metals in soil finely transfers to vegetable grown on wastewater irrigated soil.
Daily intake of metals due to consumption of vegetables
Exposure of human to trace metals takes place through various pathways, but important of them was food chain. The daily intake of metal was investigated through mean daily vegetable consumption. The estimated daily intake of metal both for adults and children were shown in (Table 7). Investigation of hazards due to pollutant is based upon the exposure of human to different level of contact. The daily intake of metal value was high for vegetables using wastewater irrigated soil compared to tube well irrigated soil. Because vegetables grown in contaminated soil results in health risks of metals consumptions in comparison to uncontaminated soil. Dietary intake limits for Pb, Cd, Ni, Mn, Co and Cu range from 0.0001 to 0.0005 mg, 0.0002 to 0.0004 mg, 0.5 to 1 mg, 2 to 15 mg, 2.0 to 20.0 mg and 1.2 to 3.0 mg respectively (WHO, 1996). The study investigated that daily uptake of vegetables was free of dangerous threats due to low consumption on daily basis. Other sources such as breathing in dust, use of metal contaminated soil and dermal contact also help in enhancing threats of metal in human. Daily intake of metal for children showed that DIM in wastewater cultivating lady’s finger was greater in the order of Zn (2.02E-2), Ni (1.76E-3), Pb (6.09E-4), Cd (2.25E-4) and Cr (2.01E-4) in location A whereas in location B, using less polluted water for irrigating vegetables, the order for children was Zn (1.22E-2), Ni (5.90E-4), Pb (4.89E-4), Cd (1.00E-4) and Cr (1.00E-4). In case of adults, DIMin wastewater irrigating vegetables was in the order of Zn (1.74E-2), Ni (1.51E-3), Pb (5.23E-4), Cd (2.16E4) and Cr (1.70E-4) in location A and Zn
Table 5: Correlation between Physico- chemical properties and heavy metals in wastewater used for lady’s finger and tomato in urban Peshawar.
| pH | EC | TS | TSS | TDS | Pb | Cr | Cd | Ni | Zn | |
| pH | 1 | 0.804** | 0.882** | 0.836** | 0.883** | 0.871** | 0.703** | 0.624** | 0.898** | 0.746** |
| EC | 0.315* | 1 | 0.937** | 0.894** | 0.866** | 0.907** | 0.904** | 0.882** | 0.794** | 0.903** |
| TS | 0.035 | -0.048 | 1 | 0.861** | 0.890** | 0.919** | 0.878** | 0.822** | 0.858** | 0.920** |
| TSS | 0.010 | 0.366* | 0.447** | 1 | 0.931** | 0.897** | 0.883** | 0.841** | 0.795** | 0.770** |
| TDS | 0.089 | 0.099 | 0.364* | 0.546** | 1 | 0.928** | 0.893** | 0.827** | 0.827** | 0.829** |
| Pb | -0.248 | 0.252 | -0.351* | -0.142 | 0.692** | 1 | 0.889** | 0.863** | 0.912** | 0.836** |
| Cr | -0.160 | 0.503** | 0.005 | 0.176 | -0.387* | 0.839** | 1 | 0.928** | 0.717** | 0.903** |
| Cd | -0.401** | 0.303 | -0.234 | -0.026 | 0.453** | 0.878** | 0.817** | 1 | 0.713** | 0.835** |
| Ni | -0.589** | -0.066 | 0.111 | 0.063 | -.402** | 0.649** | 0.634** | 0.682** | 1 | 0.701** |
| Zn | -0.273 | 0.317* | 0.010 | 0.256 | -0.388* | 0.807** | 0.884** | 0.791** | 0.785** |
1 |
** Correlation is significant at 0.01 level, * Correlation is significant at 0.05 level, Values above 1 are for wastewater tomato.
Table 6: Correlation of heavy metals in soil and vegetables.
|
PbS |
CrS |
CdS |
NiS |
ZnS |
PbV |
CrV |
CdV |
NiV |
ZnV |
|
|
PbL |
1 | 0.795* | 0.757* | 0.393* | 0.511* | 1 | 0.914** | 0.914** | 0.820** | 0.956** |
|
CrL |
0.945* | 1 | 0.931* | 0.811* | 0.869* | 0.936** | 1 | 0.940** | 0.810** | 0.925** |
|
CdL |
0.948* | 0.965* | 1 | 0.805* | 0.867* | 0.873** | 0.884** | 1 | 0.786** | 0.918** |
|
NiL |
0.939* | 0.947* | 0.944* | 1 | 0.954* | 0.718** | 0.794** | 0.783** | 1 | 0.876** |
|
ZnL |
0.941* | 0.954* | 0.969* | 0.972* | 1 | 0.968** | 0.960** | 0.924** | 0.752** | 1 |
|
PbT |
1 | 0.880* | 0.593* | 0.798* | 0.876* | 1 | 0.894** | 0.888** | 0.931** |
0.963** |
|
CrT |
0.950* | 1 | 0.713* | 0.770* | 0.837* | 0.876** | 1 | 0.852** | 0.912** | 0.870** |
|
CdT |
0.965* | 0.958* | 1 | 0.627* | 0.759* | 0.508* | 0.735** | 1 | 0.841** | 0.908** |
|
NiT |
0.957* | 0.944* | 0.923* | 1 | 0.778* | 0.839** | 0.730** | 0.265 | 1 | 0.864** |
|
ZnT |
0.907* | 0.876* | 0.914* | 0.866* | 1 | 0.949** | 0.928** | 0.526* | 0.842** |
1 |
L for ladys finger, T for tomatoes, S for soil, V for vegetables; * Correlation in significant at 0.01 level, values above 1 are for location B
Table 7: DIM and HRI for adults and children consuming vegetables grown on wastewater irrigated soil.
| lady’s finger | DIM Location A | DIM Location B | HRI Location A | HRI Location B | ||||
| Adult | Children | Adult | Children | Adult | Children | Adult | Children | |
| Pb | 5.23E-4 | 6.09E-4 | 4.212E-4 | 4.899E-4 | 1.30E-0 | 1.52E-0 | 1.05E-1 | 1.22E-1 |
| Cr | 1.72E-4 | 2.01E-4 | 8.64E-5 | 1.005E-4 | 5.76E-1 | 6.70E-1 | 5.76E-5 | 6.70E-5 |
| Cd | 2.16E-4 | 2.51E-4 | 8.64E-5 | 1.005E-4 | 2.16E-1 | 2.51E-1 | 8.64E-2 | 1.00E-1 |
| Ni | 1.51E-3 | 1.76E-3 | 5.077E-4 | 5.903E-4 | 7.58E-2 | 8.82E-2 | 2.53E-2 | 2.95E-2 |
| Zn | 1.74E-2 | 2.02E-2 | 1.05635E-2 | 1.22842E-2 | 5.80E-2 | 6.75E-2 | 3.52E-2 | 4.09E-2 |
Tom- atoes |
||||||||
| Pb | 2.916E-4 | 3.391E-4 | 2.592E-4 | 3.015E-4 | 7.29E-2 | 8.47E-2 | 6.48E-2 | 7.53E-2 |
| Cr | 1.836E-4 | 2.135E-4 | 1.674E-4 | 1.947E-4 | 1.22E-4 | 1.42E-4 | 1.11E-4 | 1.29E-4 |
| Cd | 1.782E-4 | 2.072E-4 | 1.512E-4 | 1.758E-4 | 1.78E-1 | 2.07E-1 | 1.51E-1 | 1.75E-1 |
| Ni | 1.8362E-3 | 2.1353E-3 | 1.6094E-3 | 1.8715E-3 | 9.18E-2 | 1.06E-1 | 8.04E-2 | 9.35E-2 |
| Zn | 9.694E-3 | 1.12731E-2 | 7.5014E-3 | 8.7233E-3 | 3.23E-2 | 3.75E-2 | 2.50E-1 |
2.90E-2 |
(1.05E-2), Ni (5.07E-4), Pb (4.21E-4), Cd (8.64E-5) and Cr (8.64E-5) in location B respectively. (Randhawa et al. 2014) reported high value of DIM for Pb (4.9E-2) as compared to present value for Pb (5.23E-4) in the study areas of Multan, Pakistan.
The estimated daily intake of metal due to consumption of tomatoes both for adults and children were shown in (Table 7). Daily intake of metal for children showed that DIM in wastewater cultivating tomatoes was greater in the order of Zn (1.12E-2), Ni (2.13E-3), Pb (3.39E-4), Cr (2.13E-4) and Cd (2.07E-4) in Peshawar location A. In case of adults, DIM in wastewater irrigating vegetables was in the order of Zn (9.69E-3), Ni (1.83E-3), Pb (2.91E-4), Cr (1.83E-4) and Cd (1.78E-4) in Peshawar location A respectively. In control areas using less polluted water for irrigating vegetables, the order for children was Zn (8.72E-3), Ni (1.87E-3), Pb (3.01E-4), Cr (1.94E-4) and Cd (1.75E-4) and adult Zn (7.50E-3), Ni (1.60E-3), Pb (2.59E-4), Cr (1.67E-4) and Cd (1.51E-4) in Peshawar location B. (Mehmood et al. 2015) reported high daily intake of Fe, Mn, Ni, Zn and Cu in tomatoes irrigated with wastewater in Faisalabad, Pakistan.
Health risk index in vegetables
In order to assess health risk associated with chemical contaminant, it is important to investigate the level of exposure and risk index. There are various routes of pollutants to human exposure but important one among them is food chain. Dietary vegetables take heavy metals and when such contaminated vegetables were taken by humans can pose health risk. In the current study area, dietary vegetables grown were mostly used in the locality, for that reason the mean metal level were taken for HRI. The data showed that HRI values were less than one indicating that health risk due to uptake of heavy metals were mostly in the safe range. Oral reference doses (RfD) for Cd, Cr, Cu, Ni, Pb, and Zn are 1E-03, 1.5E-0, 4E-2, 2E-2, 3.5E-3, and 0.3E-0 mg/kg/day, respectively (US-EPA, IRIS, 2006). In general, the RfD is an estimate of a daily exposure to the human population that is likely to be without an appreciable risk of deleterious effects during a lifetime (US-EPA, IRIS, 2006). The daily heavy metal intake for both adults and children through the consumption of vegetables in this study area was less than RfD limit set by the USEPA, IRIS (2006). The investigations of the current study showed that dietary vegetables taken from wastewater contaminated soil was free of threat. Some other sources of metal exposure i.e dermal contact, dust inhalation and ingestion were also responsible. The HRI through consumption of vegetables for metals such as Pb, Cr, Cd, Ni and Zn in have values 1.30E-0, 5.76E-1, 2.16E-1, 7.58E-2 and 5.80E-2 for adults while 1.52E-0, 6.70E-1, 2.51E-1, 8.82E-2 and 6.75E-2 for children in location A respectively as given in (Table 7). The overall trend of HRI of metal in adults and children for location A were in the order of Pb˃Cr˃Cd˃Ni˃Zn and Pb˃Cr˃Cd˃Zn˃Ni respectively. The HRI of metals through consumption of lady’s finger in locations B of Peshawar for adults have value 1.05E-1 for Pb, 5.76E-5 for Cr, 8.64E-2 for Cd, 2.53E-2 for Ni and 3.52E-2 for Zn, respectively while for children, HRI for Pb, Cr, Cd, Ni and Zn have value 1.22E-1, 6.70E-5, 1.00E-1, 2.95E-2 and 4.09E-2 respectively. The overall trend of HRI of metal in adults and children in location B were in the order of Pb˃Cd˃Zn˃Ni˃Cr, respectively. Zhuang et al. (2009) found HRI for Cd and Pb exceeding safe limits in lady’s finger irrigated with polluted water in Guangdong, China.
The HRI through consumption of tomatoes for metals such as Pb, Cr, Cd, Ni and Zn in have values 7.29E-2, 1.22E-4, 1.78E-1, 9.18E-2 and 3.23E-2 for adults while 8.47E-2, 1.42E-4, 2.07E-1, 1.06E-1 and 3.75E-2 for children in Peshawar location A as shown in (Table 7). The overall trend of HRI of metal in adults and children for Peshawar location A was in the order of Cd˃Ni˃Pb˃Zn˃Cr, respectively. The HRI of metals through consumption of tomatoes in control areas of Peshawar location B for adults have value 6.48E-2 for Pb, 1.11E-4 for Cr, 1.51E-1 for Cd, 8.04E-2 for Ni, 2.50E-2 for Zn, 5.98E-2 for Cu, 2.11E-2 for Fe and 1.49E-1 for Mn respectively while for children, HRI for Pb, Cr, Cd, Ni and Zn have value 7.53E-2, 1.29E-4, 1.75E-1, 9.35E-2 and 2.90E-2 respectively. The overall trend of HRI of metal in adults and children in the control areas of Peshawar location B were in the order of Zn˃Cd˃Ni˃Pb˃Cr, respectively. Atif et al. (2015) investigated health risk index for tomatoes irrigated with wastewater and reported HRI>1 for Cd (1.10) in the study area. Zhuang et al. (2009) investigated HRI for Cd and Pb crossing permissible limits in tomatoes irrigated with wastewater in Guangdong, China.
Conclusion
The use of wastewater for irrigation over a longer period of time led to accumulation of heavy metals in soil and vegetables in the study areas of Peshawar. Continuous wastewater irrigation caused a buildup of toxic heavy metals in soil which has become more polluted compared to less polluted irrigated soil. There were clear indications of transfer of pollutants from wastewater to soil and then to vegetables. The average concentrations of Pb, Cr, Cd, Ni and Zn were considerably higher in wastewater receiving untreated effluents. The average values of chromium and nickel in wastewater exceed the permissible levels set by WHO. The amount of heavy metals in soil was linked with metal deposition in wastewater, which ultimately results in soil pollution. Results indicated that wastewater irrigated soil was contaminated to lesser extent with Pb, Cr and Ni and greatly enriched with Cd and Zn. The study further suggested that even low concentration of heavy metals in wastewater pose risk to human health by accumulation over a longer time. The results obtained here demand proper legislation, urgent implementation of appropriate safety measures and consistent monitoring of heavy metals release into water and soil. Industrial and municipal effluents must be treated before released into sewage water, in order to combat soil and vegetable contamination.
Acknowledgements
Laboratory facilities provided by Institute of Chemical Sciences, University of Peshawar, are gratefully acknowledged.
Authors Contribution
Fawad Ali performed the experiments and wrote the paper in collaboration of Hidayat Ullah and Ikhtiar Khan.
References
Awashthi, S.K. 2000. Prevention of Food Adulteration Act No 37 of 1954, State rules as amended for 1999 (3rd ed.) New Delhi: Ashoka Law House.
Al-Busaidi, A., B. Shahroona, R. Al-Yahyai and M. Ahmed. 2015. Heavy metal concentraitons in soils and date palms irrigated by groundwater and treated wastewater. Pak. J. Agric. Sci. 52(1): 129-134.
Chen, Y., C. Wang and Z. Wang. 2005. Residues and source identification of persistent organic pollutants in farmland soils irrigated by effluents from biological treatment plants. Environ. Int. 31(6): 778-783. https://doi.org/10.1016/j.envint.2005.05.024
Chary, N.S., C. Kamala and D.S.S. Raj. 2008. Assessing risk of heavy metals from consuming food grown on sewage irrigated soils and food chain transfer. Ecotoxicol. Environ. Safety. 69(3): 513-524. https://doi.org/10.1016/j.ecoenv.2007.04.013
Cui, Y.J., Y.G. Zhu, R.H. Zhai, D.Y. Chen, Y.Z. Huang, Y. Qiu and J.Z. Liang. 2004. Transfer of metals from soil to vegetables in an area near a smelter in Nanning, China. Environ. Int. 30(6): 785-791. https://doi.org/10.1016/j.envint.2004.01.003
Hussain, J., J. Shah, F.A. Khan, W. Hussain, I.U. Rehman, I. Khan and I.A. Nascimento. 2012. Physicochemical evaluation of sewage waste of Peshawar City, KPK, Pakistan. Middle-East J. Sci. Res. 11(6): 796-799.
Hussain, R., L. Ali, I. Hussain and S.A. Khattak. 2014. Source identification and assessment of physico-chemical parameters and heavy metals in drinking water of Islampur area, Swat, Pakistan. J. Himalayan Earth Sci. 47(1): 99-106.
Jamali, M.K., T.G. Kazi, M.B. Arain, H.I. Afridi, N. Jalbani, G.A. Kandhro, A.Q. Shah and J.A. Baig. 2009. Heavy metal accumulation in different varieties of wheat (Triticum aestivum L.) grown in soil amended with domestic sewage sludge. J. Hazardous Mater. 164(2): 1386-1391 https://doi.org/10.1016/j.jhazmat.2008.09.056
Khan, S., Q. Cao, Y. Zheng, Y. Huang and Y. Zhu. 2008. Health risks of heavy metals in contaminated soils and food crops irrigated with wastewater in Beijing, China. Environ. Pollut. 152(3): 686-692. https://doi.org/10.1016/j.envpol.2007.06.056
Khan, T., S. Muhammad, B. Khan and H. Khan. 2011. Investigating the levels of selected heavy metals in surface water of Shah Alam River (A tributary of River Kabul, Khyber Pakhtunkhwa). J. Himalaya Earth Sci. 44(2): 71-79.
Kumar, N., S. Kumar, K. Bauddh, N. Dwivedi, P. Shukla, D. Singh and S. Barman. 2014. Toxicity assessment and accumulation of metals in radish irrigated with battery manufacturing industry effluent. Int. J. Vegetable Sci. (just-accepted).
Kumar, A., I. Sharma, A. Sharma, S. Varshney and P. Verma. 2009. Heavy metals contamination of vegetable foodstuffs in Jaipur (India). Electron. J. Environ. Agric. Food Chem. 8(2): 96-101.
Lei, M., B.H. Liao, Q.R. Zeng, P.F. Qin, and S. Khan. 2008. Fraction distributions of lead, cadmium, copper, and zinc in metal‐contaminated soil before and after extraction with disodium ethylenediaminetetraacetic acid. Commun. Soil sci. Plant Anal. 39(13-14): 1963-1978. https://doi.org/10.1080/00103620802134776
Liu, W.H., J.Z. Zhao, Z.Y. Ouyang, L. Söderlund and G.H. Liu. 2005. Impacts of sewage irrigation on heavy metal distribution and contamination in Beijing, China. Environ. Int. 31(6): 805-812. https://doi.org/10.1016/j.envint.2005.05.042
Mapanda, F., E. Mangwayana, J. Nyamangara and K. Giller. 2005. The effect of long-term irrigation using wastewater on heavy metal contents of soils under vegetables in Harare, Zimbabwe. Agric. Ecosyst. Environ. 107(2): 151-165. https://doi.org/10.1016/j.agee.2004.11.005
Perveen, S., A. Samad, W. Nazif and S. Shah. 2012. Impact of sewage water on vegetables quality with respect to heavy metals in Peshawar, Pakistan. Pak. J. Bot. 44(6): 1923-1931.
Rattan, R., S. Datta, S. Chandra and N. Saharan. 2002. Heavy metals and environmental quality-Indian scenario. Fertil. News. 47(11): 21-40.
Randhawa, M., G. Ahmad, F. Anjum, A. Asghar and M. Sajid. 2014. Heavy metal contents and their daily intake in vegetables under peri-urban farming system of Multan, Pakistan. Pak. J. Agric. Sci. 51(4): 1025-1031.
Shakirullah, M., I. Ahmad, K. Mehmood, A. Khan, H. Rehman, S. Alam and A. Shah. 2005. Physicochemical study of drinking water from Dir districts. J. Chem. Soc. Pak. 27(4): 374.
Sharma, R.K., M. Agrawal and F. Marshall. 2007. Heavy metal contamination of soil and vegetables in suburban areas of Varanasi, India. Ecotoxicol. Environ. Safety. 66(2): 258-266. https://doi.org/10.1016/j.ecoenv.2005.11.007
USEPA (US Environment Protection Agency). 2002. Region 9, Preliminary Remediation Goals.
US-EPA, IRIS. 2006. United States, environmental protection agency, Integrated risk information system.
WHO. 1996. Trace elements in human nutrition and health. World Health Organization. Geneva.
WHO/FAO. 2007. Joint FAO/WHO Food Standard Programme Codex Alimentarious Commission 13th Session. Report of the thirty eight session of codex committee on food hygiene. Houston, United States of American, ALINORM 07/30/13.
Zhuang, P., B. Zou, N. Li and Z. Li. 2009. Heavy metal contamination in soils and food crops around Dabaoshan mine in Guangdong, China: implication for human health. Environ. Geochem. Health. 31(6): 707-715. https://doi.org/10.1007/s10653-009-9248-3
To share on other social networks, click on any share button. What are these?


