

Geostatistical Analysis of Spatio-Temporal Variability and Mapping Genus Bactrocera in Apricot Orchard in Northern Pakistan


Geostatistical Analysis of Spatio-Temporal Variability and Mapping Genus Bactrocera in Apricot Orchard in Northern Pakistan
Wasim Akram1, Azhar Hussain2*, Sartaj Ali2, Iqbal Hussain3 and Muhammad2
1Department of Plant Sciences, Karakoram International University, Gilgit, Gilgit-Baltistan, Pakistan
2Department of Agriculture and Food Technology, Karakoram International University, Gilgit, Gilgit-Baltistan, Pakistan
3Directorate of Agriculture Gilgit, Gilgit-Baltistan, Pakistan
ABSTRACT
Apricots are the most important cash fruit in the region, and they play a key role in its socio-economic development. It is, however, susceptible to several diseases and pests, resulting in decreased yields and substantial financial losses. One of them is the genus Bactrocera, which has almost no data on its Spatio-temporal variability. Between July and September 2021 in district Hunza, Gilgit-Baltistan, Pakistan, this study aimed to determine the spatiotemporal variability of two species of fruit fly, Bactrocera zonata and Bactrocera dorsalis, in apricot fruit orchards. Results revealed that there was a significant difference between the species and month to month. B. zonata had a substantially larger population than B. dorsalis. To predict the spatial variability of fruit fly species, geostatistical analytic techniques were used. Using an inverse distance weight with a spherical semivariogram model, the spatial distribution maps were created. Both species had nugget/sill ratios of 0.00, 0.69, 0.61, and 0.73, indicating moderate to strong spatial dependence. The semivariogram graph also displayed moderate to high spatial dependence. The east-west and south-north trend lines of both fruit fly species crossed through the projected area of the sample point, indicating the overall variation trend of B. zonata and B. dorsalis. Interpolated distribution maps were also created to represent the spatial distribution of B. zonata and B. dorsalis in the study using different colors. This data, together with meteorological data (temperature, precipitation, and relative humidity), seems to promote a high population of fruit fly species in July and August. This knowledge will help with the development of integrated pest management strategies for fruit fly species and the reduction of insecticide use, which will benefit both growers and the environment.
Article Information
Received 25 November 2021
Revised 18 December 2021
Accepted 25 January 2022
Available online 22 April 2022
(early access)
Published 30 December 2022
Authors’ Contribution
AH and SA designed the study. AH performed geostatistical analysis. WA and Muhammad did field research activities. SA managed descriptive statistics. IH identify the species of fruit fly and analysed its population dynamics.
Key words
Fruit fly, Bactrocera zonata, Bactrocera dorsalis, Spatialvariability GIS, Meteorological data, Gilgit-Baltistan
DOI: https://dx.doi.org/10.17582/journal.pjz/20211125101104
* Corresponding author: azhar.hussain@kiu.edu.pk, wasimhortikiu@gmail.com
0030-9923/2023/0002-765 $ 9.00/0
Copyright 2023 by the authors. Licensee Zoological Society of Pakistan.
This article is an open access article distributed under the terms and conditions of the Creative Commons Attribution (CC BY) license (https://creativecommons.org/licenses/by/4.0/).
INTRODUCTION
Fruits are among the world’s most significant crops, both nutritionally and economically, as well as for local consumption and export. The most common fruit of Gilgit-Baltistan is the apricot (Prunus armeniaca L), which is grown in all ten districts (Akhtar and Khan, 2014). It accounts for a large portion of agricultural income and consequently plays an important part in the region’s socio-economic growth. In mountain areas, a considerable number of small and medium-sized farmers rely on apricot, which is well adapted to the edaphoclimatic conditions. However, apricots are susceptible to pest infestations, which reduce productivity and result in large financial losses. The apricot fruit fly is one of the most destructive insects in the world, particularly in Gilgit-Baltistan (Akbar et al., 2020; Akhtar and Khan, 2014). It has around 500 genera and 4000 species that are found in temperate, subtropical, and tropical climates around the world (Darwish et al., 2015). In the Indo-Pak subcontinent, fruit flies (Diptera: Tephritidae) cause substantial damage to fruits and crops (Rauf et al., 2013). Bactrocera zonata, the peach fruit fly, is one of the most dangerous Tephritidae species and one of the most devastating pests of more than 50 economically significant fruits. It is one of the three most damaging fruit flies, inflicting 25 to 100 percent crop losses on peach, apricot, guava, and fig trees (Reddy et al., 2013). Species of fruit fly Bactrocera dorsalis is a very invasive species that pose a significant quarantine risk to most countries across the world (CABI, 2019). Trade and travel are widely spread, and many locations around the world are vulnerable to invasion and establishment (Stephens et al., 2007; De Villiers et al., 2016). The species is a serious pest on a wide range of fruits and vegetables, having been found in over 250 different types of crops (David and Ramani, 2011; CABI, 2019), with damage levels reaching up to 100% of unprotected fruits such as apple, apricot, nectarine, pear, peach, and quince fruits (David and Ramani, 2011; CABI, 2019; USDA, 2016). In comparison to the traditional approach, spatial variation in pest populations is becoming increasingly important in the modern evolution of integrated pest management (IPM) concepts. The variability at the single field level is examined in site-specific IPM with the goal of optimizing chemical treatments (Park et al., 2007). The necessity of managing the entire pest population at a landscape or regional level is emphasized in area-wide IPM, such as by finding insect habitats inside and outside crops (Vreysen et al., 2007). In practice, however, the inclusion of spatial variability using geographical information system is relatively rare. Geostatistics is a valuable set of statistical methods for investigating pest spatial distribution and facilitating practical pest control applications in these scenarios. Keeping in view the above information and the infestation of fruit flies on various temperate fruits, such as apple, pear, apricot, peach, and nectarine, as well as reviewing the available literature on fruit fly damage on horticulture crops from Gilgit-Baltistan, we have been unable to pinpoint any comprehensive and well-informed articles on apricot fruit infestation. Based on field investigation and sampling analysis, we employed geostatistical methods to investigate the spatial distribution of fruit fly species in monthly wise population dynamics.
MATERIALS AND METHODS
Research area
The research was carried out at the apricot orchard in the District Hunza, Gilgit-Baltistan (latitude 36° 16’ 0” N, longitude 74° 40’ 59”E, and an altitude of 2,438 m above sea level) in the Northern Part of Pakistan from July 2021 to September 2021. The experimental district was divided into five valleys (Fig. 1). For trap placement, each valley was separated into three sections: Initial (starting point of the valley), mid (middle point of the valley), and final (last point of the valley), with all trap locations, provided GPS coordinates.
Design and installation of traps for fruit flies
The fruit fly trap was constructed from transparent plastic bottles of approximately 1-liter capacity. Two holes were cut, one in the lid and the other exactly the opposite to facilitate the entry of fruit flies. The holes were fitted with a PVC pipe of about 1/2 inch diameter with a length of 3 inches (Fig. 1). The trapping material strawboard was cut into 5 × 5 cm squares and soaked in a mixture of fruit fly trapping fluid (methyl eugenol as an attractant and pesticide as an insecticide) for 72 h. The strawboard was placed or suspended exactly in the center. Fifteen traps were installed and randomly distributed among targeted areas of each valley (initial, mid, and final) of apricot orchards. Data was recorded at the last week of each month and refilled with a respective solution. Data collected in the field on total population, daily population, and monthly population are used for geostatistical analysis and GIS mapping.
Geostatistical analysis and apatio-temporal variability mapping
A database of districts comprised of X and Y coordinate in the study valleys was created. After that shapefile of the District was open in GIS software (Arch 10.4). In the projects, three fields X, Y, and Z was opened. In X-field, X-coordinate, Y-field, Y-coordinate was selected whereas in Z field disease data was placed. Arc view spatial analyst “Interpolate grid option” was selected. On th output “grid specification dialogue”, the output grid extends chosen was the same as the District Hunza boundary and the interpolation method employed was inverse distance weight (IDW) (Hussain et al., 2021).

Where Z(x0) is the interpolated value, n representing the total number of sample data values, xi is the ith data value, hij is the separation distance between interpolated value and the sample data value, and β denotes the weighting power. The spatial distribution of fruit fly species can be characterized by a semivariogram function and the calculation of its function can be expressed based on the following equation.
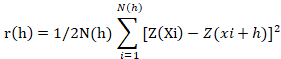
Where r(h) is the semi variogram function, h is the spatial distance of the sample points, called the step size, N(h) is the number of samples with the separation distance h, Z(xi) and Z (xi +h) are the measured value of the regionalized variable Z(xi) at the spatial positions xi and xi + h, respectively. If h is the abscissa, the function graph drawn with r(h) as the ordinate is called the semi variogram function graph. The fitting of the r(h) coordinate value can be used to obtain the corresponding theoretical model and the model parameters. The characteristics of spatial variability can be obtained by analyzing the model parameters. The aspherical model was used in this study and models is as (Olea, 2003; Webster and Oliver, 2007). 0, h=0
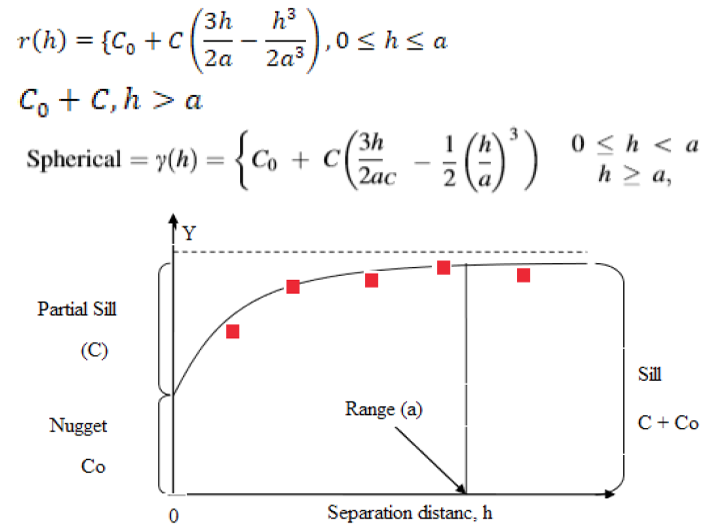
Spatial dependence (SDP %) will be calculated as described by (Biondi et al., 1994), is given by the expression:

For the spherical semivariogram: SDP Spherical (%); ≤2 5% strong spatial dependence; 25% < SPD (%) ≤ 75% moderate spatial dependence and ≥75% weak spatial dependence. The spatial analyst function of Arc GIS software was used to prepare maps as described by (Hussain et al., 2016).
RESULTS
In the apricot orchard from July to September 2021, two fruit fly species, B. zonata and B. dorsalis, were observed. The findings demonstrated that there were population fluctuations in the studied region on a monthly and daily basis. August was the month with the highest population of both fruit fly species, followed by September. Compared to B. dorsalis, B. zonata has a much higher population (Fig. 2).
Geostatistical analysis
Geostatistical analysis differential spatial dependence level of the two fruit fly species measured total population and per day. The main characteristics for the semivariogram model and geospatial parameters are given in Table I. The semivariogram parameters of the spherical model applied to the population dynamic of fruit fly species. The spatial dependence ranged from strong to moderate dependency. In particular, the total population of B. zonata had an N/S ratio of 0.00%, inferring strong spatial dependence. This means that 100 % variation can be explained by spatial variations. The total population of B. dorasalis, per day population of B. zonata and B. dorsalis had an N/S ratio of 69.14. 61.86 and 73.30 % inferring moderate spatial dependence.
Table I. Geostatistical parameters for population dynamics of genus Bactrocera species in District Hunza.
|
Variables |
Model |
N (Co) |
PS (C) |
S (Co+C) |
N/S ratio |
SDI % |
Class |
RMS |
RMSS |
|
B. zonata (T.P) |
Spherical |
0.00 |
0.854 |
0.854 |
0.00 |
0.00 |
S |
0.077 |
0.467 |
|
B. dorsalis (T.P) |
Spherical |
0.715 |
0.319 |
1.034 |
0.691 |
69.14 |
M |
1.06 |
0.990 |
|
B. zonata /day |
Spherical |
0.717 |
0.442 |
1.159 |
0.618 |
61.86 |
M |
0.348 |
0.933 |
|
B. dorsalis /day |
Spherical |
0.692 |
0.252 |
0.944 |
0.733 |
73.30 |
M |
0.182 |
1.00 |
*Strong, % Nugget <25%; Moderate, %Nugget 25–75%; Weak or Random, % Nugget >75%
This means that 69.14, 61.86, and 73.30 % of the total variation in B. dorsalis, per day population of both fruits fly species can be explained by spatial variations while the remaining 30.86, 38.14 and 26.70 % were attributable to unexplained sources of variations. The semivariogram graph also displayed strong to moderate spatial dependence. Making a 3D distribution map of population dynamics of fruit fly species and geographic location using the geostatistical module of ArcGIS 10.4 enables an intuitive understanding of the large-scale spatial distribution trend of each species. The line of best fit was drawn through the projection point, which was then projected onto the orthogonal planes from east to west and south to north. The X-axis represents east, the Y-axis represents true north, and the Z-axis represents the size of the observed value for each sample. The green curve represents the change in the east-west effect and the blue curve the change in the north-south effect. If the simulation exists in a certain direction and the straight line is a straight line, there is no overall trend. The total population of B. zonata points from lowest to highest, then low, and daily from highest to lowest, then high (Fig. 3a-b) shows a similar pattern that is also observed in B. dorsalis (Fig. 3e-f).
GIS mapping of the fruit fly species population
The spatial distribution map of the population dynamic of fruit fly species B. zonata and B. dorsalis (total population, per day population and monthly wise per trap population) is represented in Figures 4-6. The total population and per day population ranged from 43.22 to 111.87 and 0.01 to 1.85 while B. dorsalis had in the range of 31.03 to 97.04 and 0.51 to 1.62. The shade of coluors in the GIS map indicates the population dynamics of respective fruit fly species (Fig. 4). The monthly wise per trap population of B. zonata was in the ranged 5.01-34.97 in July, 10.03-44.93 in august and 9.01 to 34.67 was recorded. The histogram of July, August and September is unimodal with no outliers (Fig. 5A). Per trap population B. dorsalis in ranged from 7.02-29.97, 5.01 to 39.99 and 5.00 to 32.95 in July, August and September. Histogram of per trap population of July indicating bimodal with mean and Std. Dev. 17.53±5.54. The rest of the month histogram represents unimodal (Fig. 5B). The highest population mean of B. zonata and B. dorsalis species was recorded in August. Average monthly temperatures for the region were 18° C, 20° C, and 18.6° C in July, August, and September, with average humidity levels of 51%, 53%, and 57%, respectively. While the average precipitation during the months was 16 mm, 20 mm, and 12 mm, it is shown in (Fig. 6).
DISCUSSION
Knowledge about the geo-spatial distribution of pest status and mapping their spatial distribution plays a crucial role in sustainable management of pests in a particular area understanding the population status of pests and developing spatio-temporal distribution maps are needed to form a comprehensive pest control plan. The fruit fly is one of the most devastating pests of commercial fruit in Pakistan, primarily in Gilgit-Baltistan. A geostatistical investigation of the population dynamics of two species of fruit flies (B. zonata and B. dorsalis) was conducted in the North part of Pakistan in District Hunza. Spatial heterogeneity is a significant source of variability in agricultural systems that should be investigated. In the evolution of integrated pest management, the mechanisms and processes of control of the Spatio-temporal dynamics of insect populations have become increasingly relevant in comparison to traditional theory (IPM).
Geostatistics is a valuable tool for determining the spatial pattern of insect populations and assisting in pest control. Effective fruit fly management on apricots necessitates a better understanding of the seasonal dynamics of the species present. This ensures that the control methods focus on the most populated and/or most vulnerable harvest seasons to achieve effective control (Ekesi and Billah, 2009). According to the current study, the fruit fly population peaked in July and began to fall in August. This was in line with earlier studies (Win et al., 2014; Khan and Naveed, 2017). In an earlier investigation, the author claimed that the maximum population of Bactrocera species was recorded in August (Mahmood and Mishkatullah, 2007). The peak population of fruit flies, according to Abdel Galil et al. (2010), is caused by ripening month fruits. August is a ripening moth of apricot fruit in the research area, which explains the high population dynamics. The current findings are mostly consistent with the prior investigator’s conclusions (Amice and Sales, 1997). The impact of weather conditions on the population of the fruit fly has been documented, with rainfall being the most critical component (Khan et al., 2003). In July, August, and September, average temperatures in the research region were 18, 20, and 18.6° C, respectively, which are ideal for the development of larvae from eggs, which cause damage to both ripened and unripened fruits. Humidity levels averaged 51, 53, and 57%, respectively. Rainfall reached 16, 20, and 13 mm on average. Due to supportive environmental factors, the population of fruit fly species increased and caused more damages in the Hunza region from July to September; the same population increase trend with increasing temperature was reported by (Gogi et al., 2014; Danjuma et al., 2014; Mehmood and Mishkatullah, 2007). An insect’s spatial distribution is inherited, although it can be influenced by behaviour and other environmental factors (Nestel et al., 1995). Many field operations, including cultural pest control, fruit tree cleanliness, postharvest handling, and plant hygiene, can disrupt the life cycle of pests and lower their population. During field observations, we noticed poor canopy cleanliness, fruit falling to the ground, and irregular irrigation, all of which are triggering factors for fruit fly and provide food and space for them. Similar research was conducted by (Reddy et al., 2020). The irrigation pattern, methodology, and time interval have a greater impact on fruit fly infection (Yokoyama and Miller, 2007). Today, the use of GIS technology in monitoring pest population appears to be very promising, as it involves the use of decision support systems, taking into account pest and beneficial species colonization and dispersal, and evaluating the presence of environmental factors that, as they change across the managed area, could affect the success of an IPM program (Faust, 2008). This is the first and ever study that shows the spatial distributions of B. zonata and B. dorsalis in apricot orchard. This information can be used for spot applications or site-specific management of fruit fly species.
CONCLUSION
According to recent studies, the population of Bactrocera zonata and Bactrocera dorsalis in different valleys in the Hunza district begins to build up in the first week of July and peaks in August. The high population dynamics of respective species is more supported by weather data. For developing distributional maps, several GIS software packages now include spatial analytic capabilities, such as geostatistics. Because of the extensive usage of GIS-based studies, geostatistical methods are likely to become more widely used in practical contexts and at various scales, making it easier to build effective local and regional pest management programs.
ACKNOWLEDGMENTS
This research work was financially supported by Higher Education Commission Pakistan under National Research Grant for Universities (NRPU) Grant No: 20-11429/NRPU/RGM/RandD/HEC/2020. The authors would like to pay a vote of thanks to the Faculty of Life Sciences Department of Agriculture and Food Technology Karakoram International University for their permission of using their facilities during research.
Statement of conflict of interest
The authors have declared no conflict of interest.
REFERENCES
Abdel-Galil, F.A., Amro, M.A., Abdel-Moniem A.S.H. and El-Fandary O.O., 2010. Population fluctuations and interspecific competition between Tephritid flies attacking fruit crops in the New Valley oases, Egypt. Arch. Phytopathol. Pl. Protect., 43: 647659. https://doi.org/10.1080/03235400802021272
Akbar, S.A., Nabi, S.U., Mansoor, S., and Khan, K.A., 2020. Morpho-molecular identification and a new host report of Bactrocera dorsalis (Hendel) from the Kashmir valley (India). Int. J. trop. Insect Sci., 40: 315-325. https://doi.org/10.1007/s42690-019-00083-w
Akhtar, J., and Khan, A.N., 2014. Gilgit-Baltistan, Agriculture Statistics, Survey Report. Agriculture Statistics cell, Department of Agriculture Gilgit-Baltistan.
Amice, R. and Sales, F., 1997. Seasonal abundance of fruit flies in New Caledonia. In: Management of fruit flies in the Pacific (eds. A.J. Allwood and R.A.I. Drew). ACIAR Proc., 76: 134–139.
Biondi, F., Myers, D.E., and Avery, C.C., 1994. Geostatistically modeling stem size and increment in an old-growth forest. Can. J. For. Res., 24: 1354-1368. https://doi.org/10.1139/x94-176
CABI, 2019. Bactrocera dorsalis. In: Invasive species compendium. UK- CAB International, Willingford Available: www.cabi.org/isc.
Danjuma, S., Thaochan, N., Permkam, S., and Satasook, C., 2014. Effect of temperature on the development and survival of immature stages of the carambola fruit fly, Bactrocera carambolae, and the Asian papaya fruit fly, Bactrocera papayae, reared on guava diet. J. Insect Sci., 14: 126. https://doi.org/10.1093/jis/14.1.126
Darwish, D.Y., Rizk, M.M.A., Abdel-Galil, F.A., and Temerak, S.A.H., 2015. Analysis of factors influencing population density of the peach fruit fly (PFF), Bactrocera zonata (Saunders) (Diptera: Tephritidae) in Assiut, Northern Upper Egypt. Arch. Phytopathol. Pl. Prot., 48: 62-72. https://doi.org/10.1080/03235408.2014.882121
David, K.J., and Ramani, S., 2011. An illustrated key to fruit flies (Diptera: Tephritidae) from peninsular India and Andaman and Nicobar Islands. Zootaxa, 3021: 1–31. https://doi.org/10.11646/zootaxa.3231.1.4
De Villiers, M., Hattingh, V., Kriticos, D.J., Brunel, S., Vayssières, J.F., Sinzogan, A., and De Meyer, M., 2016. The potential distribution of Bactrocera dorsalis: considering phenology and irrigation patterns. Bull. Entomol. Res., 106: 19-33. https://doi.org/10.1017/S0007485315000693
Ekesi, S., Billah, M.K., Nderitu, P.W., Lux, S.A., and Rwomushana, I., 2009. Evidence for competitive displacement of Ceratitis cosyra by the invasive fruit fly Bactrocera invadens (Diptera: Tephritidae) on mango and mechanisms contributing to the displacement. J. Econ. Entomol., 102: 981-991. https://doi.org/10.1603/029.102.0317
Faust, R.M., 2008. General introduction to areawide pest management. In: Areawide pest management (eds. O. Koul, G. Cuperus and N. Elliott). Theory and Implementation. CAB International, Wallingford. pp. 1–14. https://doi.org/10.1079/9781845933722.0001
Gogi, M.D., Arif, M.J., Arshad, M., Khan, M.A., Bashir, M.H., and Zia, K., 2014. Impact of sowing times plant-to-plant distances sowing methods and sanitation on infestation of melon fruit fly (Bactrocera cucurbitae) and yield components of bitter gourd (Momordica charantia). Int. J. Agric. Biol., 16: 521-528. https://doi.org/10.21162/PAKJAS/16.2057
Hussain, A., Awan, M.S., Ali, S., Khan, S.W., Morari, F., and Ali, S., 2016. Spatial variability of soil micronutrients (Cu, Fe, Zn and Mn) and population dynamic of mycoflora in potato fields of CKNP region Gilgit-Baltistan Pakistan. Pak. J. agric. Sci., 53: 541-550.
Hussain, A., Khan, S.W., Ali, S., Faiz, F., Hussain, M., Ali, A., and Qasim, S., 2021. Geostatistical analysis of tomato fruit rot and diversity of associated fungal species. J. Anim. Pl. Sci., 31: 29-38.
Khan, M.A., and Ashfaq, M., 2003. Role of abiotic factors in populations and infestation fluctuation of fruitflies in apple orchards of Murree district [Pakistan]. J. Agric. Res. Pak., 41: 249-253.
Mahmood, K., and Mishkatullah, 2007. Population dynamics of three species of genus Bactrocera (Diptera: Tephritidae: Dacinae) in BARI, Chakwal (Punjab). Pakistan J. Zool., 39: 123-126.
Nestel, D., Cohen, H., Saphir, N., Klein, M., and Mendel, Z., 1995. Spatial distribution of scale insects: Comparative study using Taylor’s power law. Environ. Ent., 24: 506–512. https://doi.org/10.1093/ee/24.3.506
Park, Y.L., Krell, R.K., and Carroll, M., 2007. Theory, technology, and practice of site-specific insect pest management. J. Asia Pac. Ent., 10: 89–101. https://doi.org/10.1016/S1226-8615(08)60337-4
Khan, R.A. and Naveed, M., 2017. Occurrence and seasonal abundance of fruit fly, Bactrocera zonata saunders (Diptera: Tephritidae) in relation to meteorological factors. Pakistan. J. Zool., 49: 999-1003. https://doi.org/10.17582/journal.pjz/2017.49.3.999.1003
Olea, R.A., 2003. Geostatistics for engineers and earth scientists. Norwell: Kluwer Academic Publishers.
Rauf, I., Ahmad, N., Masoom, S.M., Rashdi, S., Ismail, M. and Khan, M.H., 2013. Laboratory studies on ovipositional preference of the peach fruit fly Bactrocera zonata (Saunders) (Diptera: Tephiritidae) for different host fruits. Afr. J. Agric. Res., 8: 1300-1303. https://doi.org/10.5897/AJAR2013.6744
Reddy, K.V., Devi, Y.K., and Komala, G., 2020. Management strategies for fruit flies in fruit crops. A review.
Reddy, K., Sharma, K. and Singh, S., 2013. Attraction of peach fruit fly Bactrocera zonata (Saunders) adults to odour of symbiotic bacteria isolated from midgut. Pestic. Res. J., 25: 158-162.
Stephens, A.E.A., Kriticos, D.J., and Leriche, A., 2007. The current and future potential geographical distribution of the oriental fruit fly, Bactrocera dorsalis (Diptera: Tephritidae). Bull. Entomol. Res., 97: 369–378. https://doi.org/10.1017/S0007485307005044
USDA, 2016. Tropical plant pests research unit. 64 Nowelo Street, Hilo, HI 96720, http://www.ars.usda.gov/; http://www.ars.usda. gov/.
Vreysen, M.J.B., Robinson, A.S., Hendrichs, J., and Kenmore, P., 2007. Area-wide integrated pest management (AW-IPM): Principles, practice and prospects. Area-wide Contr. Insect Pests, pp. 3-33. https://doi.org/10.1007/978-1-4020-6059-5_1
Webster, R., and Oliver, M.A., 2007. Geostatistics for environmental scientists. John Wiley and Sons. https://doi.org/10.1002/9780470517277
Win, N.Z., Mi, K.M., Oo, T.T., Win, K.K., Park, J., and Park, J.K., 2014. Occurrence of fruit flies (Diptera: Tephritidae) in fruit orchards from Myanmar. Korean J. appl. Ent., 53: 323-329. https://doi.org/10.5656/KSAE.2014.06.0.011
Yokoyama, V.Y., and Miller, G.T., 2007. Olive fruit fly biology and cultural control practices in California. IOBC WPRS Bull., 30: 263.
To share on other social networks, click on any share button. What are these?


