Submit or Track your Manuscript LOG-IN

Genome Characterization of Probiotic Lactobacillus delbrueckii Subsp. bulgaricus Strain NDO2 Isolated from Traditional Yogurt using High Throughput Next Generation Sequencing

Genome Characterization of Probiotic Lactobacillus delbrueckii Subsp. bulgaricus Strain NDO2 Isolated from Traditional Yogurt using High Throughput Next Generation Sequencing

Mati Ullah1*, Muhammad Rizwan2, Ali Raza3, Xianlin Zhao4, Yanling Sun4, Sarah Gul5, Muhammad Ihtesham Waheed6, Muhammad Nadeem Khan7, Alvina Gul8, Sami Ullah Jan9* and Chao Huang4*

1Department of Microbiology, Faculty of Veterinary & Animal Sciences, The University of Agriculture, Dera Ismail Khan, Pakistan
2College of Animal Sciences and Technology, Anhui Agricultural University, Hefei, Anhui, China
3Hefei National Laboratory for Physical Sciences at Microscale, School of Life Sciences, University of Science and Technology of China, Hefei, Anhui, China
4Biotechnology Research Center, Shandong Academy of Agricultural Sciences, Jinan, China
5Department of Biological Sciences, Faculty of Basic and Applied Sciences, International Islamic University, Islamabad, Pakistan
6Department of Plant Breeding and Genetics, University of Agriculture, Peshawar
7Department of Microbiology, Faculty of Biological Sciences, Quaid-I-Azam University, Islamabad, Pakistan
8Atta-Ur-Rahman School of Applied Biosciences, National University of Sciences and Technology, H-12 Campus, Islamabad, Pakistan
9Department of Bioinformatics and Biosciences, Faculty of Health & Life Sciences, Capital University of Science and Technology, Islamabad, Pakistan
 
*      Corresponding author: samiullahjan@gmail.com, 67731020@qq.com; matiqau@gmail.com

Fig. 1.

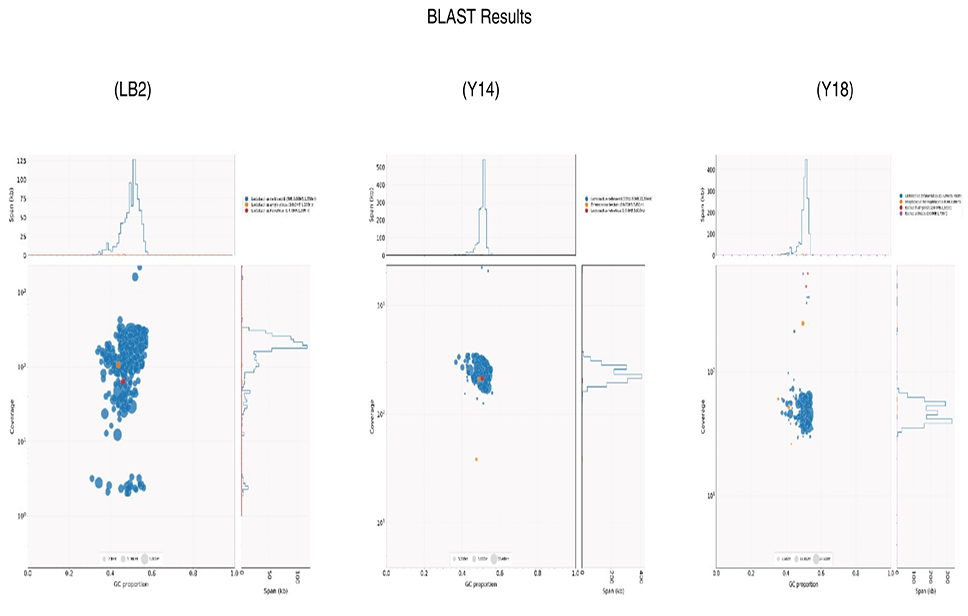
Blob plots indicate the results of BLAST matches of each of the three assembled genomes. The colors indicate BLAST matches to different species of bacteria. The proportion of GC contents in each assembled genome is also indicated.

Fig. 2.

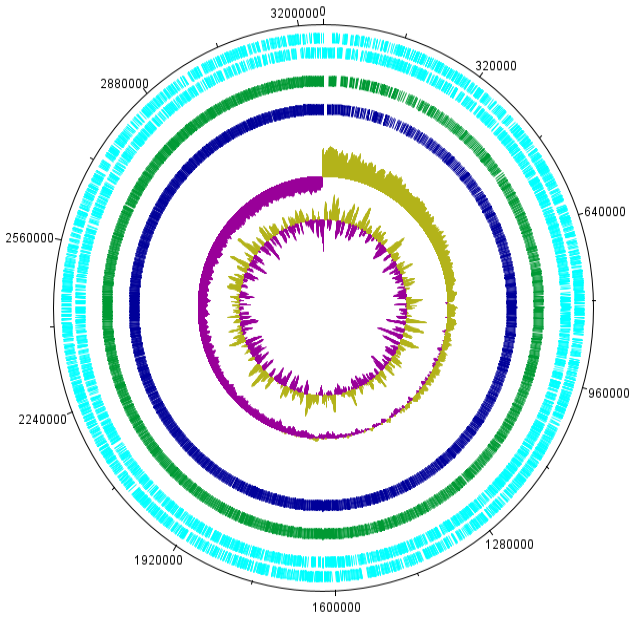
Circular plot of Lactobacillus delbrueckii subsp. Bulgaricus strain NDO2 genome generated by DNA plotter. Circles indicate, from inside outwards: GC skew; GC content; Y18 Comparison results; Y14 comparison result; CDS sequence are (reverse frame); CDS sequence area (plus frame).

Fig. 3.
Comparative genome analysis of the three L. delbrueckii subsp. Bulgaricus isolates. (A) Roary matrix. Pan-genome analysis of three L. delbrueckii subsp. Bulgaricus isolates annotated genomes. Roary produced the gene presence/absence matrix. A total of 2284 protein-coding gene sequence clusters produced by roary are shown in the figure. The presence of the gene is represented by grey color while the absence is shown by white color. The numbers represent clusters in each assembled annotated genome. (B) Diagram of conserved genes per number of genomes. (C) Diagram of new and unique genes per number of genomes.
Fig. 4.
The subsystem category distribution of the probiotic bacterial genome sequences according to the SEED database. The largest subsystem feature counts belong to carbohydrates, protein metabolism, DNA metabolism and nucleoside and nucleotide. The description of various subsystem features is represented in a different color below right.
Fig. 5.
Classification of the eggNOG annotation of the probiotic bacterial genome sequences using eggNOG. The numbers in the plot represent the genes assigned to eggNOG classification. The description of the various annotated eggNOG features is represented in various colors below right.
Fig. 6.

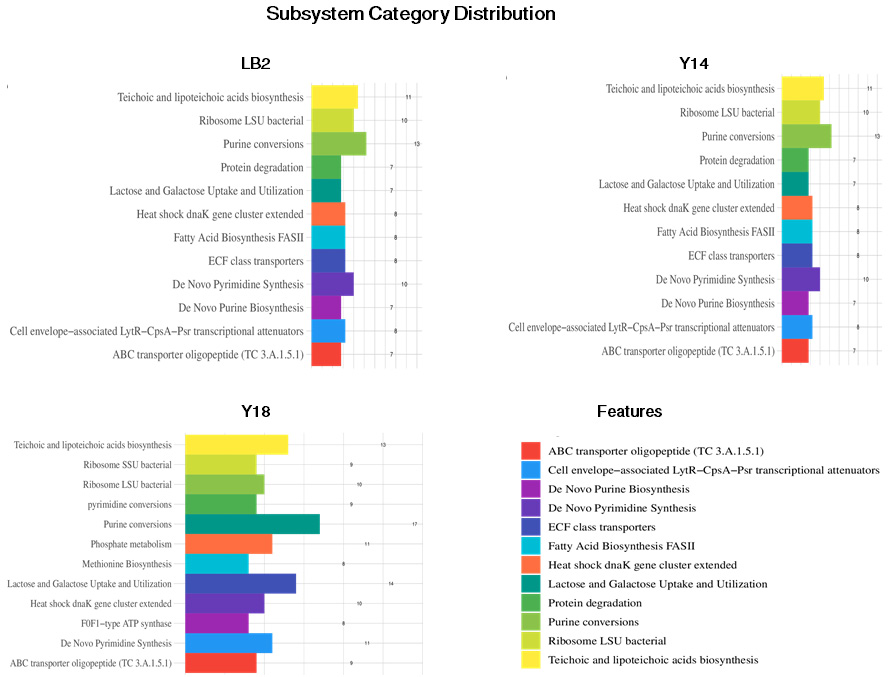
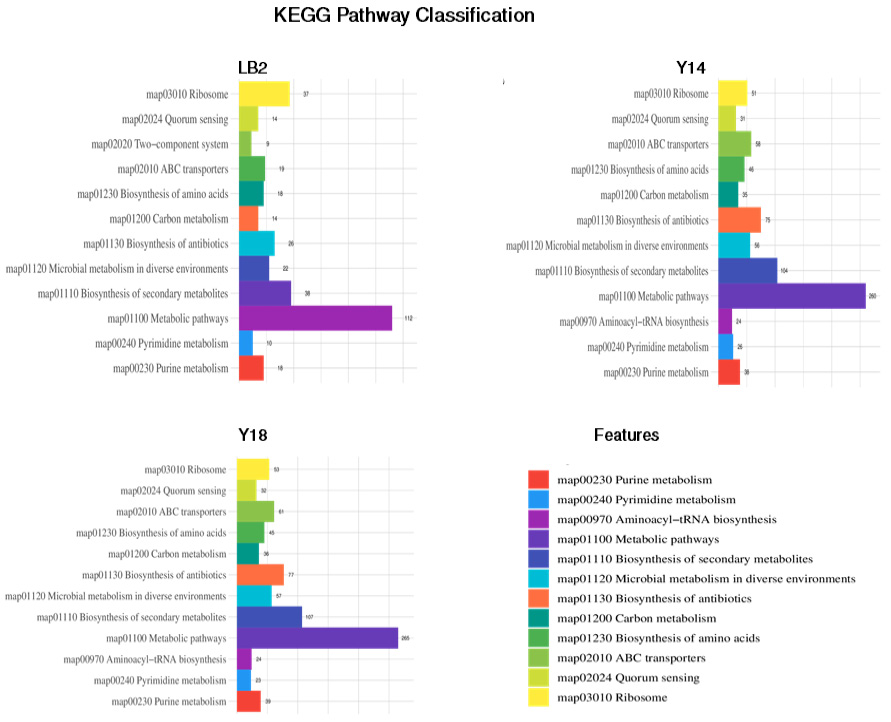
Classification of the KEGG pathways based on the assembled genome of the three probiotic bacterial isolates. The different colors represent the various KEGG pathways identified in the current analysis.

Pakistan Journal of Zoology

June

Pakistan J. Zool., Vol. 56, Iss. 3, pp. 1001-1500

Featuring

Click here for more

Subscribe Today

Receive free updates on new articles, opportunities and benefits


Subscribe Unsubscribe