


Research Article
GIS Applications in Surveying and Mapping of Rice Weeds in Guilan Province, Iran
Mohammad Javad Golmohammadi1, Hamid Reza Mohammaddoust Chamanabad1*, Bijan Yaghoubi2 and Mostafa Oveisi3
1Department of Agronomy and Plant Breeding, Faculty of Agriculture and Natural Resource University of Mohaghegh Ardabili; Ardabil, Iran; 2Rice Research Institute of Iran, Agricultural Research, Education and Extension Organization, Rasht, Iran; 3Department of Agronomy and Plant Breeding, Faculty of Agriculture University of Tehran; Karaj, Iran.
Abstract | Present study was carried out in rice farms of Guilan province for mapping and weed distribution using Geographic Information System (GIS) technologies for a period of three years (2014-2016). Echinochloa crussgalli was the more important species in 10 regions of Guilan province. The Langarud and Rudsar regions each with 47 species and Anzali and Shaft with 25 species (with 71.2 and 37.9 percent, respectively) had the highest and lowest species diversities, species diversity in 2015 was more than 2014 and 2016 years. The frequency of weed species in Guilan rice farms in 2014-2016 was 3.38, 3.87 and 4.82percent, respectively. Cyperus esculentus and P. distichum were the most abundant species with 9 and 8 plants/m2, respectively. Echinochloa crussgalli and C. difformis with a density of 5 plants/m2. Weeds were non-uniformly distributed in various families including Cyperaceae, Poaceae, Lythraceae, Polygonaceae, Asteraceae, and Salviniaceae that accounted for 36 species (54.5 percent). Accurate and specific weed maps are the key to achieving all the benefits of weed management. When in an area the distribution and consumption of inputs is based on accurate information from the weed composition of the farms in that area, the efficiency of these inputs is improved and weed damage is reduced.
Received | January 29, 2018; Accepted | September 4, 2020; Published | October 21, 2020
*Correspondence | Hamid Reza Mohammaddoust Chamanabad, Department of Agronomy and Plant Breeding, Faculty of Agriculture and Natural Resource University of Mohaghegh Ardabili; Ardabil, Iran; Email: [email protected]
Citation | Golmohammadi, M.J., H.R.M. Chamanabad, B. Yaghoubi and M. Oveisi. 2020. GIS applications in surveying and mapping of rice weeds in Guilan Province, Iran. Sarhad Journal of Agriculture, 36(4): 1103-1111.
DOI | http://dx.doi.org/10.17582/journal.sja/2020/36.4.1103.1111
Keywords | Accurate agriculture, Geographic information system, New systems, Rice farming
Introduction
The culture of man and rice has a historical and profound relationship. Rice has an inevitable role in providing food, economy, religion and civilization in many countries of the world (Jabran and Chauhan, 2015; Dass et al., 2016; Golmohammadi et al., 2018). More than half of the world’s rice is produced in Asia (Awan et al., 2015). In Iran also rice is the main staple food in most parts of the country. There are almost 600,000 hectares of rice plantation in Iran with a total production of 2.5 milion tons (FAO, 2016). More than 75percent of the rice crop is grown in the Provinces of Mazandaran and Guilan, north of Iran. Weeds are considered an important challenge to rice production (Tshewang et al., 2016; Yaghoubi et al., 2010). The mean reduction in rice yield caused by weeds competition is 40-60percent, which may reach 94-96percent if weeds are not properly controlled (Chauhan and Johnson, 2011). Rice yield reduction resulting from weed competition may vary depending on rice planting methods, type of weed, degree of importance of the weed, agricultural operations, and weather conditions (Jabran and Chauhan, 2015).
Determining the distribution pattern of weeds and their density at each point is very important. Therefore, before any action, we need to draw up maps of the weed distribution pattern and their density. The preparation of these maps is done using GPS and GIS technology. The ability to use GPS as an effective tool for estimating weed infested areas and the evaluation of different weed control methods has been proven (Nelson et al., 1999; Wilson et al., 1993). The GIS system is a complex system that provides organized information to a specific location. The GIS is a geographic coordinate system that determines the accuracy of GPS information, dominance map, frequency, distribution, diversity of weed species, or paths that have invasive species (Nkoa et al., 2015). GIS maps are digital and effective on each other with information. The GIS system can complete the data collected from a place of information layers, and on the other hand, researchers use the information obtained to further explore them. GIS technology can be used to make maps that theoretically predict the time of weed emergence from weather data (Main et al., 2004). The distribution, density and frequency of rice weeds from 8 documentary areas were determined through the GIS system. GIS has been applied in agriculture for ahe spatial analysis of weeds (Nelson et al., 1999).
Using the GIS system and collecting accurate information, can be used to compare species distribution and location change from year to year and to summarize infestations by area (Korejo et al., 2010). The most popular research techniques used by weed scientists are the use of the GIS system. Most studies of weed science are through the use of GIS with the geographic location of particular weed species and their populations. GIS is used to analyze the issues of what weed species are in the region, and what is the relationship between distribution and dominance with climate, environment and management factors. Tools like ArcGIS can help geographically spread weed science, cluster patterns, and geographic ratio analysis. The use of GIS in analytical ratios, such as the presence and absence of weed, distribution, dominance, abundance, aquatic and non-aquatic conditions, is finally used to better understand (Nkoa et al., 2015; Shanwad et al., 2002). Using GPS and GIS, we can identify contaminated weed maps and accurately manage farm information accurately. Spatial information is provided by GPS receivers for land border mapping, roads, irrigation systems, and problematic areas such as weed or disease susceptibility. The GPS system helps farmers navigate soil samples or crop conditions year after year to accurately navigate in special farms on farms (Yousefi and Razdari, 2015). Given the presence of weeds in a region, it is possible to decide on their control methods and plan; otherwise, the application of different control methods will not have the desired effects, and on the other hand, inadvertently contaminated in the chemical control of the environment, and even a number of weeds Weeds will also be resistant to herbicides. Therefore, regular weed monitoring will improve the status of the existing GIS technology.
Materials and Methods
In Iran, rice is the main staple in most parts of the country, and more than 75 percent of the rice crop is grown in the Provinces of Mazandaran and Guilan, north of Iran (Ministry of Agricalture Jihad, 2019). During the springs and summers of 2014, 2015 and 2016, when the current study was being done, temperature ranged from 16 to 29.4 °C, monthly average rainfall recorded 213 to 853 mm, average sunshine hours 3320, and relative humidity averaged 45-87percent. The study area is Guilan province of Iran, which situated in the north of Iran (Figure 1). Same is here located 36°34’ to 38°27’ latitude and 48°53’ to 50°34’ longitudes (Table 1). Guilan province is divided into 16 counties including Astara, Astaneh-ye Ashrafiyeh, Anzali, Amlash, Talesh, Rasht, Rudsar, Rudbar, Rezvanshahr, Siahkal, Shaft, Foman, Sowme’eh Sara, Lahijan, Langarud and Masal (Figure 1).
Guilan province is the wettest province in Iran and also the wettest region of the southern shores of the Caspian Sea. The average annual rainfall is 1300 mm, the average annual temperature and humidity are 16 °C and 80 percent, respectively (Guilan Meteorological Organization, 1398). Rainfall, rivers, temperature and evaporation of Guilan province are shown in Figure 2. The total cultivated area is about 220,000 hectares of cultivated land, accounting for 33percent of the land area of the country (Ministry of Agriculture Jihad, 2019). Sampling operation was performed by a quadrat of 0.25 m2 (0.5× 0.5 m). Accordingly, the higher the area under cultivation of the mentioned crop in the regions, the higher the number of samples will be. In order to obtain complete flora from farm weeds, separate quadrates were used, depending on the new species observed. In each city, according to the area under rice cultivation (in farms with an area of up to 2 hectares, 7 quadrats, farms of 2-5 hectares, 9 quadrats and more than 5 hectares, 13 quadrats) from 10 days after transplanting to the end of the rice clustering stage. Farms were randomly selected and sampled. In the evaluated farms, geographical coordinates (latitude and longitude and altitude) were recorded by Garmin GPSMap 62s. These coordinates were used to prepare and produce weed distribution maps in Guilan province by GIS system. A total of 481 farms in Guilan province were visited during the rice growing period. Weeds in each box were identified and counted separately by genus and species. The frequency and density of weeds in each farm and each city were calculated using the following equations (Thomas, 1985).
Table 1: Latitude and longitude in regions of Gilan province.
|
Longitude |
Latitude |
|||||||
|
Min |
Max |
Min |
Max |
|||||
|
minutes |
degrees |
minutes |
degrees |
minutes |
degrees |
minutes |
degrees |
|
|
34 |
48 |
53 |
48 |
15 |
38 |
27 |
38 |
Astara |
|
46 |
49 |
11 |
50 |
11 |
37 |
28 |
37 |
Astaneh-e Ashrafiyeh |
|
0 |
50 |
17 |
50 |
48 |
36 |
8 |
37 |
Amlash |
|
11 |
49 |
41 |
49 |
23 |
37 |
34 |
37 |
Anzali |
|
32 |
48 |
3 |
49 |
33 |
37 |
16 |
38 |
Talesh |
|
27 |
49 |
55 |
49 |
1 |
37 |
27 |
37 |
Rasht |
|
40 |
48 |
13 |
49 |
25 |
37 |
40 |
37 |
Rezvanshahr |
|
11 |
49 |
5 |
50 |
33 |
36 |
7 |
37 |
Rudbar |
|
6 |
50 |
37 |
50 |
38 |
36 |
12 |
37 |
Rudsar |
|
43 |
49 |
9 |
50 |
41 |
36 |
11 |
37 |
Siahkal |
|
10 |
49 |
32 |
49 |
57 |
36 |
18 |
37 |
Shaft |
|
3 |
49 |
31 |
49 |
15 |
37 |
30 |
37 |
Sowmee sara |
|
52 |
48 |
27 |
49 |
1 |
37 |
17 |
37 |
Fouman |
|
45 |
49 |
13 |
50 |
5 |
37 |
23 |
37 |
Lahijan |
|
55 |
49 |
16 |
50 |
56 |
36 |
19 |
37 |
Langarud |
|
43 |
48 |
11 |
49 |
15 |
37 |
29 |
37 |
Masal |
Frequency is concerned with the presence or absence of a species in a quadrat, a farm, or a region, and does not refer to the number or quantity of the species.
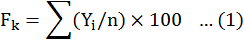
In above equation, Fk represents the frequency of the species, Yi the presence or absence of the species, and “n” the number of visited farms (1).
Density refers to the counted individuals of each species m2 in the farm of interest:
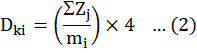
Dki stands for the density of species k in farm i and Zj the number of plants in quadrat j (2). The coordinates of each farm, such as latitude, latitude and elevation, were recorded by the Garmin 62CX GPS device. After registering the point with the GPS device, it was converted to KMZ format, then these files became GIS file format for mapping. Then all information was created in the form of a database. The information in ArcMap software was processed from the ArcView GIS 3.1 suite of software, based on latitude and longitude.
Results and Discussion
Sixty- six weed species were found in the area, belonging to 43 genera and 29 families. The families with the highest number of species found were Cyperaceae, Poaceae and Lythraceae. Thirty- four of the identified species were annual grasses and 22 perennial species. Weeds have non-uniformly distributed in various families including Cyperaceae, Poaceae, Lythraceae, Polygonaceae, Asteraceae, and Salviniaceae that accounted for 36 species (54.5 percent). Among the grass weeds, E. crussgalli with 89.8 percent was the most common and most frequently species. P. distichum and E. oryzoides had frequencys of higher than 50 percent.
The most important weeds with high relative frequency value in rice farms were E. crussgalli (31.18), P. distichum (29.28), C. esculentus (25.56), E. prostrate (13.7), E. oryzoides (13.28), and, C. difformis (13.25). The dominant species in terms of frequency and density (m2) in 10 counties (62.5 percent of the
Table 2: Important weed species of field rice showing density and frequency% in Guilan province, Iran. (Astara, Astaneh-e-Ashrafiyeh, Amlash, Anzali, Talesh, Rasht, Rezvanshahr, Rudbar, Rudsar, Siahkal, Shaft, Sowmeesara,Fouman, Lahijan, Langarud and Masal).
|
Frequency |
Density (m2) |
Weeds |
Area (ha) |
Site |
Item |
|
3.326 |
0.138 |
Echinochloa crussgalli |
3200 |
Astara |
1 |
|
3.326 |
0.285 |
Paspalum distichum |
|||
|
2.495 |
37.000 |
Azolla filiculoides |
|||
|
2.287 |
0.157 |
Eclipta prostrata |
|||
|
2.079 |
0.093 |
Cyperus difformis |
|||
|
2.079 |
0.020 |
Echinochloa oryziodes |
|||
|
7.277 |
1.003 |
Echinochloa crussgalli |
23570 |
Astaneh-e Ashrafiyeh |
2 |
|
6.861 |
0.745 |
Paspalum distichum |
|||
|
5.198 |
0.613 |
Cyperus difformis |
|||
|
3.950 |
0.048 |
Echinochloa oryziodes |
|||
|
2.703 |
0.051 |
Eclipta prostrata |
|||
|
2.287 |
18.500 |
Algue blue-green |
|||
|
6.445 |
0.306 |
Echinochloa crussgalli |
3500 |
Amlash |
3 |
|
5.198 |
0.507 |
Paspalum distichum |
|||
|
4.574 |
0.167 |
Eclipta prostrata |
|||
|
4.366 |
0.054 |
Echinochloa oryziodes |
|||
|
3.950 |
0.936 |
Cyperus difformis |
|||
|
3.534 |
0.712 |
Monochoria vaginalis |
|||
|
2.287 |
0.332 |
Echinochloa crussgalli |
4820 |
Anzali |
4 |
|
1.871 |
0.125 |
Cyperus difformis |
|||
|
1.871 |
0.470 |
Paspalum distichum |
|||
|
1.455 |
0.011 |
Echinochloa oryziodes |
|||
|
1.247 |
0.182 |
Eclipta prostrata |
|||
|
1.040 |
0.021 |
Cyperus esculentus |
|||
|
4.990 |
0.480 |
Paspalum distichum |
15987 |
Talesh |
5 |
|
3.742 |
0.134 |
Echinochloa crussgalli |
|||
|
3.326 |
0.154 |
Alisma plantago-aquatica |
|||
|
2.911 |
24.000 |
Azolla filiculoides |
|||
|
2.703 |
0.141 |
Cyperus difformis |
|||
|
2.703 |
0.071 |
Cyperus serotinus |
|||
|
10.395 |
1.090 |
Echinochloa crussgalli |
62338 |
Rasht |
6 |
|
10.395 |
1.399 |
Paspalum distichum |
|||
|
7.900 |
0.132 |
Echinochloa oryziodes |
|||
|
7.484 |
1.423 |
Cyperus difformis |
|||
|
4.990 |
0.140 |
Cyperus serotinus |
|||
|
3.950 |
0.379 |
Cyperus esculentus |
|||
|
2.495 |
0.085 |
Alisma plantago-aquatica |
10000 |
Rezvanshahr |
7 |
|
2.287 |
0.085 |
Echinochloa crussgalli |
|||
|
2.287 |
0.207 |
Paspalum distichum |
|||
|
1.663 |
0.107 |
Cyperus difformis |
|||
|
1.663 |
0.047 |
Cyperus serotinus |
|||
|
1.455 |
16.600 |
Azolla filiculoides |
|||
|
5.198 |
1.332 |
Scirpus maritimus |
3375 |
Rudbar |
8 |
|
4.990 |
0.281 |
Echinochloa crussgalli |
|||
|
3.742 |
0.265 |
Paspalum distichum |
|||
|
3.326 |
0.352 |
Potamogeton nodosus |
|||
|
2.079 |
26.000 |
Najas marina |
|||
|
1.663 |
0.016 |
Echinochloa oryziodes |
|||
|
12.308 |
0.618 |
Echinochloa crussgalli |
10689 |
Rudsar |
9 |
|
9.813 |
1.101 |
Paspalum distichum |
|||
|
9.647 |
0.148 |
Echinochloa oryziodes |
|||
|
6.819 |
0.226 |
Eclipta prostrata |
|||
|
6.653 |
1.235 |
Cyperus esculentus |
|||
|
6.320 |
1.227 |
Cyperus difformis |
|||
|
5.613 |
0.641 |
Echinochloa crussgalli |
4433 |
Siahkal |
10 |
|
4.366 |
0.496 |
Paspalum distichum |
|||
|
3.742 |
0.645 |
Cyperus difformis |
|||
|
3.534 |
0.036 |
Eclipta prostrata |
|||
|
3.326 |
0.145 |
Echinochloa oryziodes |
|||
|
2.911 |
0.050 |
Cyperus esculentus |
|||
|
1.871 |
0.218 |
Paspalum distichum |
14330 |
Shaft |
11 |
|
1.247 |
0.147 |
Cyperus esculentus |
|||
|
1.247 |
0.046 |
Echinochloa crussgalli |
|||
|
1.247 |
0.179 |
Cyperus difformis |
|||
|
1.247 |
0.067 |
Eclipta prostrata |
|||
|
1.247 |
1.110 |
Azolla filiculoides |
|||
|
3.119 |
0.745 |
Cyperus difformis |
27972 |
Sowmee Sara |
12 |
|
3.119 |
0.164 |
Echinochloa crussgalli |
|||
|
2.703 |
0.137 |
Paspalum distichum |
|||
|
2.703 |
0.379 |
Eclipta prostrata |
|||
|
2.287 |
0.020 |
Echinochloa oryziodes |
|||
|
1.663 |
0.093 |
Cyperus serotinus |
|||
|
4.366 |
0.100 |
Echinochloa crussgalli |
13870 |
Fouman |
13 |
|
3.950 |
0.276 |
Paspalum distichum |
|||
|
2.703 |
0.322 |
Cyperus esculentus |
|||
|
2.703 |
0.111 |
Eclipta prostrata |
|||
|
2.287 |
0.258 |
Cyperus difformis |
|||
|
2.287 |
0.034 |
Echinochloa oryziodes |
|||
|
9.771 |
1.654 |
Echinochloa crussgalli |
23816 |
Lahijan |
14 |
|
7.692 |
0.094 |
Paspalum distichum |
|||
|
7.484 |
0.711 |
Cyperus difformis |
|||
|
6.237 |
0.138 |
Echinochloa oryziodes |
|||
|
6.029 |
1.360 |
Sagittaria trifolia |
|||
|
5.613 |
0.293 |
Eclipta prostrata |
|||
|
7.900 |
0.660 |
Echinochloa crussgalli |
9100 |
Langarud |
15 |
|
6.029 |
0.577 |
Paspalum distichum |
|||
|
5.198 |
0.066 |
Cyperus difformis |
|||
|
5.198 |
0.278 |
Eclipta prostrata |
|||
|
4.366 |
1.244 |
Echinochloa oryziodes |
|||
|
3.534 |
0.917 |
Monochoria vaginalis |
|||
|
2.079 |
0.165 |
Paspalum distichum |
7000 |
Masal |
16 |
|
1.663 |
0.053 |
Cyperus difformis |
|||
|
1.663 |
0.026 |
Cyperus serotinus |
|||
|
1.455 |
0.161 |
Echinochloa crussgalli |
|||
|
1.040 |
0.312 |
Alisma plantago-aquatica |
|||
|
1.040 |
0.021 |
Eclipta prostrata |
Table 3: Frequency of weeds Guilan province, Iran (2014-2016).
|
2016 |
2015 |
2014 |
Species name |
Family |
Item |
|
14.7 |
7.14 |
9.77 |
Sagittaria trifolia |
Alismataceae |
1 |
|
11.37 |
9.98 |
7.34 |
Alisma plantago-aquatica |
Alismataceae |
2 |
|
3.7 |
3.83 |
2.66 |
Alternanthera sessilis |
Amaranthaceae |
3 |
|
15.8 |
20.15 |
13.53 |
Eclipta prostrata |
Asteraceae |
4 |
|
6.33 |
4.39 |
4.65 |
Bidens tripartita |
Asteraceae |
5 |
|
4.45 |
3.66 |
2.48 |
Xanthium strumarium |
Asteraceae |
6 |
|
2.58 |
1.24 |
2.42 |
Butomus umbellatus |
Butomaceae |
7 |
|
0.26 |
0.16 |
0 |
Chara vulgaris |
Characeae |
8 |
|
3.89 |
2.63 |
3.88 |
Nasturtium officinale |
Cruciferae |
9 |
|
7.17 |
4.63 |
5.46 |
Algue blue-green |
Cyanophyceae |
10 |
|
24.19 |
17.12 |
15.23 |
Cyperus esculentus |
Cyperaceae |
11 |
|
22.53 |
7.01 |
5.19 |
Cyperus serotinus |
Cyperaceae |
12 |
|
13.44 |
7.78 |
10.38 |
Cyperus difformis |
Cyperaceae |
13 |
|
5.43 |
1.95 |
2.69 |
Scirpus maritimus |
Cyperaceae |
14 |
|
5.98 |
3.17 |
0 |
Cyperus fuscus |
Cyperaceae |
15 |
|
1.84 |
1.06 |
0.64 |
Cyperus rotundus |
Cyperaceae |
16 |
|
1.97 |
1.36 |
0 |
Cyperus longus |
Cyperaceae |
17 |
|
1.44 |
0.72 |
0.96 |
Scirpus mucronatus |
Cyperaceae |
18 |
|
1.49 |
1 |
0 |
Cyperus strigosus |
Cyperaceae |
19 |
|
0.95 |
0.51 |
0 |
Pycreus flavescense |
Cyperaceae |
20 |
|
0.64 |
0.4 |
0 |
Cyperus odoratus |
Cyperaceae |
21 |
|
0 |
0.33 |
0.5 |
Pycreus lanceolatus |
Cyperaceae |
22 |
|
0.31 |
0.31 |
0 |
Fimbristylis miliacea |
Cyperaceae |
23 |
|
0.21 |
0.21 |
0 |
Cyperus glomeratus |
Cyperaceae |
24 |
|
0.34 |
0.08 |
0 |
Cyperus iria |
Cyperaceae |
25 |
|
1.16 |
0.5 |
0 |
Bergia capensis |
Elatinaceae |
26 |
|
1.04 |
0.55 |
0.71 |
Equisetum palustre |
Equistmaceae |
27 |
|
0 |
0.21 |
0 |
Equisetum arvense |
Equistmaceae |
28 |
|
26.5 |
34.99 |
28.31 |
Echinochloa crussgalli |
Gramineae |
29 |
|
30.17 |
22.22 |
27.03 |
Paspalum distichum |
Gramineae |
30 |
|
19.15 |
23.9 |
17.24 |
Echinochloa oryziodes |
Gramineae |
31 |
|
2.41 |
4.23 |
0 |
Echinochloa colona |
Gramineae |
32 |
|
0 |
0.21 |
0 |
Eleocharis palustris |
Gramineae |
33 |
|
0 |
0.21 |
0 |
Coix lacrima-jobi |
Gramineae |
34 |
|
0 |
0.21 |
0 |
Digitaria sanguinalis |
Gramineae |
35 |
|
6.23 |
2.56 |
3.27 |
Najas marina |
Hydrocharitaceae |
36 |
|
1.29 |
0.52 |
0.89 |
Najas minor |
Hydrocharitaceae |
37 |
|
4.32 |
1.56 |
5.14 |
Schoenoplectus juncoides |
Juncaceae |
38 |
|
0 |
0.83 |
0 |
Mentha aquatica |
Labiatae |
39 |
|
10.39 |
9.68 |
8.19 |
Lemna minor |
Lemnaceae |
40 |
|
5.89 |
7.24 |
3.71 |
Ammannia multiflora |
Lythraceae |
41 |
|
4.25 |
6.35 |
0 |
Ammannia baccifera |
Lythraceae |
42 |
|
2.18 |
0.73 |
1.25 |
Rotala indica |
Lythraceae |
43 |
|
0 |
3.95 |
0 |
Ammannia senegalensis |
Lythraceae |
44 |
|
0 |
0.83 |
0 |
Ammannia gracilis |
Lythraceae |
45 |
|
2.94 |
1.11 |
2.19 |
Marsilea quadrifolia |
Marsileaceae |
46 |
|
4.29 |
2.87 |
1.26 |
Ludwigia epilobioides |
Onagraceae |
47 |
|
2.35 |
0.37 |
0.19 |
Ludwigia palustris |
Onagraceae |
48 |
|
3.7 |
6.49 |
5.19 |
Polygonum persicaria |
Polygonaceae |
49 |
|
2.45 |
1.55 |
2.45 |
Polygonum hydropiper |
Polygonaceae |
50 |
|
0 |
0.4 |
0.64 |
Polygonum hydropiperoides |
Polygonaceae |
51 |
|
0 |
0.21 |
0.21 |
Rumex crispus |
Polygonaceae |
52 |
|
9.68 |
3.94 |
5.71 |
Potamogeton nodosus |
Potamogetonaceae |
53 |
|
0 |
0.21 |
0 |
Potamogeton crispus |
Potamogetonaceae |
54 |
|
6.75 |
4.48 |
5.4 |
Monochoria vaginalis |
Potederiaceae |
55 |
|
0 |
0 |
0.21 |
Samolus valerandi |
Primulaceae |
56 |
|
0 |
1.2 |
1.92 |
Ranunculus aquatilis |
Rananculaceae |
57 |
|
1.87 |
0.62 |
0 |
Riccia glauca |
Ricciaceae |
58 |
|
0 |
0.21 |
0 |
Galium aparine |
Rubiaceae |
59 |
|
15.43 |
6.65 |
12.43 |
Azolla filiculoides |
Salviniaceae |
60 |
|
0.87 |
0.16 |
0.63 |
Azolla pinnatae |
Salviniaceae |
61 |
|
0.38 |
0.15 |
0.3 |
Salvinia natans |
Salviniaceae |
62 |
|
1.12 |
0.64 |
0.32 |
Veronica anagalis-aquatica |
Scrophulariaceae |
63 |
|
0 |
0.83 |
0.63 |
Typha minima |
Typhaceae |
64 |
|
0 |
0.83 |
0 |
Berula angustifolia |
Umbelliferae |
65 |
|
0.77 |
0.06 |
0 |
Hydrocotyle ranunculoide |
Umbelliferae |
66 |
16 counties of Guilan province) were E. crussgalli (Tables 2 and 3). In 2014 growing season, the average species frequency was 3.38percent and 42 species (63.6 percent of all species) were identified. Species diversity in 2015 was higher than in 2013 and 2016. In 2015, the average species frequency was 3.87 percent, 35 percent higher than 2014 years old, and 65 species (98.5 percent) were identified from 66 species. In 2016, the average frequency of species was 4.82 percent, which was 29.8 percent higher than 2014 years and 19.7 percent more than 2015 years old and 53 species (80.3 percent) were identified from 66 species. Species diversity in 2015 was more than 2014 and 2016 years (Table 3). The first and most important step in precision agriculture is the plan for the distribution of weeds.
Maps are often generated by manually drawing polygon around areas where the species is known to occure some automated interpolation procedures. The distribution map of several important and important weed species of Guilan rice farms is shown in Figure 3. In this research, weeds of rice farms in different years
have frequency and species diversity. In 2014, the average frequency of species was 38.3 percent and 42 species (63.6 percent of all species) were identified. The highest frequency of species in the year 2014 consisted of E. crussgalli, P. distichum, E. oryzoides, C. esculentus, E. prostrata, A. filiculoides, S. trifolia, L. minor and A. plantago-aquatica. In 2015, the average species frequency was 3.87 percent which was 35 percent higher than 2014 years old and 65 species (98.5 percent) were identified from 66 species. The highest amount of weed species in year 2015 was in E. crussgalli, E. oryzoides, P. distichum, E. prostrata, C. esculentus, A. plantago-aquatica, L. minor, C. difformis, A. multiflora and S. trifolia. In 2016, the average frequency of species was 4.82 percent, which was 29.8 percent higher than 2014 years old and 19.7 percent of the year 2015 and 53 species (80.3 percent) were identified from 66 species. The highest frequency
of weed species in the year 2016 was in frequency including P. distichum, E. crussgalli, C. esculentus, C. serotinus, E. oryzoides, E. prostrata, A. filiculoides, S. trifolia, C. difformis and A. plantago-aquatica (Table 3). This suggests that the species occurs throughout the area represented by the map polygons. Most of the weeds that had the highest frequencies, uniformity, and mean density in the farm are hard to control (Hakim et al., 2013). Weed flora composition in agricultural systems results from seasonal changes, crop rotation, and long-term environmental changes such as soil erosion and climate change. Agricultural operations such as plowing, the crop plant species grown, weed control methods, and fertilizer application change the natural distribution pattern and availability of resources and, hence, change the structure and composition of plant species (Ahmadvand, 2005; Kraemher et al., 2016; Lal et al., 2014; Noroz zade et al., 2008). Accurate determination of weed distribution pattern and density at each location is of great importance. Therefore, before any action is taken, the necessary maps of weed distribution pattern and density must be prepared (Lass et al., 1993).
Conclusions and Recommendations
Every year, due to insufficient knowledge in the farm of identification and factors affecting weed control, their population increases and therefore the role of management in changing the structure of communities and diversity of weed species can be useful in developing strategies and weed management. The most important weeds of rice farms in terms of frequency recorded from study area were E. crussgalli (89.81%), P. distichum (79.42%), E. oryziodes (60.29%), C. esculentus (56.5%), E. prostrate (49.5%), C. serotinus (34.73%), A. filiculoides (34.1%), C. difformis (31.6%), S. trifolia (31.61%), A. plantago-aquatica (28.69%), and Lemna minor (28.26%). Due to the importance of rice in Guilan and the lack of basic information about the status of weeds in this product, identification of weed flora and distribution map of weed species in the GIS system by each city to important information to improve weed management methods we will achieve this important agriculture.
Novelty Statement
The identification of weeds in Guilan rice fields was done for the first time and according to the up-to-date technology of the GIS, a distribution map for the optimal management of weeds was prepared and made available to users.
Author’s Contribution
Mohammad Javad Golmohammadi: Conducted the research.
Hamid Reza Mohammaddoust Chamanabad: Helped in article writing.
Bijan Yaghoubi: Proposal preparation and article writing and visit farms.
Mostafa Oveisi: Helped in data analysis.
Conflict of interest
The authors have declared no conflict of interest.
References
Ahmadvand, G., 2005. Weed flora in wheat (Triticum aestivum) farms of hamadan county, the first conference on weeds in Iran.
Awan, T.H., P.C Cru and B.S. Chauhan. 2015. Growth analysis biomass partitioning of Cyperus iria in response to rice planting density and nitrogen rate. Crop Prot., 74: 92-102. https://doi.org/10.1016/j.cropro.2015.04.010
Chauhan, B.S. and D.E. Johnson. 2011. Ecological studies on Echinochloa cruss gali and the implications for weed management in direct-seeded rice. Crop Prot., 30: 1385-1391. https://doi.org/10.1016/j.cropro.2011.07.013
Dass, A., K. Shekhawat, A.K. Choudhary, S. Sepat, S.S. Rathore, G. Mahajan and B.S. Chauhan. 2016. Weed management in rice using crop competition. Crop Prot. pp. 1-8. https://doi.org/10.1016/j.cropro.2016.08.005
FAO, 2016. Statistical databases. http://faostat.fao.org. Accessed on 29 October 2017.
Golmohammadi, M.J., H.R.M. Chamanabad, B. Yaghoubi and M. Oveisi. 2018. Rice weed community composition and richness in northern Iran: A temperate rainy area. Appl. Ecol. Environ. Res., 16(4): 4605-4617. https://doi.org/10.15666/aeer/1604_46054617
Guilan Meteorological Organization, 2019. Statistics. 24 pages.
Hakim, M.A., A.S. Juraimi, M.R. Ismail, M.M. Hanafi and A. Selamat. 2013. A survey on weed diversity in Coastal rice farms of Sebarang Perak in Peninsular Malaysia. J. Anim. Plant Sci., 23: 534-542.
Jabran, K. and B.S. Chauhan. 2015. Weed management in aerobic rice systems. Crop Prot. 78: 151-163. https://doi.org/10.1016/j.cropro.2015.09.005
Korejo, F., S.A. Ali, S.S. Tahir, M.T. Rajput and M.T. Akhter. 2010. Comparative morphological and biochemical studies of Salvadora species found in Sindh, Pakistan. Pak. J. Bot., 42(2): 1451- 1463.
Lal, B., P. Gautam and R. Raja. 2014. Weed community composition after 43 years of long-term fertilization in tropical rice-rice system. Agric. Ecosyst. Environ., 197: 301-308. https://doi.org/10.1016/j.agee.2014.08.014
Lass, L.W. and R.H. Callhan. 1993. GPS and GIS for weed survey and management. Weed Technol., 7(1): 249-254. https://doi.org/10.1017/S0890037X00037222
Main, C.L., D.K. Robinson, J.S. McElromy, T.C. Mueller and J.B. Wilkerson. 2004. A guide to predicting spatial distribution of weed emergence using geographic information systems (GIS). Online applied turfgrass science. https://doi.org/10.1094/ATS-2004-1025-01-DG
Ministry of Agriculture Jihad, 2019. Guilan agricultural jihad organization. Plan and budget. Yearly statistics and information.
Nelson, M.H., T.V. Orum, R.J. Gatciaand and A. Nadeem. 1999. Application of geographic information systems (GIS) and geostatices in plant disease. Plant Dis., 83: 308-319. https://doi.org/10.1094/PDIS.1999.83.4.308
Nkoa, R., M.D.K. Owen and C.J. Swanton. 2015. Weed abundance, distribution, diversity, and community analyses. Weed Sci., 63(sp1): 64-90. https://doi.org/10.1614/WS-D-13-00075.1
Shanwad, U.K., V.C. Patil, G.S. Dasog, C.P. Mansur and K.C. Shashidhar. 2002. Global positioning system in precision agriculture. University of Agricultural Sciences. Dharwad. Karnataka. India.
Thomas, A.G., 1985. Weed survey system used in Saskatchewan for cereal and oilseed crops. Weed Sci., 33: 34-43. https://doi.org/10.1017/S0043174500083892
Tshewang, S., B.M. Sindel, M. Ghimiray and B.S. Chauhan. 2016. Weed management challenges in rice (Oryza sativa L.) for food security in Bhutan. Crop Prot., 90: 117-124. https://doi.org/10.1016/j.cropro.2016.08.031
Wilson, J.P., W.P.I. Rubright, P.R. Coosey, D. Jacobson and R.D. Synder. 1993. Coupling geographic information systems (GIS) and models for weed control and groundwater protection. Weed Technol., 7: 255-264. https://doi.org/10.1017/S0890037X00037234
Yaghoubi, B., H. Alizadeh, H. Rahimian, M.A. Baghestani, M.M. Sharifi and N. Davatgar. 2010. Key paper. A review on researches conducted on paddy farm weeds and herbicides in Iran. 3th Iranian Weed Science Congress Babolsar, Mazandaran, Iran. pp. 2-11.
Yousefi, M.R. and A.M. Razdari. 2015. Application of Gis and Gps in precision agriculture. Int. J. Adv. Biol. Biomed. Res., 3: 7-9.
To share on other social networks, click on any share button. What are these?


