
Forecasting the Fisheries Production in Pakistan for the Year 2017-2026, using Box-Jenkin’s Methodology


Forecasting the Fisheries Production in Pakistan for the Year 2017-2026, using Box-Jenkin’s Methodology
Qaisar Mehmood1*, Maqbool Hussain Sial1, Saira Sharif1, Abid Hussain2, Muhammad Riaz3 and Nargis Shaheen4

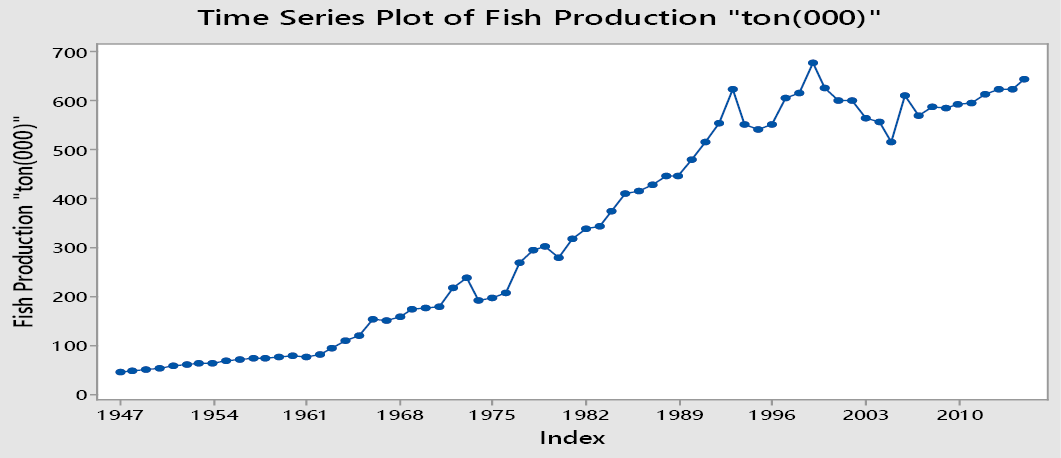
Figure 1
Time plot of the fisheries production.
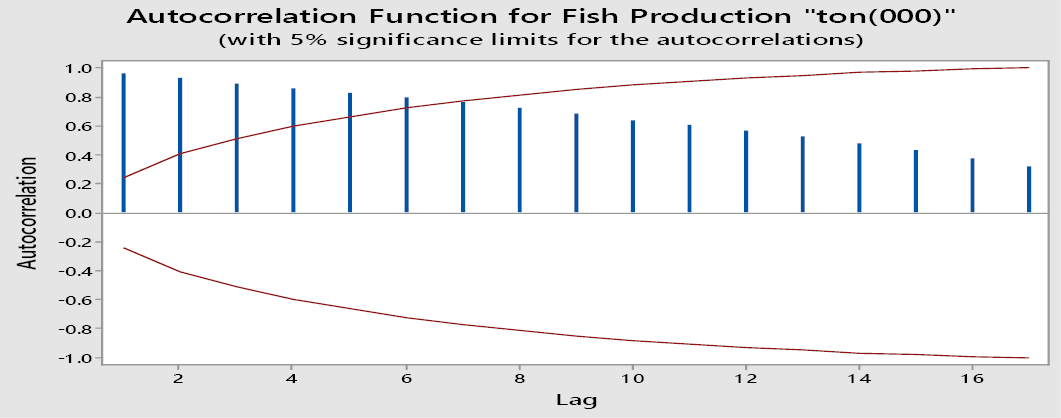
Figure 2
ACF plot for fisheries production.
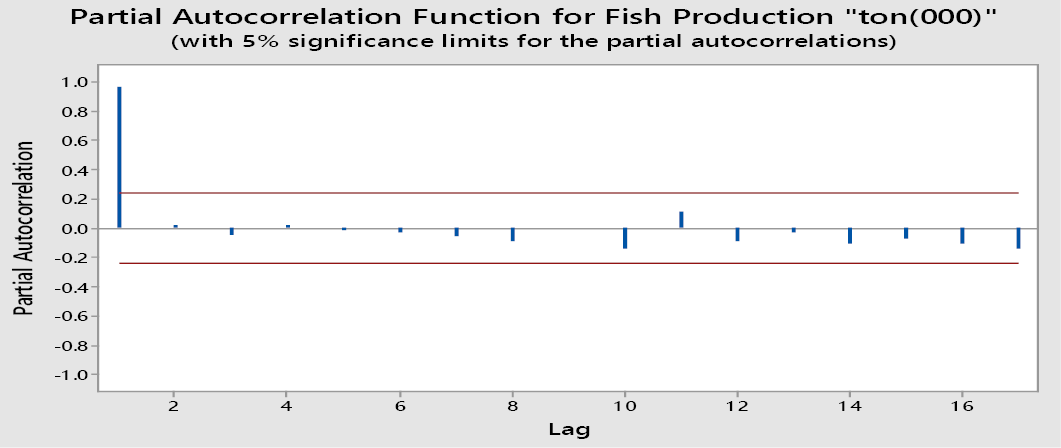
Figure 3
PACF plot of the fisheries production.

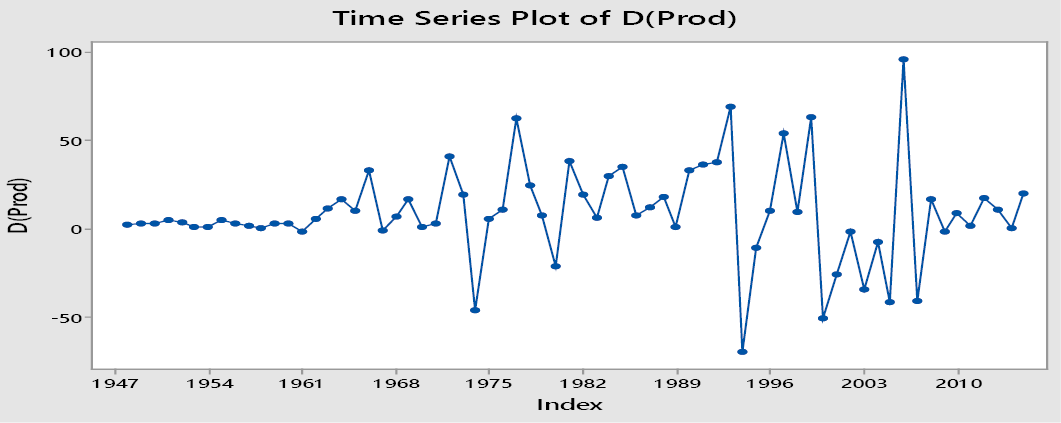
Figure 4
Plot of the first difference of production.

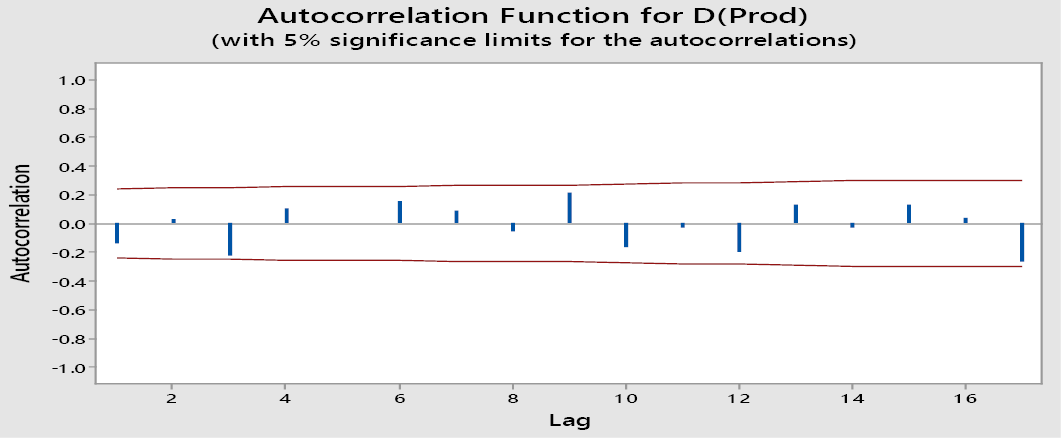
Figure 5
ACF plot of the first difference production.
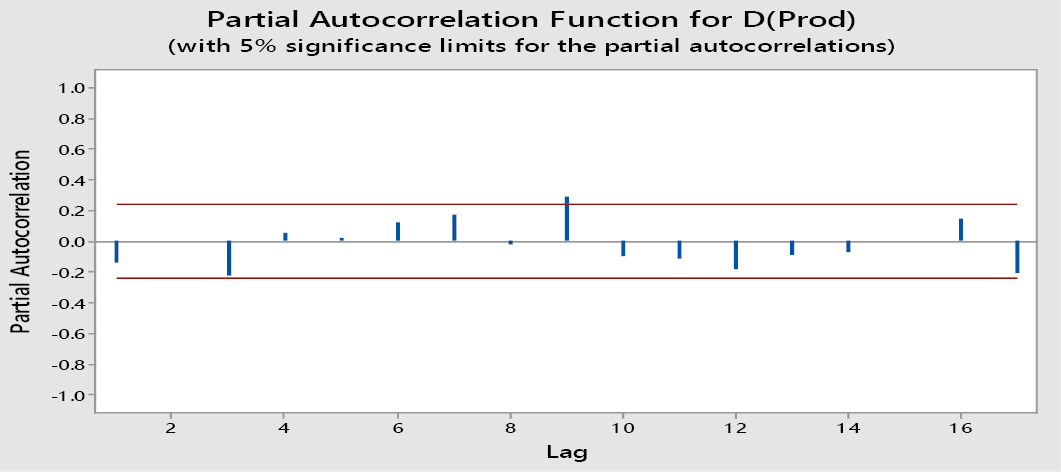
Figure 6
PACF plot of the first difference production.
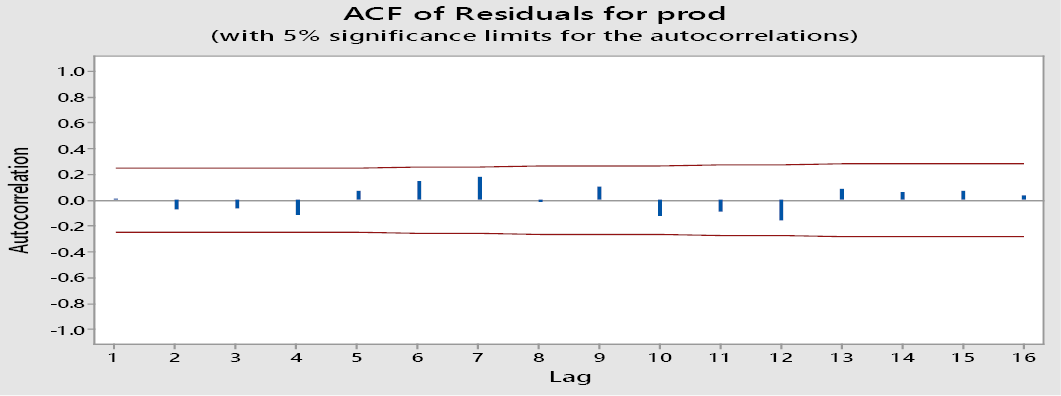
Figure 7
Plot of ACF of residual for production.

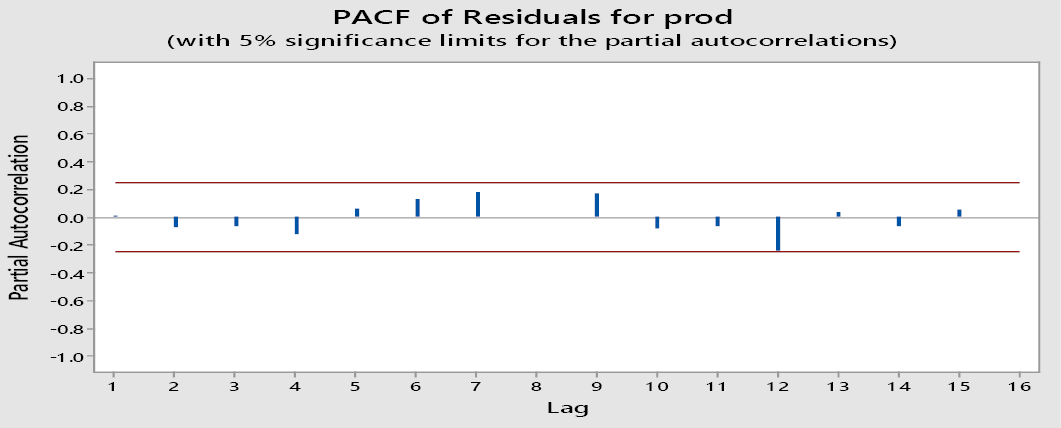
Figure 8
Plot of PACF of residual for production.
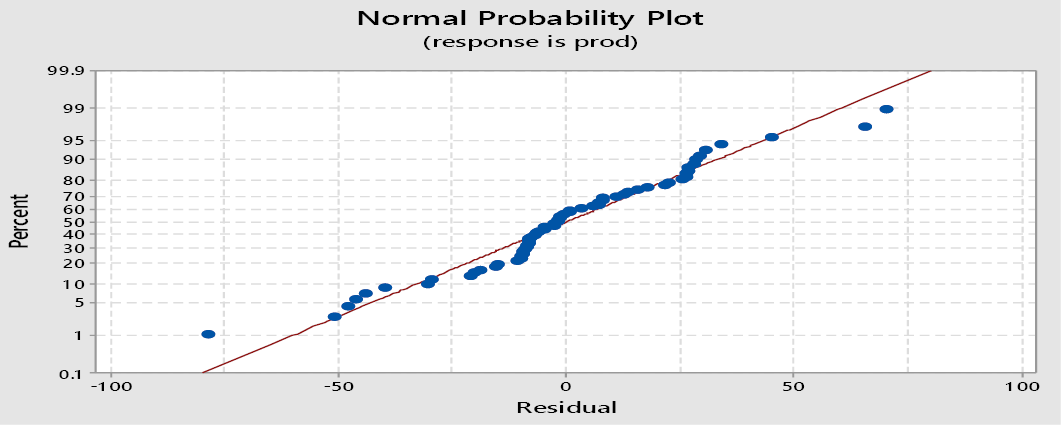
Figure 9
Residuals normal probability plot.

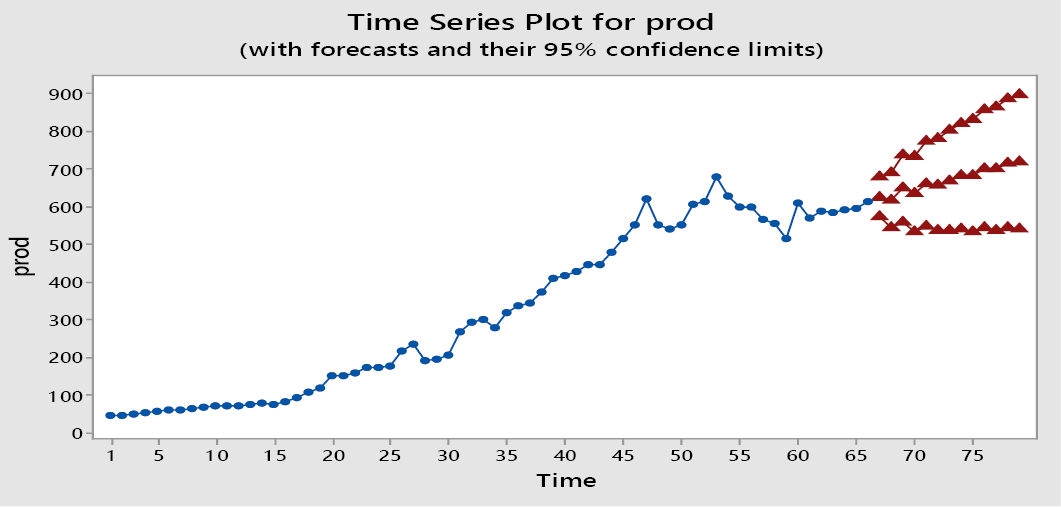
Figure 10
Time plot fisheries forecast production for year 2017-2026.


March 2020
Vol. 33, Iss. 1, Pages 1-191


