

Fishery Stock Appraisal of Trichiurus lepturus (Linneaus, 1758) by using SPMs: A Case Study of Shandong, China


Fishery Stock Appraisal of Trichiurus lepturus (Linneaus, 1758) by using SPMs: A Case Study of Shandong, China
Zhang Yan1,2 and Muhammad Mohsin3*
1Business School of Ningbo University, Ningbo University, Ningbo, 315211, China
2Wenzhou Business College, Wenzhou, 325035, China
3Fisheries Management, College of International Finance and Trade, Zhejiang YueXiu University of Foreign Languages, Shaoxing, 312000, China
ABSTRACT
Stock assessment of commercial fisheries is very important to ensure sustainable harvesting of fishery resources in China. Therefore, this study endeavors to estimate the fishery status of Trichiurus lepturus in Shandong, China. For this purpose, fishery statistics, 2007–2018 were statistically evaluated by surplus production models (SPMs). These models were applied to data through computer-based manually operated statistical routines, viz., ASPIC (a stock production model incorporating covariates) and CEDA (catch and effort data analysis). For the principal input (IP) value of 0.9, the former software suggested a maximum sustainable yield (MSY) of around 65,000 tons (t), whereas the latter one calculated MSY as 71,000 t. In ASPIC, coefficient of variation (CV) and R2 for Fox Model (F-M) and Logistic Model (L-M) remained at 0.113, 0.982 and 0.055, 0.895, respectively. Meanwhile, in CEDA, MSY outputs remained 72,082 t and 80,723 t (on average) for F-M and Schaefer Model (S-M) or Pella-Tomlinson Model (PT-M), correspondingly. Besides, it was found that fishing mortality (F) has increased from 0.510 (2007) to 1.099 (2018) whereas biomass t has decreased from 320,100 t (2007) to 68,890 t (2018), F-M in ASPIC. Estimated parameter values vividly signpost overharvesting of T. lepturus in Shandong, China. Thus, current management measures should be further strengthened for sustainable harvesting of this fishery resource and additional research on this topic.
Article Information
Received 09 April 2022
Revised 05 May 2022
Accepted 18 May 2022
Available online 27 July 2022
(early access)
Published 29 August 2022
Authors’ Contribution
ZY procured data, constructed tables and figures and revised/wrote several parts of the manuscript. MM initiated this project, performed statistical analysis and wrote the manuscript.
Key words
Trichiurus lepturus, Stock assessment, Management, SPMs, Shandong
DOI: https://dx.doi.org/10.17582/journal.pjz/20220409160400
* Corresponding author: [email protected]
0030-9923/2022/0006-2895 $ 9.00/0
Copyright 2022 by the authors. Licensee Zoological Society of Pakistan.
This article is an open access article distributed under the terms and conditions of the Creative Commons Attribution (CC BY) license (https://creativecommons.org/licenses/by/4.0/).
INTRODUCTION
China is a major producer and consumer of fish and fishery products globally (FAO, 2020). As a large fishing nation, thousands of coastal people depend on fishing to earn food and bread for their families. Therefore, a significant portion of fish production in China belongs to capture fisheries (Zhang et al., 2020). Therefore, it is essential to estimate the fish stock status of commercially important fish species in China (Szuwalski et al., 2020). Trichiurus lepturus, commonly called largehead hairtail, is an important commercial fishery resource in the marine waters of China. This fish dwells in tropical and subtropical parts of the world and is carnivorous in nature (Yan et al., 2011). It prefers to live in shallow waters of the inshore area and live in schools. It consumes diverse kinds of food, including crustaceans, squids, and other small fishes (Rohit et al., 2015). This fish has a peculiar spawning behavior. During each season of reproduction, females spawn many times, with a majority of females births. These fish have diverse size when it becomes mature. The size depends upon the characteristics of the fish stock (Martins and Haimovici, 2000). This fish has high export demand and hence experiences the pressure of commercial overfishing (Rohit et al., 2015). In the past, some researchers have explored stock depletion as a valid reason for the observed decline in the abundance index of this fish (Lin, 1987; Xu et al., 1994).
The concept of stock depletion is central in managing fisheries around the world. It means that fish biomass will decline in case of catch. Thus, efforts have been made to scientifically minimize the harms of catching onto the remaining fish stock. This would help to sustainably harvest fish. A special depletion concept called surplus production of fish stock is generally used to manage fisheries. The models based on surplus production are termed surplus production models (SPMs) (Hoggarth et al., 2006). These models are very famous for appraising fishery status all over the world. Because these models are convenient to use as they operate on simple catch statistics, however, their estimated parameters, such as maximum sustainable yield (MSY), fishing mortality (F), fish stock biomass (B), etc., are very important indicators of fishery status. In terms of their models assumptions, there exist two types of these models, i.e., equilibrium and non-equilibrium. The former type denotes no change, whereas the latter represents a change in fish population over time (Hoggarth et al., 2006; Medley and Ninnes, 1997).
SPMs are constructed on some suppositions. Such as no occurrence of competition within the same fish species or between different species. Likewise, r and age composition of fish are independent of each other. In the same way, fishery data represent a single fish unit. Equally, mortalities in fish stock, i.e., natural and fishing, happen at the same time. Correspondingly, fishery catch equipment efficiency does not vary with the passage of time. Catch figures truly represent the abundance index of the fish population. One or more of these assumptions are not realistic (Ewald and Wang, 2010). However, these models are reliable and frequently used in fisheries management all over the world (Musick and Bonfil, 2005).
Some scientific studies have focused on exploring various fishery aspects of T. lepturus in China. For example, Ji et al. (2019) estimated the total allowable catch of T. lepturus by using fishery statistics from the Yellow Sea and the Bohai Sea in China. They found that this fish resource is overexploited and suggested to improving fishery conservation policies. Likewise, Panhwar et al. (2018) study fishery population dynamics of T. lepturus from the East China Sea. They evaluated fish length and frequency statistics by FiSATII statistical routine and found a decline in catch biomass. They suggested determining better management strategies for the sustainable utilization of this fishery resource. Similarly, Kim et al. (2011) studied fishery parameters of T. lepturus in the East China Sea in relation to the environment. Liao et al. (2021) accessed the fishery status of T. lepturus in China and found overfishing of this fishery resource. Thus, a handful number of researchers have studied T. lepturus in Chinese marine waters. However, their studies are either reported from other regions of China, employ old fishery statistics, or use different statistical methods. Therefore, the current study is an original one.
MATERIALS AND METHODS
Data assembly
Fishery statistics are reported regularly by the Chinese government every year. To conduct this study, data related to the commercial catch of T. lepturus from Shandong, China, was mined from a formally published book of Fishery Yearbooks of China. Catch statistics spanning over 12 years, i.e., from 2007 to 2018 representing effort or count of fishermen and catch or reported catch of fish biomass in tons (t) was used. The non-equilibrium version of SPMs was employed to know about the ongoing fishery status of T. lepturus in Shandong, China. These models assume fishery in non-equilibrium state. Hence, fishery status is dynamic. This assumption is more realistic in nature and reliable.
Data evaluation
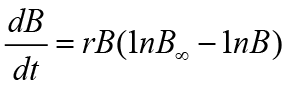
To ensure the reliability and dependability of this study, multiple non-equilibrium versions of SPMs were used simultaneously. First, a famous model developed by Fox, hence termed as Fox Model (F-M), was applied to data. Second, another model proposed by Schaefer, known as Schaefer Model (S-M), was employed. Third, a model established by Pella-Tomlinson or PT-M was used in this study. These SPMs are famous globally and have been used in many fishery management studies. F-M and S-M assume that the growth rate of the fish population (r) is related to the carrying capacity (K). Thus, in this sense, both of these models are essentially alike. However, they differ in terms of the relationship between production and the fish population stock size. The height and position of production peak depend on r and K. F-M is built by using growth as described by Gompertz and uses a generalized production model of a fishery. F-M is represented as below:
 (
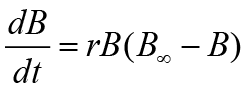
(Here, B stands for fish biomass and t for time. SM assumes a symmetrical link between production and stock size of the fish population. This is basically a function of r, K, and fish population which is not exploitation. S-M is the most come model of SPMs frequently used to access fish population dynamics. This model yields symmetrical curves representing sustainable yield. S-M renders the concept of logistic increase of fish population and can be presented as follows:
 (
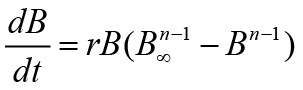
(B∞ denotes fish population carrying capacity. PT-M resembles S-M in its mathematical description. However, PT-M differs from S-M because that it contains an additional parameter, z. This parameter results in the distortion of SM. Statistically speaking, PT-M behaves like S-M at z = 1. PT-M also renders the concept of the Gompertz growth equation and generalized production concept. Mathematically, PT-M can be expressed as follows:
 (
(Here, n stands for the shape of a parameter. Non-equilibrium versions of SPMs were applied to data through specialized fishery software. First, CEDA (catch and data analysis) computer application was used to estimate fishery parameters for T. lepturus (Hoggarth et al., 2006). Second, another reliable statistical routine, i.e., ASPIC (a stock production model incorporating covariates), was also employed to evaluate data to estimate important fishery management parameters (Prager, 2005). We used commercial catch statistics which are useful in computing and managing fishery resources. However, fishery statistics reported for the continuous recent years are important (Hoggarth et al., 2006). Thus, the data meets the requirement for this study. It is important to mention that sometimes different models compute the same parameter estimates, which happens because of some reason. It happens because models in such conditions do not have any major effect on the assumptions on which they are built. Using multiple models in the same study is advantageous. As models can be compared and best-fitted model can be used to identify fishery management policy.
CEDA computer application
CEDA is a windows operating computer package having customized options for ease of use. This software is widely used in fishery management studies. Its estimation of parameters is very special as it used bootstrapping method along with a 95% statistical confidence interval. Before starting data analysis with CEDA, the principal IP value was calculated by dividing the highest catch by the first reported catch in the data series. This study’s obtained principal IP or IP value was 0.9, as the first reported catch was almost 90% of the reported catch. Fishery parameters were estimated mainly for this IP value. However, we also conducted a sensitivity analysis in which assumed values of IP from 0.1 to 1 were used to calculate fishery parameters. Moreover, in CEDA, all the models, i.e., F-M, S-M, and PT-M, were employed along with three error assumptions which were log (L), log normal (LN), and gamma (G). The catch and effort file prepared in .dot format was uploaded in CEDA, and fishery parameters for all of these models and their error assumptions were calculated through manual operation of the software. Parameter observations were recorded, and later on, graphs were constructed by using Excel 2013. Estimated parameters included MSY, B, K, r, R2, q, and CV.
ASPIC computer application
This computer application is a common fishery management aid tool recognized globally for its dependability. Fishery parameters were estimated for all the IP values, including the principal IP value. However, for each IP value, two files were prepared. First, the BOT file (management objective), and second, the FIT files (bootstrapping method). These files were run into the software, and 500 trails were set for parameter calculation. BOT files take a long time to calculate parameters. After output files were generated by software, they were saved, and data was extracted from them and arranged into tables. This software calculated MSY, K, q, R2, FMSY, CV, and BMSY.
In the end, to compare results obtained from different models, we have used specific criteria. Various parameter estimates were used to compare models. First, MSY estimates were observed, and only models with suitable MSY values were accepted. Second, models with suitable values were considered for drawing a conclusion. Third, models having R2 values more than 0.5 were accepted only. By using this criterion, we compared models to find the best fit for drawing some conclusions.
RESULTS
Fishery catch statistics of T. lepturus from Shandong, China, indicate considerable variation during the study period. First, catch quantity has dropped from 131,713 t (2007) to 71,555 t (2018). The average reported catch remained 85,633 t/year from 2007 to 2018. The maximum and minimum catch in the data series was 131,713 t (2007) and 62,458 t (2015). Second, in contrast to catch, an effort has shown a rising trend from 2017 (498,141) until 2012 (1,009,228). However, in the later years, an effort has shown little increase until 2018 (1,019,108). By using catch and effort statistics, CEDA software has calculated the predicted yield. The predicted yield has significantly dropped from 2007 (109,946 t) to 2012 (52,535 t). Between 2013 (51,864 t) and 2018 (49,727 t) predicted yield values are close to each other (Fig. 1).
Figure 2 demonstrates the relationship between computed CPUE and effort in the form of a graph accompanied by the trend line. It is quite obvious that an increase in the effort has resulted in a decreased CPUE. Maximum CPUE can be observed in 2007 (0.264), whereas minimum CPUE is witnessed in 2018 (0.07). Linear trend line (R2=0.894) signpost swiftly declining CPUE during the course of the study. In this study, seven residual graphs were obtained for reported and estimated catch values by using CEDA. Estimates of catch were higher for FM by using all EAs, whereas their values remained lower for the other two models, viz., S-M, and PT-M for L and N EAs (Fig. 3).
CEDA parameter estimation
Sensitivity analysis output for the estimation of MSY by using CEDA is tabulated in Table I. Estimated parameters showed a pattern for the estimation of MSY. For higher IP values, lower MSY estimates were obtained, whereas, for lower IP, values this software computed higher MSY calculations. Moreover, for F-M, mostly G EA resulted in minimization failure (MF). In the case of S-M and PT-M, these models mostly produced MF for N and LN EAs. Fishery parameter estimates for principal IP (0.9) are given in Table II. In F-M, N, LN, and G EA calculated MSY as 71,900 t, 71,867 t, and 72,479 t, in that order. Whereas values of R2 for these EAs remained at 0.850, 0.827, and 0.839, respectively. Here, the values of CV were computed as 0.057, 0.048, and 0.058, correspondingly. In S-M and PT-M, for N and LN, estimates of MSY remained the same, i.e., 81,050 t and 80,397 t. In these models, the values of R2 remained the same at 0.613 and 0.585. The values of CV were estimated differently in these models, i.e., 0.103, 0.035, and 0.099, 0.033, in that order. G EA did not produce any results as it encountered MF in both S-M and PT-M.
Table I. CEDA MSY estimates of sensitivity analysis for T. lepturus in Shandong, China (For IP range between 0.5 and 1.0).
|
IP |
|
|
|
Model |
|
|
|
|||
|
FM |
SM |
PTM |
||||||||
|
F-M-N |
F-M-LN |
F-M-G |
S-M-N |
S-M-LN |
S-M-G |
PT-M-N |
PT-M-LN |
PT-M-G |
||
|
MSY |
||||||||||
|
0.6 |
1480235 |
80348 |
MF |
MF |
88971 |
MF |
MF |
88971 |
MF |
|
|
0.7 |
84528 |
88458 |
MF |
MF |
84195 |
MF |
MF |
84195 |
MF |
|
|
0.8 |
79285 |
74605 |
MF |
MF |
82640 |
MF |
MF |
82640 |
MF |
|
|
0.9 |
75193 |
80190 |
MF |
91597 |
76706 |
89736 |
91597 |
76706 |
89736 |
|
|
1 |
71900 |
71867 |
72479 |
81050 |
80397 |
MF |
81050 |
80397 |
MF |
|
|
CV |
||||||||||
|
0.6 |
40182 |
0.013 |
MF |
MF |
0.004 |
MF |
MF |
0.004 |
MF |
|
|
0.7 |
0.033 |
0.002 |
MF |
MF |
0.007 |
MF |
MF |
0.008 |
MF |
|
|
0.8 |
0.060 |
0.035 |
MF |
MF |
0.011 |
MF |
MF |
0.010 |
MF |
|
|
0.9 |
0.060 |
0.021 |
MF |
0.028 |
0.038 |
0.039 |
0.028 |
0.038 |
0.038 |
|
|
1 |
0.057 |
0.048 |
0.058 |
0.103 |
0.035 |
MF |
0.099 |
0.033 |
MF |
|
MF, minimization failure.
Table II. CEDA approximations of T. lepturus fishery parameters in Shandong, China (For IP equal to 0.9).
|
Model |
MSY |
B |
K |
R2 |
r |
q |
CV |
|
F-M-N |
71900 |
65804 |
362931 |
0.850 |
0.539 |
8.93E-07 |
0.057 |
|
F-M-LN |
71867 |
67563 |
363832 |
0.827 |
0.537 |
8.80E-07 |
0.048 |
|
F-M-G |
72479 |
65503 |
356788 |
0.839 |
0.552 |
9.15E-07 |
0.058 |
|
S-M-N |
81050 |
53703 |
323283 |
0.613 |
1.003 |
9.20E-07 |
0.103 |
|
S-M-LN |
80397 |
62947 |
328873 |
0.585 |
0.978 |
8.65E-07 |
0.035 |
|
S-M-G |
MF |
MF |
MF |
MF |
MF |
MF |
MF |
|
PT-M-N |
81050 |
53703 |
323283 |
0.613 |
1.003 |
9.20E-07 |
0.099 |
|
PT-M-LN |
80397 |
62947 |
328873 |
0.585 |
0.978 |
8.65E-07 |
0.033 |
|
PT-M-G |
MF |
MF |
MF |
MF |
MF |
MF |
MF |
MSY, Maximum sustainable yield; B, final biomass; K, carrying capacity; R2, coefficient of determination; r, intrinsic population growth rate; q, Catchability coefficient; CV, coefficient of variation; MF, Minimization failure.
ASPIC parameter estimation
Many fishery parameters were estimated by using sensitivity analysis through ASPIC, and the obtained results are presented in Table III. F-M estimated higher MSY estimates for lower IP inputs and vice versa. However, L-M computed this parameter without any vivid, specific pattern. For principal IP (0.9), fishery parameters estimations are given in Table IV. In ASPIC, for F-M and L-M, estimates of MSY remained as 67890 t and 78200 t. The calculated values of R2 and CV remained at 0.982, 0.895, and 0.113, 0.055 for these models. Table V demonstrates F and B estimates of ASPIC and compares their obtained values between two models, viz., F-M and L-M. Generally speaking, in F-M, F has increased during the course of this study. On the other hand, B has gradually decreased. The same pattern of F and B is obtained for L-M. In F-M, B/BMSY has decreased considerably from 2.843 (2007) to 0.612 (2018). Meanwhile, F/FMSY showed an increasing trend during the course of this study, i.e., 2007 (0.794) and 2018 (1.708).
Table III. ASPIC MSY estimates of sensitivity analysis for T. lepturus in Shandong, China (For IP range between 0.5 and 1.0).
|
IP |
MSY |
K |
q |
R2 |
FMSY |
CV |
BMSY |
|
0.6 |
67890 |
512100 |
2.2E-07 |
0.982 |
0.360 |
0.112 |
188400 |
|
0.7 |
67930 |
516200 |
2.2E-07 |
0.982 |
0.358 |
0.111 |
189900 |
|
0.8 |
67920 |
514700 |
2.2E-07 |
0.982 |
0.359 |
0.112 |
189400 |
|
0.9 |
67900 |
513300 |
2.2E-07 |
0.982 |
0.360 |
0.120 |
188800 |
|
1.0 |
67890 |
513200 |
2.2E-07 |
0.982 |
0.360 |
0.113 |
188800 |
|
0.6 |
90670 |
193100 |
1.6E-07 |
0.860 |
0.939 |
0.144 |
96540 |
|
0.7 |
89730 |
186100 |
1.6E-07 |
0.877 |
0.965 |
0.040 |
93030 |
|
0.8 |
88450 |
193900 |
1.5E-07 |
0.877 |
0.912 |
0.020 |
96970 |
|
0.9 |
79000 |
251700 |
1.0E-07 |
0.895 |
0.628 |
0.054 |
125800 |
|
1.0 |
78200 |
258200 |
9.7E-07 |
0.895 |
0.606 |
0.055 |
129100 |
Table IV. ASPIC approximations of T. lepturus fishery parameters in Shandong, China (For IP equal to 0.9).
|
Model |
IP |
MSY |
K |
q |
R2 |
FMSY |
CV |
BMSY |
|
F-M |
0.9 |
67890 |
513200 |
2.2E-07 |
0.982 |
0.360 |
0.113 |
188800 |
|
L-M |
0.9 |
78200 |
258200 |
9.7E-07 |
0.895 |
0.606 |
0.055 |
129100 |
Table V. ASPIC calculations of T. lepturus fishery parameters (F and B) in Shandong, China (For IP equal to 0.9).
|
Year |
Model |
|||||||
|
F-M |
L-M |
|||||||
|
F |
B |
F/FMSY |
B/BMSY |
F |
B |
F/FMSY |
B/BMSY |
|
|
2007 |
0.510 |
320100 |
0.794 |
2.843 |
0.568 |
298900 |
0.938 |
2.315 |
|
2008 |
0.679 |
214400 |
1.055 |
1.904 |
0.748 |
191600 |
1.234 |
1.484 |
|
2009 |
0.769 |
153600 |
1.196 |
1.365 |
0.813 |
142100 |
1.342 |
1.101 |
|
2010 |
0.682 |
120700 |
1.061 |
1.072 |
0.692 |
116400 |
1.142 |
0.901 |
|
2011 |
0.790 |
113500 |
1.228 |
1.008 |
0.768 |
114000 |
1.268 |
0.883 |
|
2012 |
0.864 |
101500 |
1.344 |
0.901 |
0.808 |
106200 |
1.334 |
0.822 |
|
2013 |
1.160 |
90580 |
1.803 |
0.805 |
1.039 |
98470 |
1.715 |
0.763 |
|
2014 |
1.048 |
68680 |
1.630 |
0.610 |
0.925 |
77790 |
1.527 |
0.603 |
|
2015 |
0.949 |
64430 |
1.475 |
0.572 |
0.850 |
72810 |
1.404 |
0.564 |
|
2016 |
0.908 |
67000 |
1.412 |
0.595 |
0.834 |
74020 |
1.377 |
0.573 |
|
2017 |
0.975 |
70480 |
1.517 |
0.626 |
0.920 |
75930 |
1.519 |
0.588 |
|
2018 |
1.099 |
68890 |
1.708 |
0.612 |
1.101 |
71880 |
1.817 |
0.557 |
DISCUSSION
Three pioneer scientists, viz., Schaefer (1954), Pella-Tomlinson (1969), and Fox (1970), proposed fishery stock, production models. Later on, other researchers modified these models to access fishery stock status (Hilborn and Walters, 1992). Many of these models have been used by Chinese researchers for regional studies (Wang and Liu, 2013). We have employed the same models in this study to compute fishery parameters such as MSY, BMSY, and FMSY. Fundamentally, these models need simple fishery statistics and are easy to handle as compared to other routines used for fish stock assessment.
Non-statistically speaking, trends of CPUE also portray fishery stock status. Declining CPUE indicates overexploitation if the effort does not change. Conversely, if CPUE does not change even though an effort is rising, in this condition, it is perceived that there is no negative effect of fishing on the fish stock. On the other hand, MSY estimates directly represent fishery stock status. If their estimates are lower than reported catch statistics, a fishery is believed to be overexploited. If estimates are almost equal to the ongoing catch levels, it is recommended not to increase the fish catch. On the other hand, if MSY estimates are higher than the reported catch statistics, catch quantity can be increased with planning (Mohsin et al., 2017). Considering the results obtained in this study for CPUE and MSY, it is clear that T. lepturus fishery resource is overexploited in Shandong, China.
According to the published scientific literature, fishery overexploitation has many adverse economic effects (Clark, 1973). Fishers try to increase their earnings by catching more and more fish biomass. If catch quantity is not controlled, this results in the degradation of fishery stock and eventually extinction of fishery resources. Thus, fish stock assessment should be a regular measure to propose management measures. It is reported that many fishery resources in the world, around 25%, are experiencing the problem of overexploitation (FAO, 2007). However, if these resources are managed properly, they will bring economic benefits. However, restoring fishery resources is a time taking a job. Thus, most of the time, fishermen oppose this strategy as they cannot live without fishing. Some researchers suggest offering some incentives to the fishermen so that they feel satisfied and comply with the restoration of fishery resources. Along with advantages, the use of SPMs also has some disadvantages. Such as correct estimation of K, r and q need reliable and true fishery statistics. In some situations, when fish catch biomass shows a declining trend, these models are unable to predict the difference between K and r (Hilborn and Walters, 1992).
Management of fisheries is a multistep process starting from accessing fishery data and finally giving suggestions based on results (Die, 2002). Management advice depends upon some fishery parameter estimates, which are obtained after analysis. These estimates are indicators to the fishery managers are called points of reference for fishery management (Hoggarth et al., 2006). Usually, two types of these points are used in fishery management advice. First, points that are a target means that management tries to pursue these points or harvest levels. Second, points that should be avoided for effective fishery management, means these harvest levels are dangerous for fish stock and ruin management.
Many research findings indicate that overcapacity is the cause of overexploitation (Squires, 2010). When the fishery starts somewhere, it brings benefits to the fishermen. Consequently, the number of fishermen increases with the passage of time. However, fishery catch biomass starts to decrease. In the absence of proper management practice, not only do fishermen start to suffer from economic loss, but fish stock also becomes vulnerable to extinction. Besides incentives created by a high catch at an early stage of the fishery, local policies of fishing also result in overexploitation (Rosenberg, 2003) which has happened in China. To safeguard fishery resources through controlling catch and effort, China has implemented many measures such as single control and double control policies (Mu et al., 2007). Through these policies, the main effort has been made to control effort. Besides, a mid-summer fishing moratorium is also implemented in China to ban fishing in the Yellow Sea from June 1 to September 16 (Huiguo and Yunjun, 2008). It is also reported that in China, reported fishery catch was exaggerated in the past. To deal with it, a zero growth policy was implemented (Mu et al., 2007). However, many efforts have been made to manage fisheries in China; however, there is a room for further policies (Ji et al., 2019; Liao et al., 2021).
Some disadvantages are associated with the use of SPMs. Such as, these models do not rely on the age data of fish. Moreover, they do not recruit the time delays method. Besides, estimated MSY is also questionable. These deviations from reality and disadvantages do not nullify the reliability and use of SPMs rather, these are very powerful models for accessing fish stock (Musick and Bonfil, 2005).
CONCLUSIONS
Multiple SPMs were used to statistically evaluate catch statistics of T. lepturus reported from Shandong, China. In both the software, viz., CEDA and ASPIC, MSY showed sensitivity to IP values. By using principal IP (0.9), as compared to ASPIC, the MSY estimates were remained higher for CEDA. However, higher R2 values were obtained in ASPIC. MSY estimates and CPUE pattern indicate overharvesting of this fishery resource. This overharvesting has economic consequences. Therefore, it is suggested to lower catch quantities. Besides, there is a dire need to strengthen current management policies along with conducting more comprehensive and in-depth studies for making comprehensive management plan.
Statement of conflict of interest
The authors have declared no conflict of interest.
REFERENCES
Clark, C.W., 1973. The economics of overexploitation. Science, 181: 630-634. https://doi.org/10.1126/science.181.4100.630
Die, D., 2002. Design and implementation of management plans. In: A fishery manager’s guidebook: Management measures and their application (ed. K.L. Cochrane). FAO Fisheries Technical Paper No. 424. FAO’s Fisheries Department, Rome, Italy. Chapter 9. pp. 205-220.
Ewald, C.O. and Wang, W.K., 2010. Sustainable yields in fisheries: Uncertainty, risk-aversion, and mean variance analysis. Nat. Resour. Model., 23: 303-323. https://doi.org/10.1111/j.1939-7445.2010.00065.x
FAO, 2007. State of the world fisheries and aquaculture 2006. FAO’s Fisheries Department, Rome, Italy, pp. 1-180.
FAO, 2020. Species fact sheets. Ammodytes personatus (Girard, 1856). Available at: http://www.fao.org/ fishery/species/3261/en (accessed 15 July, 2021).
Fox, W.W.Jr., 1970. An exponential surplus-yield model for optimizing exploited fish populations. Trans. Am. Fish. Soc., 99: 80-88. https://doi.org/10.1577/1548-8659(1970)99<80:AESMFO>2.0.CO;2
Hilborn, R. and Walters, C.J., 1992. Quantitative fisheries stock assessment and management. Chapman-Hall, New York. https://doi.org/10.1007/978-1-4615-3598-0
Hoggarth, D.D., Abeyasekera, S., Arthur, R.I., Beddington, J.R., Burn, R.W., Halls, A.S., Kirkwood, G.P., McAllister, M., Medley, P., Mees, C.C., Parkes, G.B., Pilling, G.M., Wakeford, R.C. and Welcomme R.L., 2006. Stock assessment for fishery management. A framework guide to the stock assessment tools of the fisheries management science programme. FAO Fisheries Technical Paper No. 487, FAO’s Fisheries Department, Rome, Italy, pp. 1-261.
Huiguo, Y. and Yunjun, Y., 2008. Fishing capacity management in China: Theoretic and practical perspectives. Mar. Pol., 32: 351-359. https://doi.org/10.1016/j.marpol.2007.07.004
Ji, Y., Liu, Q., Liao, B., Zhang, Q. and Han, Y., 2019. Estimating biological reference points for Largehead hairtail (Trichiurus lepturus) fishery in the Yellow Sea and Bohai Sea. Acta Oceanol. Sin. 38: 20-26. https://doi.org/10.1007/s13131-019-1343-4
Kim, Y.H., Yoo, J.T., Lee, E.H., Oh, T.Y. and Lee, D.W., 2011. Age and growth of largehead hairtail Trichiurus lepturus in the East China Sea. KFAS, 44: 695-700. https://doi.org/10.5657/KFAS.2011.0695
Liao, B., Karim, E. and Zhang, E., 2021. Comparative performance of catch-based and surplus production models on evaluating largehead hairtail (Trichiurus lepturus) fishery in the East China Sea. Reg. Stud. Mar., 48: 102026. https://doi.org/10.1016/j.rsma.2021.102026
Lin X., 1987. Biological characteristics and resources status of three main commercial fishes in offshore waters of China. J. Fish. China, 11: 187-194.
Martins, A.S. and Haimovici, M., 2000. Reproduction of the cutlassfish Trichiurus lepturus in the southern Brazil subtropical convergence ecosystem. Sci. Mar., 64: 97-105. https://doi.org/10.3989/scimar.2000.64n197
Medley, P.A. and Ninnes, C.H., 1997. A recruitment index and population model for spiny lobster (Panulirus argus) using catch and effort data. Can. J. Fish. aquat. Sci., 54: 1414-1421. https://doi.org/10.1139/f97-027
Mohsin, M., Mu, Y.T., Memon, A.M., Kalhoro, M.T. and Shah, S.B.H., 2017. Fishery stock assessment of Kiddi shrimp (Parapenaeopsis stylifera) in the Northern Arabian Sea Coast of Pakistan by using surplus production models. Chin. J. Oceanol. Limnol., 35: 936-946. https://doi.org/10.1007/s00343-017-6096-3
Mu, Y., Yu, H., Chen, J. and Zhu, Y., 2007. A qualitative appraisal of China’s efforts in fishing capacity management. J. Ocean Univ. China, 6: 1-11. https://doi.org/10.1007/s11802-007-0001-1
Musick, J.A. and Bonfil, R., 2005. Management techniques for elasmobranch fisheries. FAO Fisheries Technical Paper No. 474, FAO’s Fisheries Department, Rome, Italy, pp. 1-251.
Panhwar, S.K., Dong, Z.Y., Tianxiang, G., Ping, W., Zhiqiang, W., Zhongming, W. and Yang, W., 2018. Decadal population traits and fishery of largehead hairtail, Trichiurus lepturus (Linnaeus, 1758) in the East China Sea. Pakistan J. Zool., 50: 1-5. https://doi.org/10.17582/journal.pjz/2018.50.1.1.5
Pella, J.J., and Tomlinson, P.K., 1969. A generalized stock production model. Int. Am. Trop. Tuna Comm. Bull., 13: 416-497.
Prager, M.H., 2005. A stock-production model incorporating covariates (Version 5) and auxiliary programs. CCFHR (NOAA) Miami Laboratory Document MIA-92/93-55, Beaufort Laboratory Document BL-2004-01.
Rohit, P., Rajesh, K.M., Sampathkumar, G. and Karamathulla, P.S., 2015. Food and feeding of the ribbonfish Trichiurus lepturus Linnaeus off Karnataka, south-west coast of India. Indian J. Fish., 62: 58-63. https://doi.org/10.21077/ijf.2016.63.4.60190-06
Rosenberg, A.A., 2003. Managing to the margins: The overexploitation of fisheries. Front. Ecol. Environ., 1: 102-106. https://doi.org/10.1890/1540-9295(2003)001[0102:MTTMTO]2.0.CO;2
Schaefer, M.B., 1954. Some aspects of the dynamics of populations important to the management of the commercial marine fisheries. Int. Am. Trop. Tuna Comm. Bull., 1: 23-56.
Squires, D., 2010. Fisheries buybacks: A review and guidelines. Fish Fish., 11: 366-387. https://doi.org/10.1111/j.1467-2979.2010.00365.x
Szuwalski, C.S., Jin, X., Shan, X., Clavelle, T., 2020. Marine seafood production via intense exploitation and cultivation in China: Costs, benefits, and risks. PLoS One, 15: 1–30. https://doi.org/10.1371/journal.pone.0227106
Wang, Y. and Liu, Q., 2013. Application of CEDA and ASPIC computer packages to the hairtail (Trichiurus japonicus) fishery in the East China Sea. Chin. J. Oceanol. Limnol., 31: 92-96. https://doi.org/10.1007/s00343-013-2073-7
Xu, H., Lin Z., Ding Y. and Xu, Y., 1994. Resource condition and management countermeasure of largehead hairtail in the East China Sea. J. Zhejiang Coll. Fish., 13: 5-11.
Yan, Y., Gang, H., Junlan, C., Huosheng, L. and Xianshi, J., 2011. Feeding ecology of hairtail Trichiurus margarites and large head hairtail Trichiurus lepturus in the Beibu Gulf, the South China Sea. Chinese. J. Oceanol. Limnol., 29: 174-183. https://doi.org/10.1007/s00343-011-0004-z
Zhang, W., Liu, M., Sadovy de Mitcheson, Y., Cao, L., Leadbitter, D., Newton, R., Little. D.C., Li, S., Yang, Y., Chen, X. and Zhou W., 2020. Fishing for feed in China: Facts, impacts and implications. Fish Fish., 21: 47–62. https://doi.org/10.1111/faf.12414
To share on other social networks, click on any share button. What are these?


