

Evaluation of Protective Effect of Naringenin on Cadmium-Induced Kidney Injury in Rats


Evaluation of Protective Effect of Naringenin on Cadmium-Induced Kidney Injury in Rats
Chen Zhao, Lulu Ding, Ying Ye, Congying Kou, Haoran Xiao, Jing Zhu and Jicang Wang*

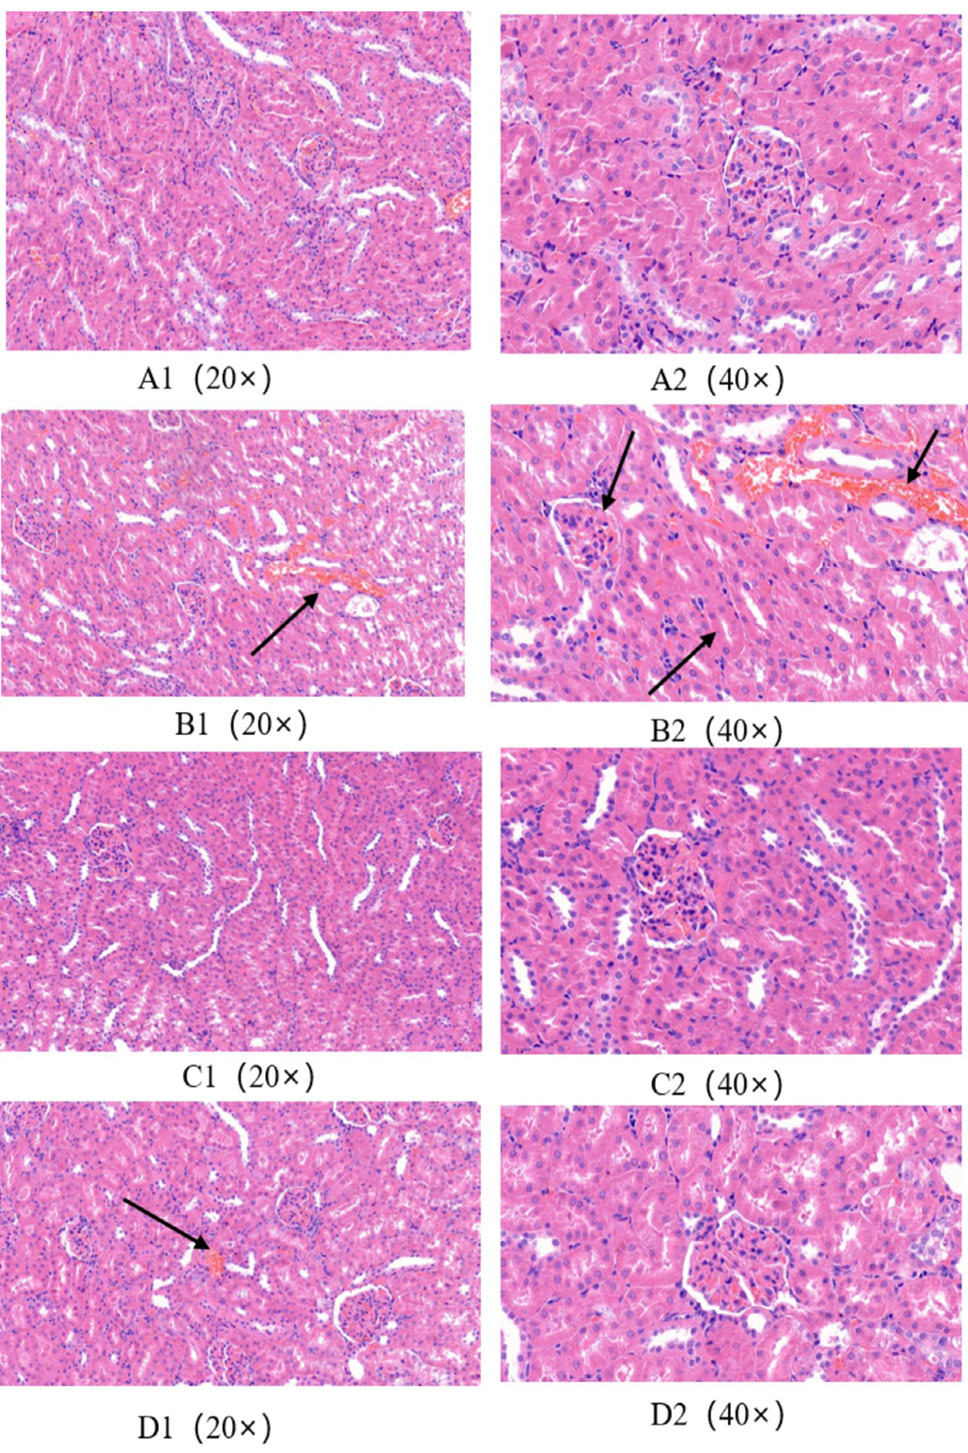
Fig. 1.
Effect of naringenin on Cadmium-induced kidney injury in rats. Rats were treated with Cd an/or Nar for 4 weeks. A1 and A2, the control group showing normal renal tissue structure, and structures such as glomerulus, renal tubule and renal cortex were clearly visible. B1 and B2, the Cd-treated group showing that renal glomerular cells atrophy, the structure of renal tubules was severely damaged, epithelial cells were disordered and degenerated, inflammatory cells infiltrated, interstitial congestion, and extensive lesions occurred: Cells are exfoliated and necrotic and interstitial fibrosis, cells are destroyed, and cell membrane boundaries are blurred; C1 and C2, the Nar-treated group showing normal kidney structure; D1 and D2, the kidney structure of the rats in the Cd+ Nar-treated group was basically normal.
Stain: H&E.

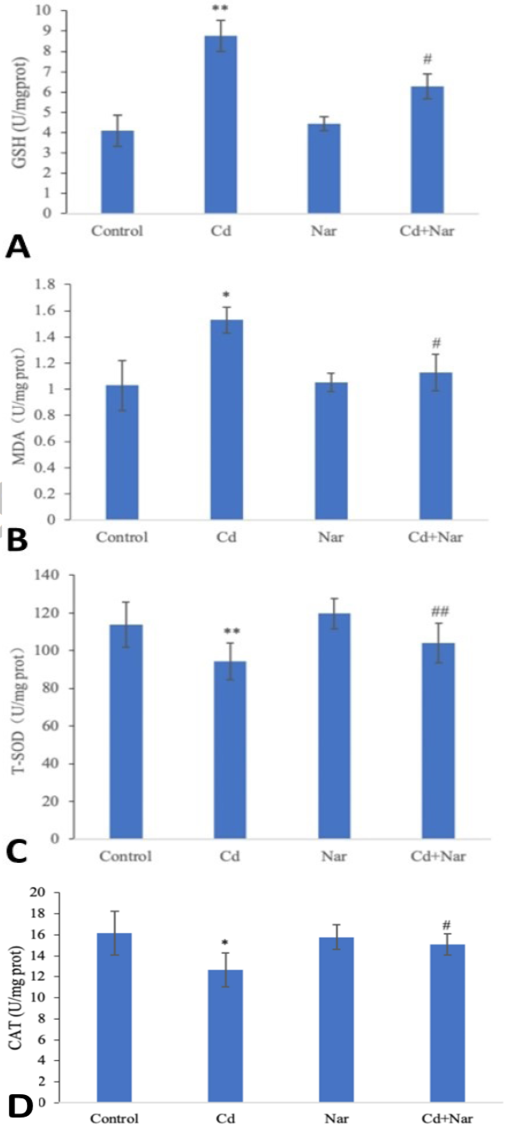
Fig. 2.
Effect of naringenin on GSH (A), MDA (B), and T-SOD activity (C) in rat kidney. Rats were treated with Cd an/or Nar for 4 weeks. Then, the content of GSH and activities of catalase and SOD in kidney tissue of rats in different treatment groups were detected. Data are represented as mean ± SE. n=6. “*” or “**” means that the difference is significant (* P<0.05) or extremely significant (** P<0.01) compared with the control group; “#” or “##” means that the difference is significant (# P<0.05) or extremely significant (## P<0.01) compared with the Cd-treated group.

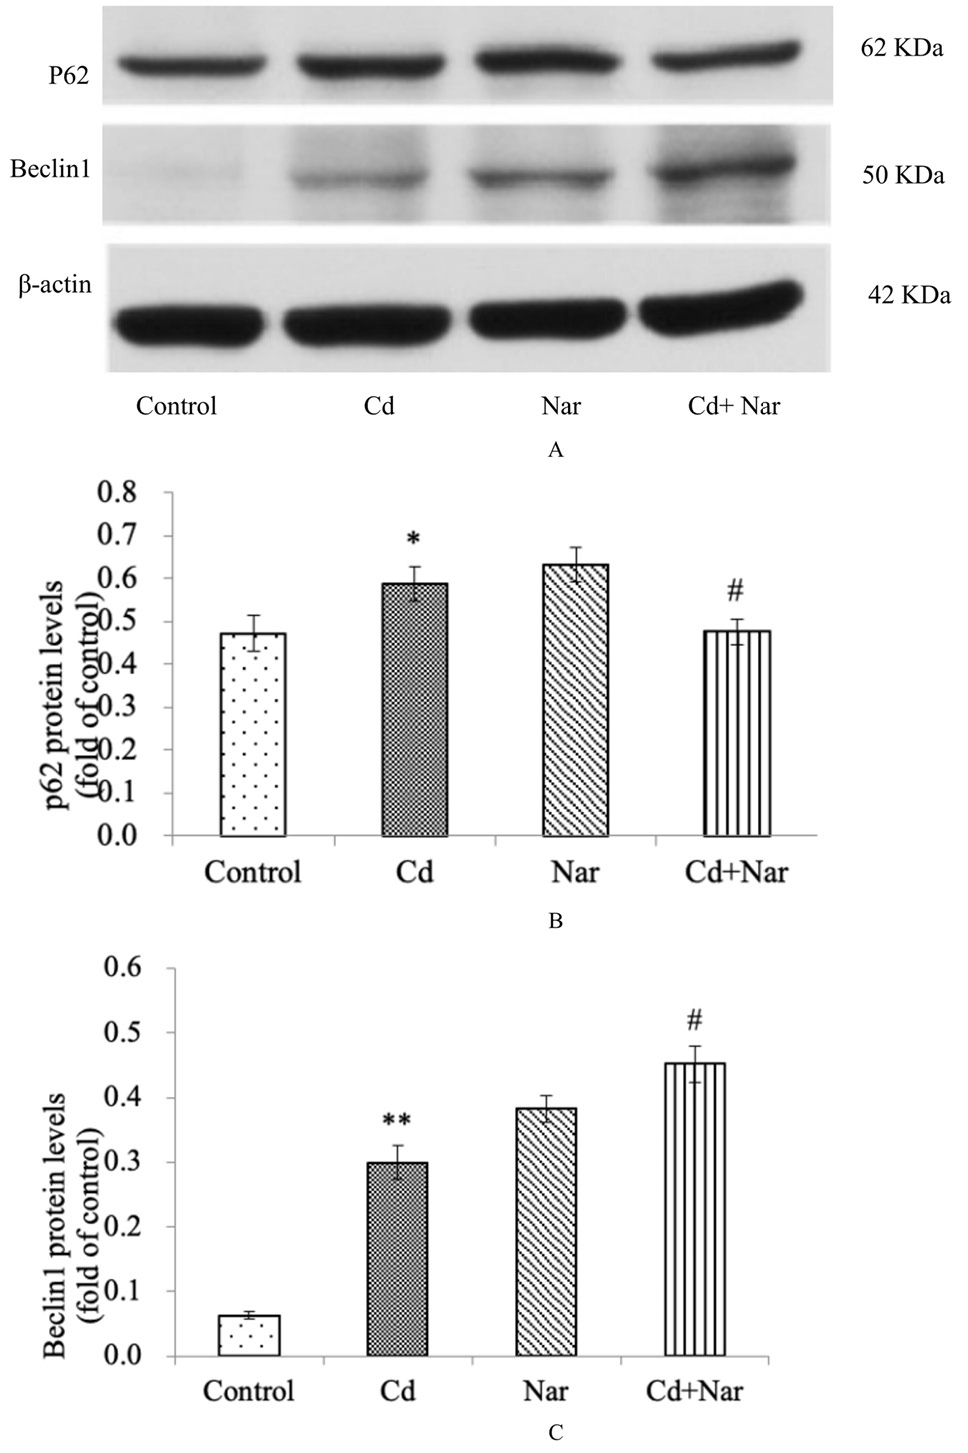
Fig. 3.
Effect of naringenin on the expression of p62 and Baclin1 in kidney tissue induced by cadmium.
Rats were treated with Cd and/or Nar for 4 weeks. Then, the protein expression levels of P62 and Beclin1 in kidney tissue were tissue were analyzed by western bolt. A: Western blot image; B: Quantitative analysis of P62 protein expression; C: Quantitative analysis of Beclin1 protein expression. “*” or “**” means that the difference is significant (* P<0.05) or extremely significant (** P<0.01) compared with the control group; “#” or “##” means that the difference is significant (# P<0.05) or extremely significant (## P<0.01) compared with the Cd-treated group.

October 2023
Pakistan J. Zool., Vol. 55, Iss. 5, pp. 2001-2500


