
Estimation of Net Rice Production by Remote Sensing and Multi Source Datasets


Estimation of Net Rice Production by Remote Sensing and Multi Source Datasets
Syed Muhammad Hassan Raza1*, Syed Amer Mahmood1, Syeeda Areeba Gillani1, Syed Shehzad Hassan1, Muneeb Aamir1, Muhammad Saifullah1, Mubashar Basheer1, Atif Ahmad1, Saif-ul-Rehman2 and Tariq Ali1
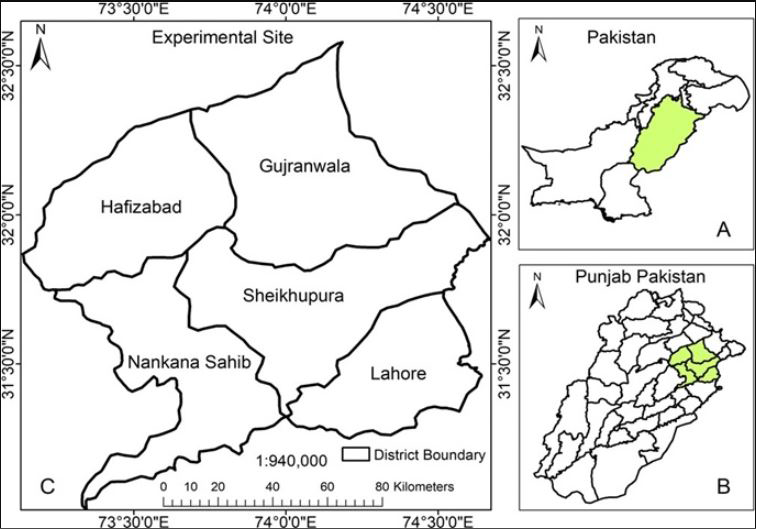
Map of Punjab province in Pakistan.
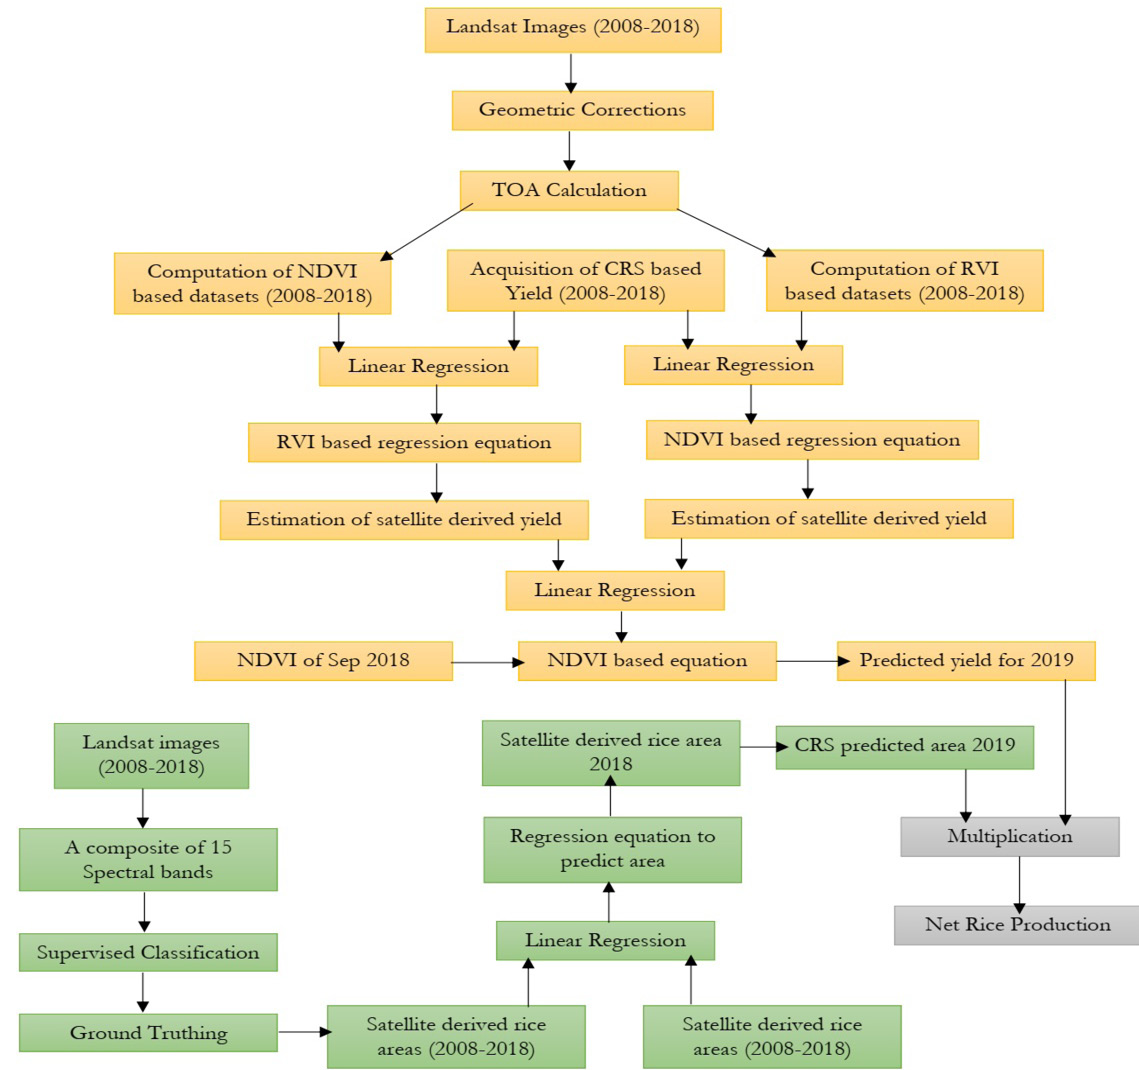
Flow of methodology
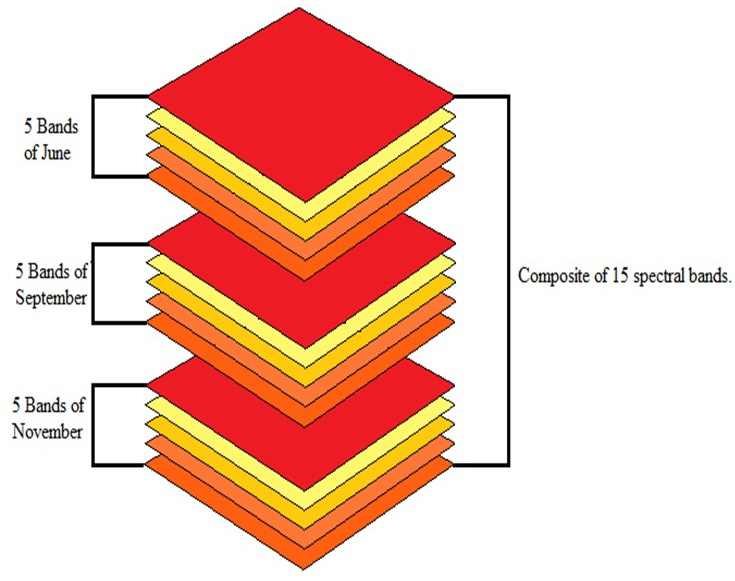
A composite containing 15 bands.

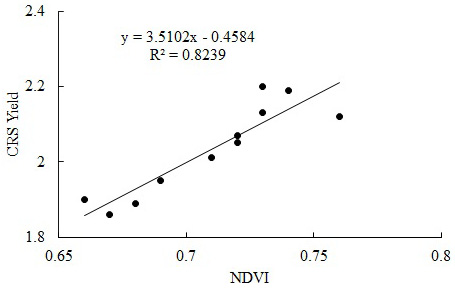
Linear regression applied to NDVI values and the CRS reported yield.
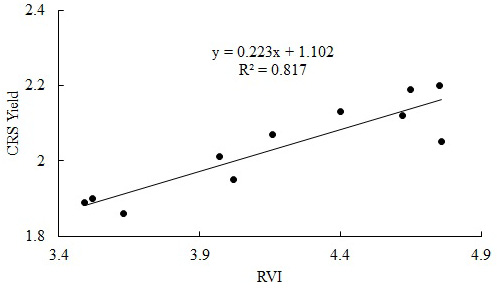
Linear regression applied to RVI values and the CRS reported yield.
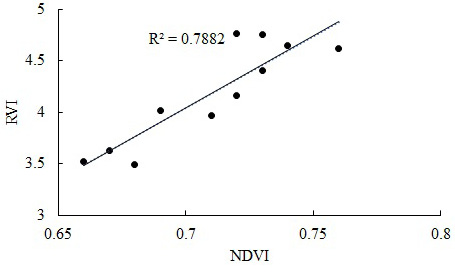
Relationship between NDVI and RVI based yield values.
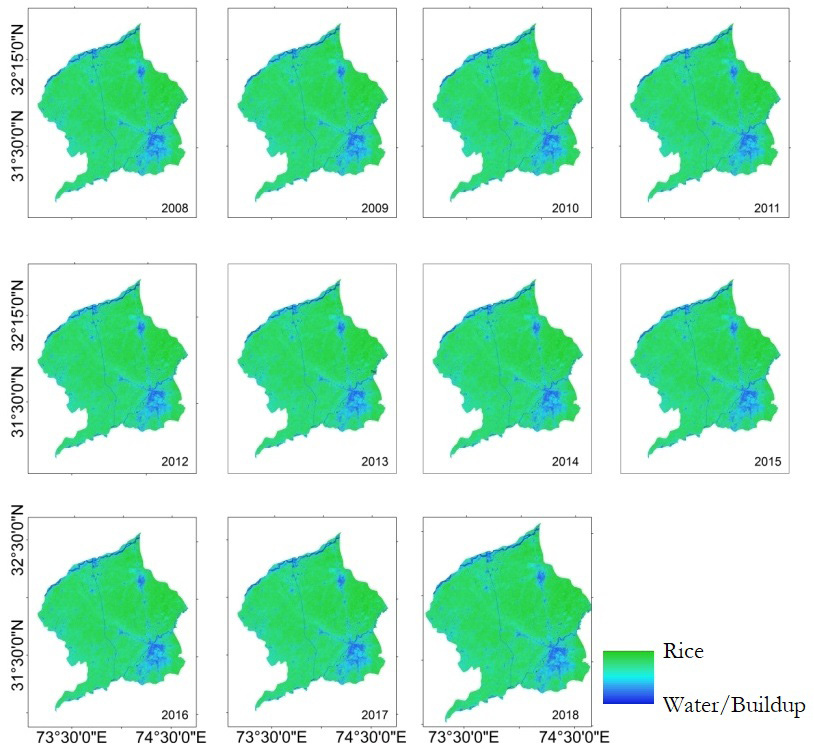
Spatio-temporal extent of rice cultivation from 2008-2016.

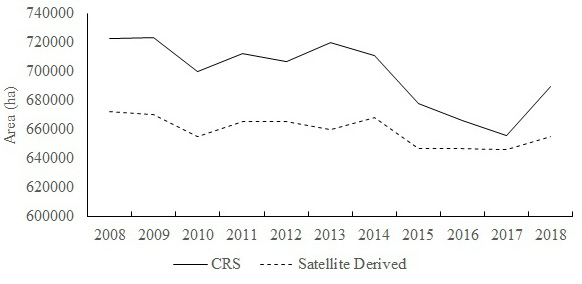
A comparison of rice areas.

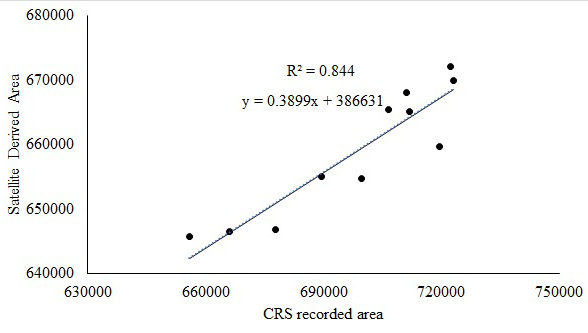
Linear regression applied to satellite verses CRS reported rice areas.

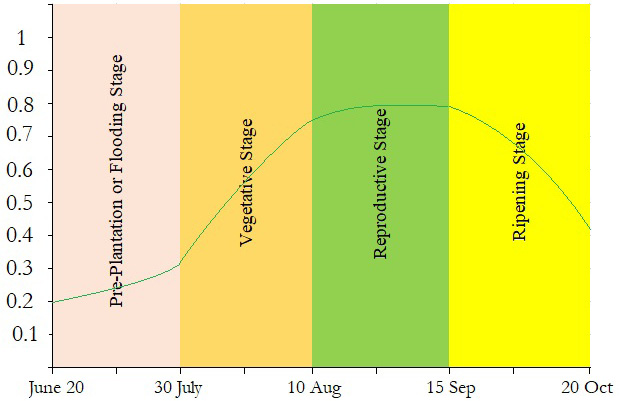
Variations in NDVI throughout the rice growth period including pre-plantationflooding,_vegetative stage, reproductive stage and the ripening stage.


