Epidemiology and Diagnostic Insights into Orf Virus Infection in Palestinian Sheep and Goats: A Histopathological and Serological Study
Epidemiology and Diagnostic Insights into Orf Virus Infection in Palestinian Sheep and Goats: A Histopathological and Serological Study
Hazem Sawalha*, Mujahed Abu-Alrub, Bashar Abu-Alrub, Abdalsalam Kmail**
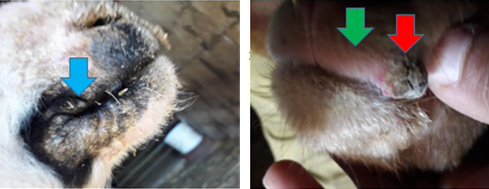
Orf-sick sheep. Symptoms appear clearly as swellings (red arrow), red spots (green arrow), and deformities (blue arrow) on the lips and mouth of Orf-sick sheep.
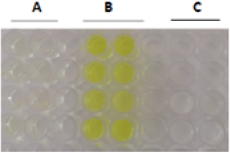
ELISA plate showing the antibody-antigen reaction of samples collected from the animal lips. Dark yellow wells are considered positive; A: Healthy animal; B: Diseased animal; C: Buffer sample.
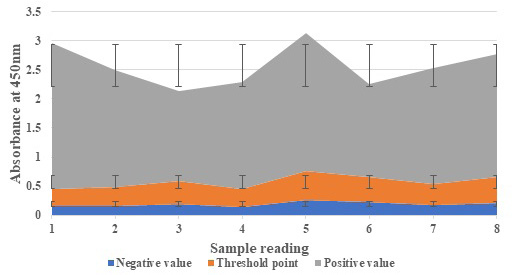
ELISA readings for positive and negative control. All readings above the threshold point are positive, while readings below such point are negative.
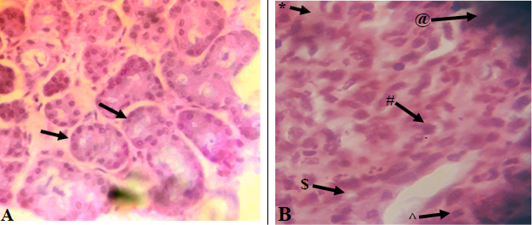
Microscopic images show a histological comparison between the lip tissues of an infected and a healthy sheep, where the former shows significant cellular and histological abnormalities with ulcerative and proliferative dermatitis; A: Healthy tissue with simple cuboidal epithelial forming the ducts of the salivary gland (black arrows); B: Infected tissue with a densely populated area of mononuclear phagocytic cells (personal communication with Dr. Khaled Qabaha, AAUP-Palestine) (Hash (#)), pale intracytoplasmic inclusion bodies (Caret (^)), subcorneal vesicles (Dollar Sine ($)), epithelial hyperplasia (Asterisk (*)), and necrotic crusts (At Sign (@)).
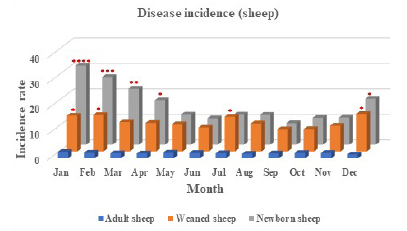
The disease incidence in adult, weaned, and newborn sheep throughout the year (January-December). Statistical analysis shows the significant differences between the treatments as indicated by asterisks.
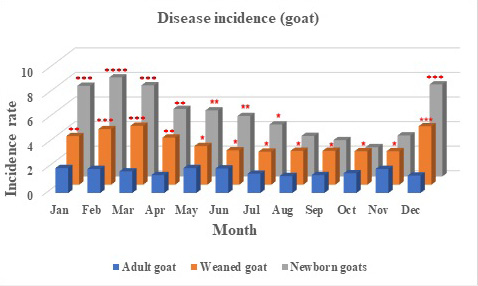
The disease incidence in adult, weaned, and newborn goats throughout the year (January-December). Statistical analysis shows the significant differences between the treatments as indicated by asterisks.
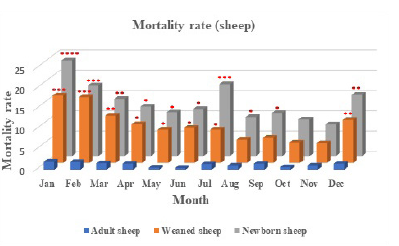
Mortality rate in adult, weaned, and newborn sheep throughout the year (January-December). Statistical analysis shows the significant differences between the treatments as indicated by asterisks.
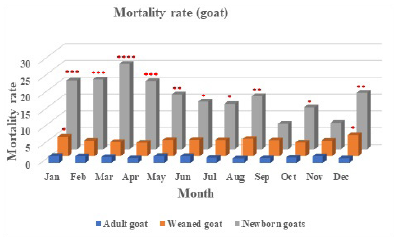
Mortality rate in adult, weaned, and newborn goats throughout the year (January-December). Statistical analysis shows the significant differences between the treatments as indicated by asterisks.
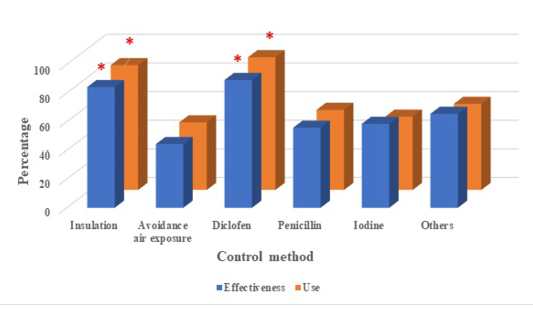
Methods of disease control, percentage of use and effectiveness. Statistical analysis shows the significant differences between the treatments as indicated by asterisks.


