Enhanced Phytase Production from Indigenous Bacillus subtilis KT004404 by Response Surface Methodology to be Used as Poultry Feed Supplement
Enhanced Phytase Production from Indigenous Bacillus subtilis KT004404 by Response Surface Methodology to be Used as Poultry Feed Supplement
Aqsa Javaid, Masoom Yasinzai* and Khunsa Saeed Kiyani
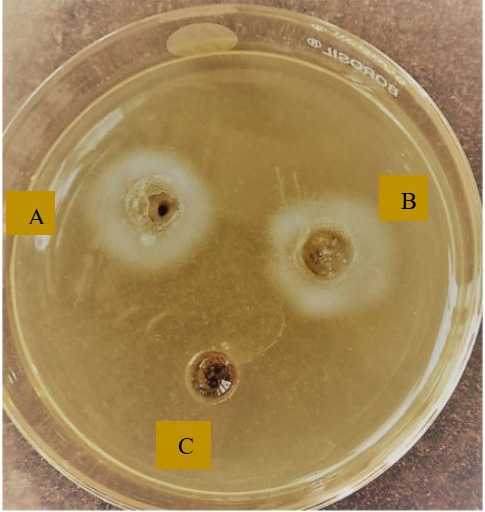
Qualitative assay for detecting extracellular phytase production by Bacillus subtilis KT004404 on phytase-screening medium (PSM) with Na-phytate. Zones of clearance formed around the wells (A) and (B) loaded with bacterial filtrate while well (C) was loaded with control and showed no clearance zone.
Response surface curve for production of phytase as a function of temperature incubation (A), pH-incubation (B), inoculum size-pH (C), temperature-inoculum size (D).
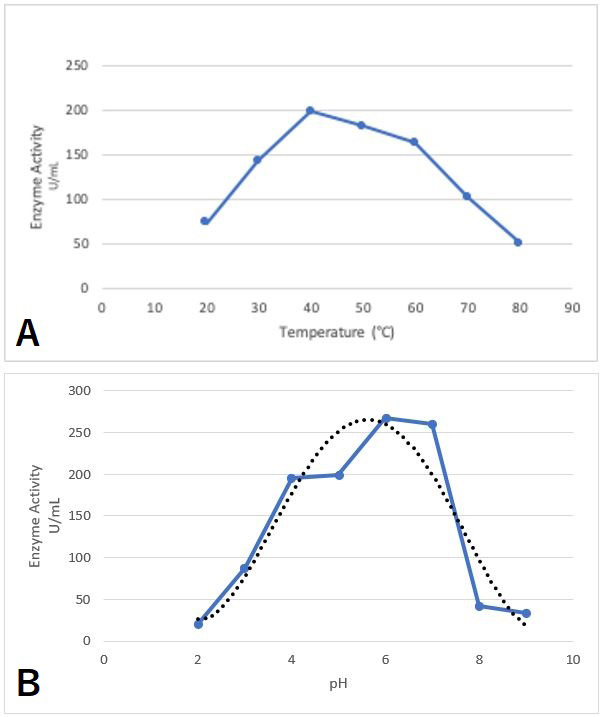
One factor plots for the effect of temperature (A) and pH (B) on phytase production.
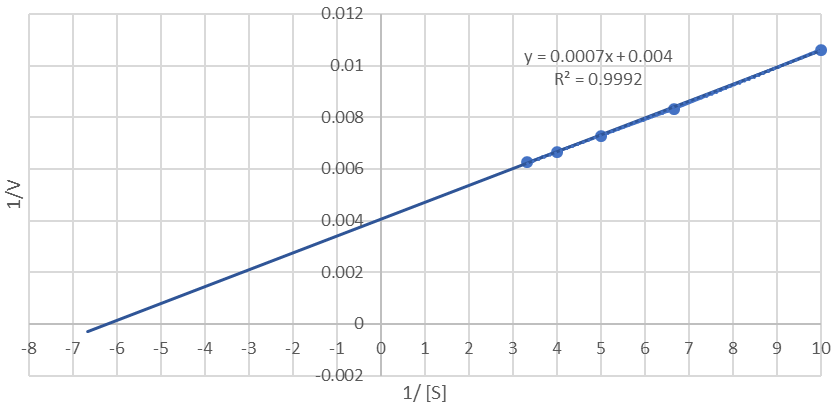
Lineweaver Burk plot drawn to calculate Vmax and Km values.
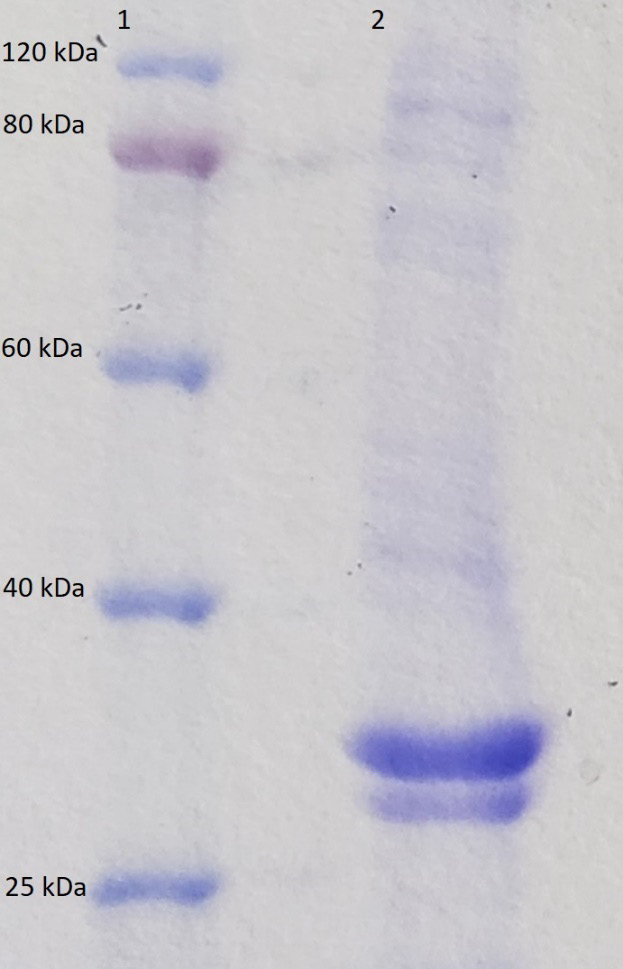
SDS-PAGE Lane 1: Protein ladder (PAGE- MASTER Protein Standard) Lane 2: Partially Purified Phytase.


