

Effects of Letrozole on Gonad Differentiation of Carp (Cyprinus carpio)


Effects of Letrozole on Gonad Differentiation of Carp (Cyprinus carpio)
Fang Wang, Yong-Fang Jia, Po Wang, Qi-Yan Du and Zhong-Jie Chang*

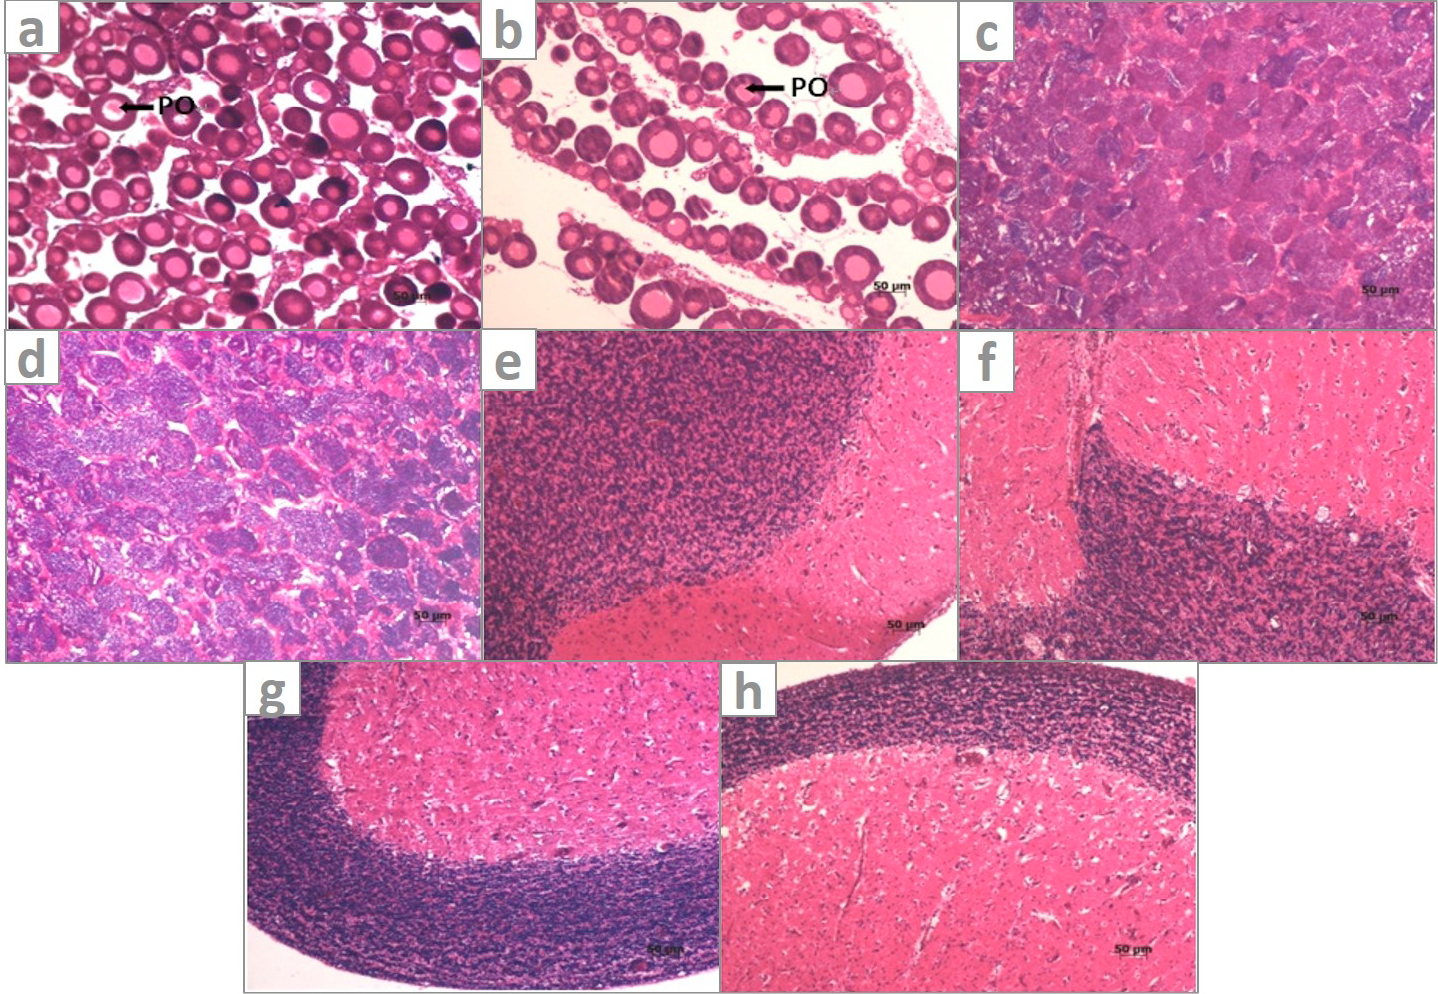
Histological structure of the gonads and brains of juvenile carp from control and the groups exposed to LET for 15d. a, Ovary from control groups showing abundance of large, closely arranged, uniformly developed primary oocytes; b, Ovary from LET(625μg/L)-treated groups showing increased prevalence of smaller early differentiated oocytes and enlarged ovarian plate space; c, Testis from control groups; d, from LET(625μg/L)-treated groups showing increased spermatogonial cells; e, brain from control male; f, brain from LET(625μg/L)-treated male; g, brain from control female; h, brain from LET(625μg/L)-treated female. PO, primary oocytes.
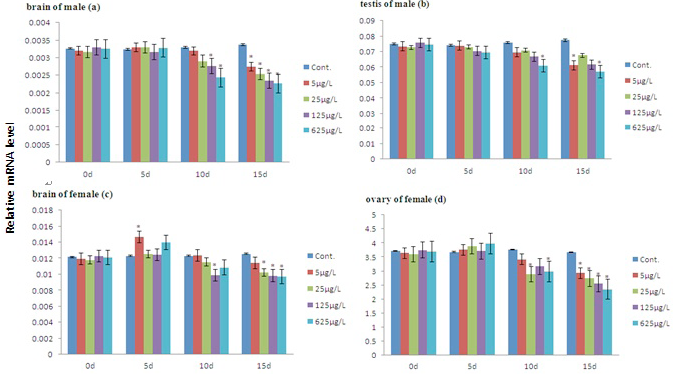
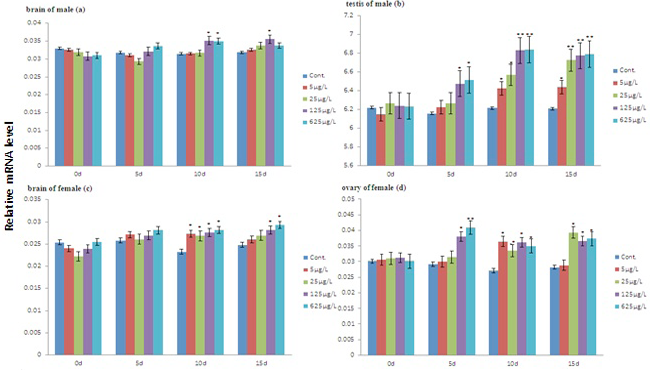
The expression of Cyp19A in the brain and gonads of juvenile carp treated with 0, 5, 25, 125, 625μg/L letrozole for 15 d. Data are presented as means ± S.E. (n=5) and normalized against the mRNA expression of β-actin. The asterisk symbols denote significant differences compared with the control group: *p< 0.05 and **p< 0.01.

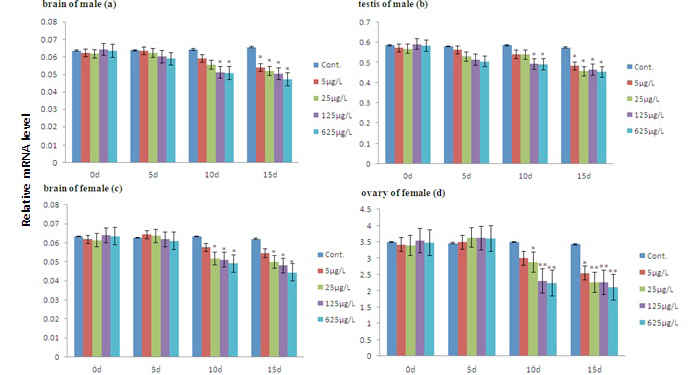
The expression of Cyp19B in the brain and gonads of juvenile carp treated with 0, 5, 25, 125, 625μg/L letrozole for 15 d. Data are presented as means ± S.E. (n=5) and normalized against the mRNA expression of β-actin. The asterisk symbols denote significant differences compared with the control group: *p< 0.05 and **p< 0.01.

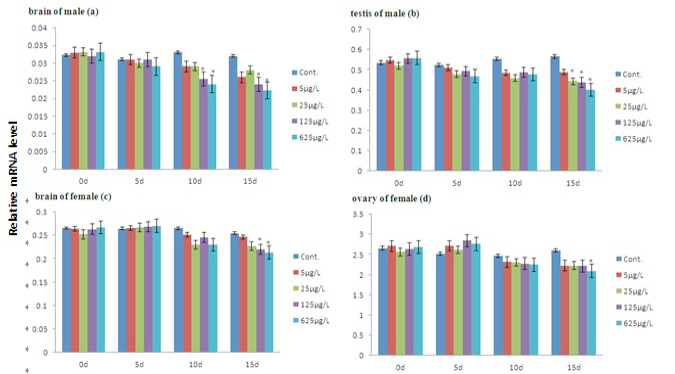
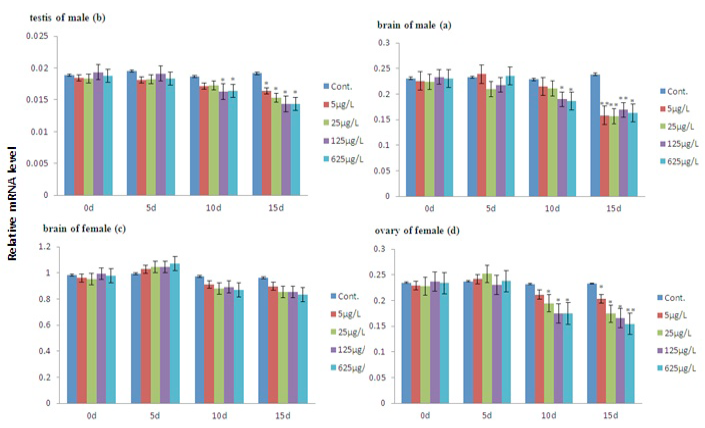
The expression of Foxl2 in the brain and gonads of juvenile carp treated with 0, 5, 25, 125, 625μg/L letrozole for 15 d. Data are presented as means ± S.E. (n=5) and normalized against the mRNA expression of β-actin. The asterisk symbols denote significant differences compared with the control group: *p< 0.05 and **p< 0.01.
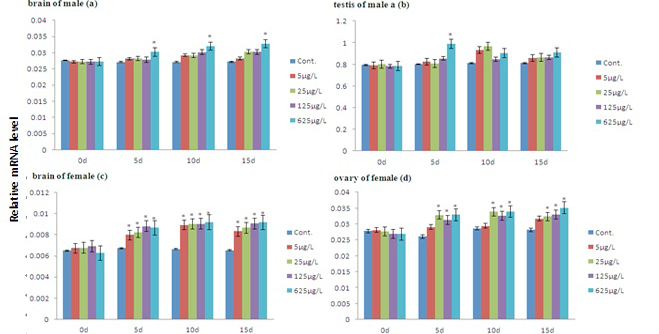
The expression of Dax in the brain and gonads of juvenile carp treated with 0, 5, 25, 125, 625μg/L letrozole for 15 d. Data are presented as means ± S.E. (n=5) and normalized against the mRNA expression of β-actin. The asterisk symbols denote significant differences compared with the control group: *p< 0.05 and **p< 0.01.
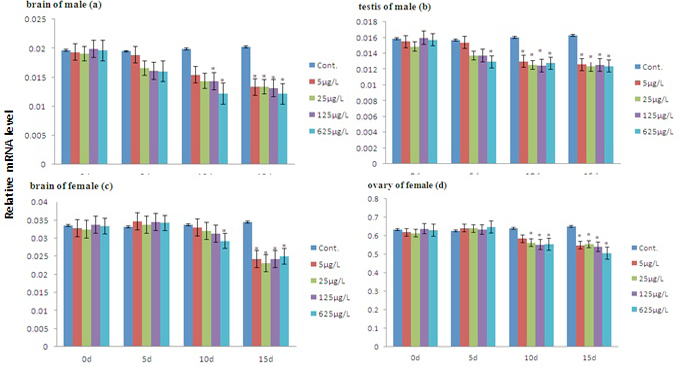
The expression of Erα in the brain and gonads of juvenile carp treated with 0, 5, 25, 125, 625μg/L letrozole for 15 d. Data are presented as means ± S.E. (n=5) and normalized against the mRNA expression of β-actin. The asterisk symbols denote significant differences compared with the control group: *p< 0.05 and **p< 0.01.
The expression of Arα in the brain and gonads of juvenile carp treated with 0, 5, 25, 125, 625μg/L letrozole for 15 d. Data are presented as means ± S.E. (n=5) and normalized against the mRNA expression of β-actin. The asterisk symbols denote significant differences compared with the control group: *p< 0.05 and **p< 0.01.
The expression of Dmrt1 in the brain and gonads of juvenile carp treated with 0, 5, 25, 125, 625 μg/L letrozole for 15 d. Data are presented as means ± S.E. (n=5) and normalized against the mRNA expression of β-actin. The asterisk symbols denote significant differences compared with the control group: *p< 0.05 and **p< 0.01.


