Effects of Grp78-Knockout on the Functionalities of Goat Trophoblast Cells
Effects of Grp78-Knockout on the Functionalities of Goat Trophoblast Cells
Lili Zhao1, Fan Zhao1 and Yaping Jin2*
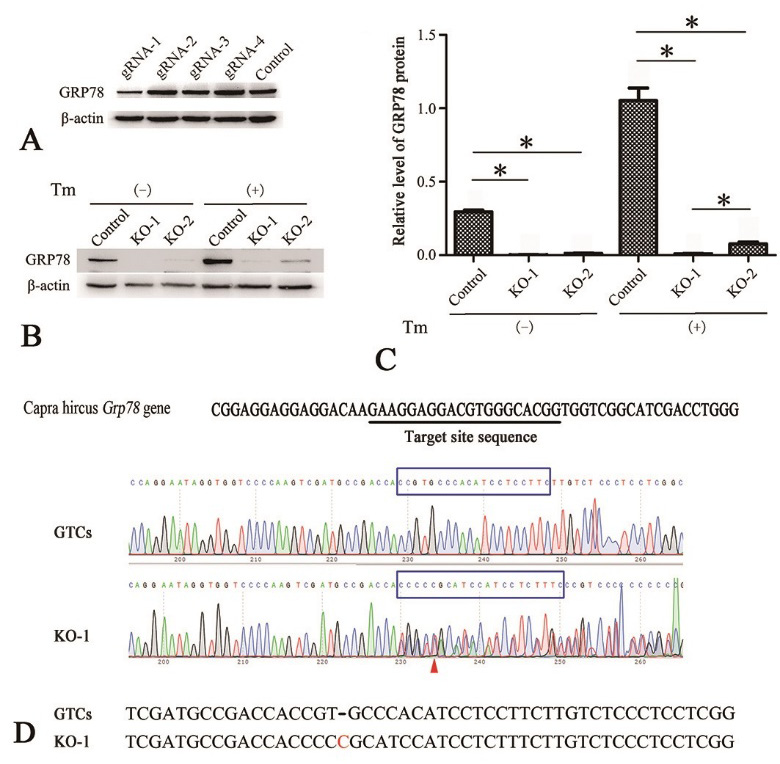
CRISPR/Cas9 induces indels in the Grp78 locus in GTCs. (A) Preliminary determination of the effect of gRNA (1–4) on GRP78 knockout in GTCs. (B-C) The expression of GRP78 in two knockout cell lines, KO-1 and KO-2. Tunicamycin (Tm) was added to the GTCs to stimulate GRP78 protein expression. (D) The position of the gRNA-1 target site and its sequence in the Grp78 locus in Capra hircus (top). Representative Sanger sequencing results of the PCR amplicons from the GTCs and KO-1 cells. The blue box indicates the target site sequence, and the insertion is highlighted in red (middle and bottom). *p<0.05 versus control group.
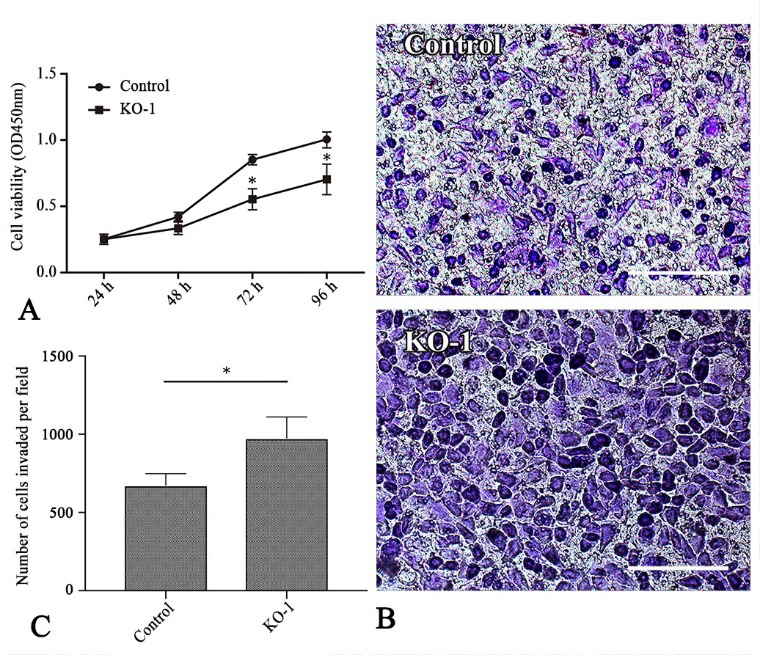
Knockout of Grp78 altered GTC proliferation and invasion. (A) The effect of Grp78 knockout on the proliferation of GTCs. (B-C) The effect of Grp78 knockout on the invasion potential of GTCs. Scale bar = 100 μm. *p<0.05 versus control group.
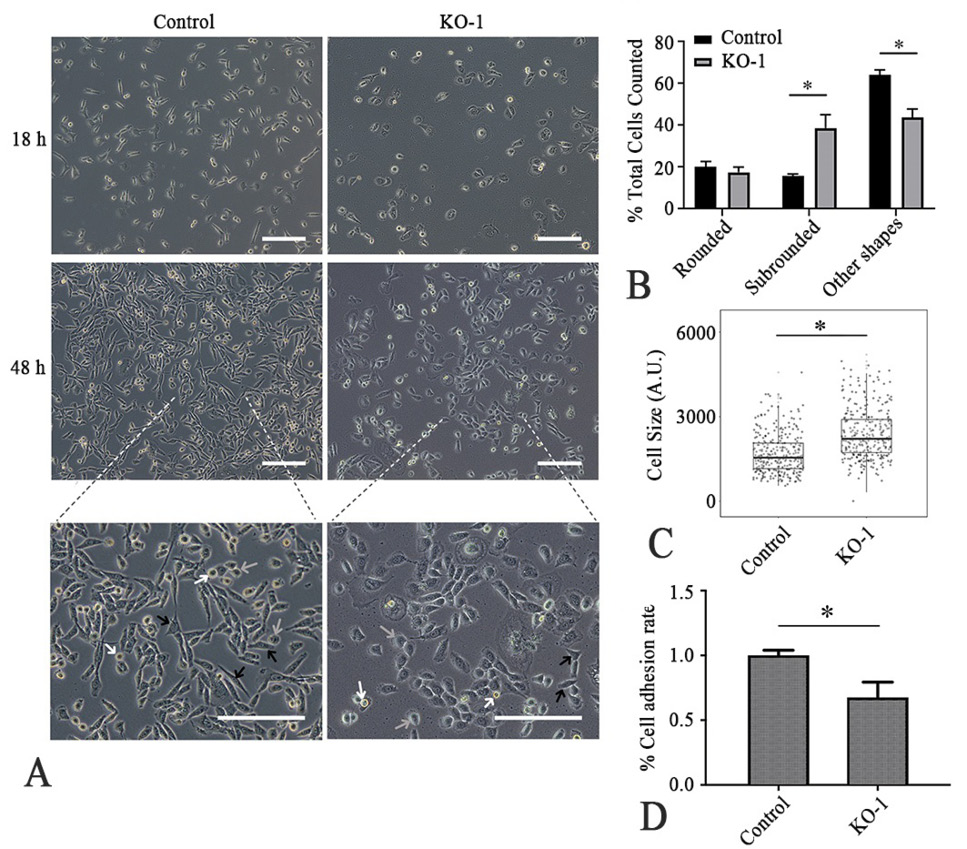
Morphological and adhesion change of GTCs after knockout Grp78. (A) Cells were harvested at 48 hr post-transfection and re-seeded on a 24-well plate. Changes in morphology were analyzed at 18 hr and 48hr after seeding by phase-contrast microcopy. White arrows denote rounded cells, gray arrows denote subrounded cells, and black arrows denote the other shapes cells. (B) Percentage of three types of cells in the total cells observed. (C) Comparison of cell size between KO-1 cells and control cells. (D) The statistical graph of cell adhesion rates. Scale bar = 200 μm.*p<0.05 versus control group.
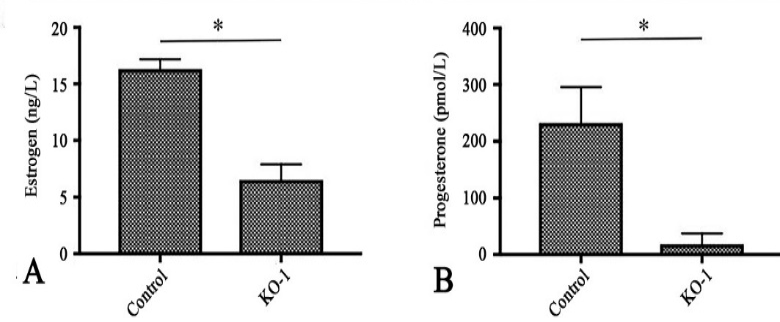
Knockout of Grp78 disturbed the endocrine balance of GTCs. *p < 0.05 versus control group.


