

Effect of Recombinant Glutathione-S-Transferase A3 Protein on the Expression of Host Defense Resistance and Pattern Recognition Receptor in the Thiram Induced Tibial Dyschondroplasia Chicken Erythrocytes


Effect of Recombinant Glutathione-S-Transferase A3 Protein on the Expression of Host Defense Resistance and Pattern Recognition Receptor in the Thiram Induced Tibial Dyschondroplasia Chicken Erythrocytes
Raza Ali Mangi1,2, Ali Raza Jahejo1,2, Afrasyab Khan1,2, Meng-li Qiao1,2, Muhammad Farhan Qadir1,2, Mazhar Hussain Mangi3, Shi-xiong Yang1,2, Xin-yu Han1,2, Sheng Niu1,2, Ding Zhang1,2, Ying Wang1,2 and Wen-xia Tian1,2*
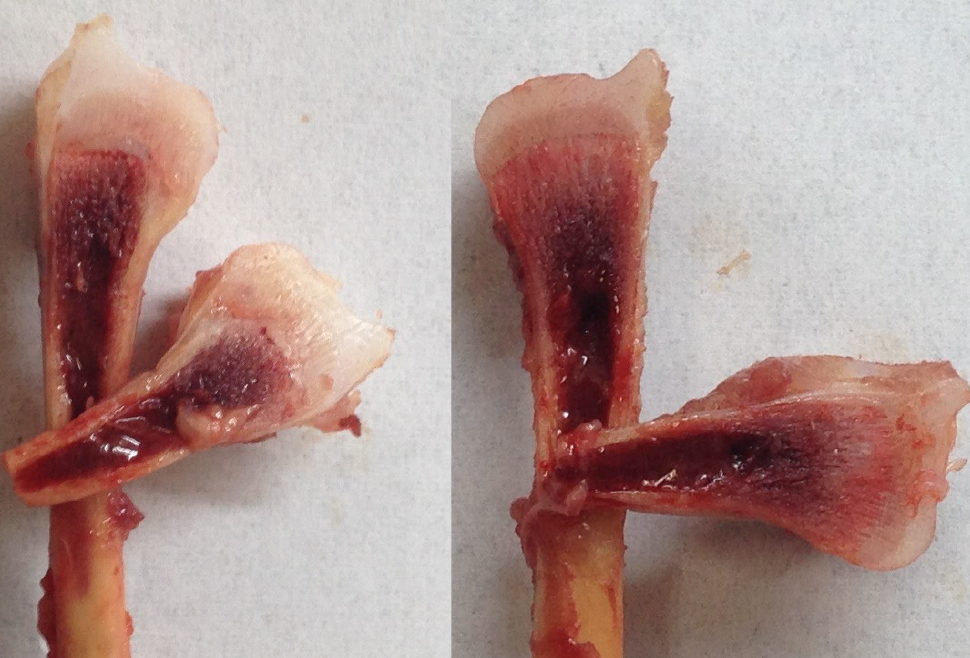
Avian tibial bones with TD showed a significant difference between the control group and treatment group in TD index. Thiram fed induced tibial bones on (left) and control on (right). However, a tibial bone induced by thiram is supplemented, showing TD on the top of proximal growth plate.
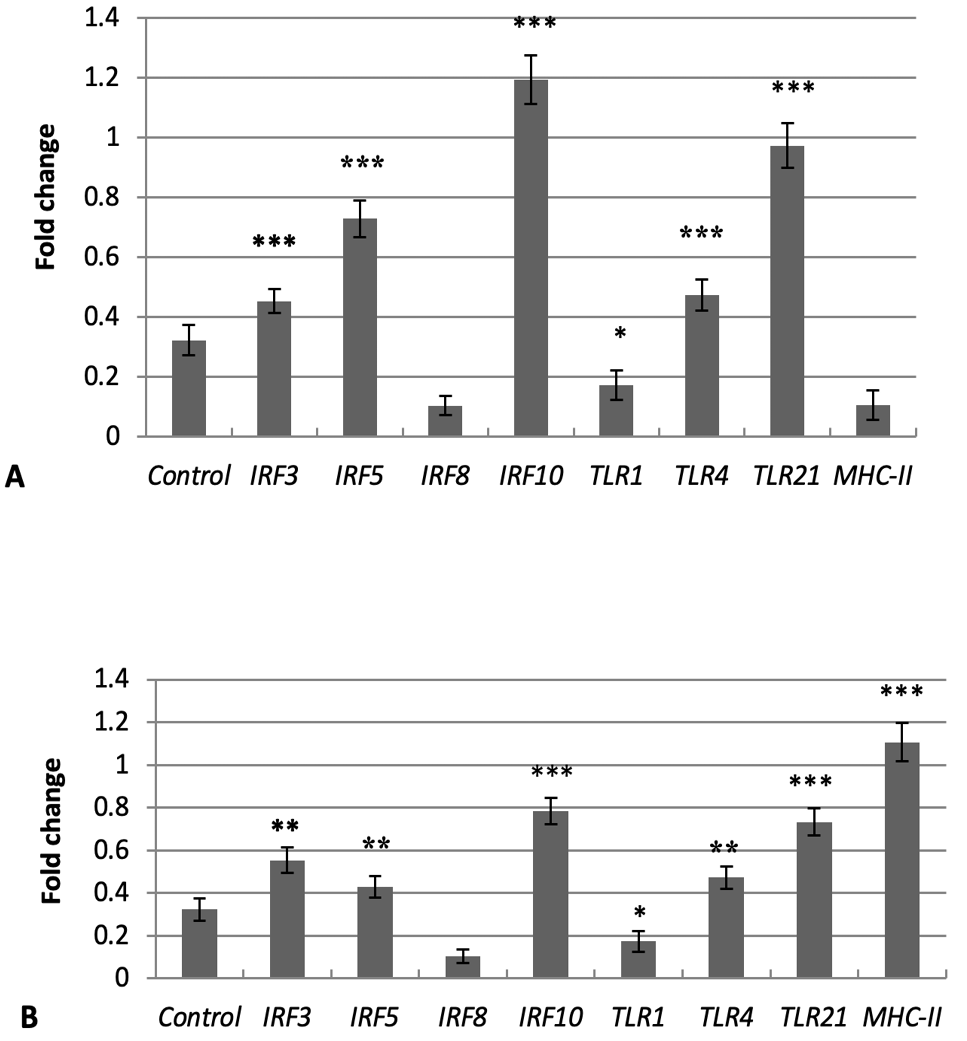
The expression pattern of TLRs and immune related genes TLR1, 4, 21, IRF3, 5, 8, 10, and MHC-II in chicken erythrocyte, induced with thiram on day 6 (A) and day 10 (B). Expression levels of TLRs and immune-related genes were relatively considered to that of 18S rRNA the housekeeping genes via quantitative real-time PCR, IRF10 mRNA in A, MHC-II mRNAs in B was highly significant up-regulated along with P values which were less than 0.05 and SEM (standard error of mean) represented by error bars.

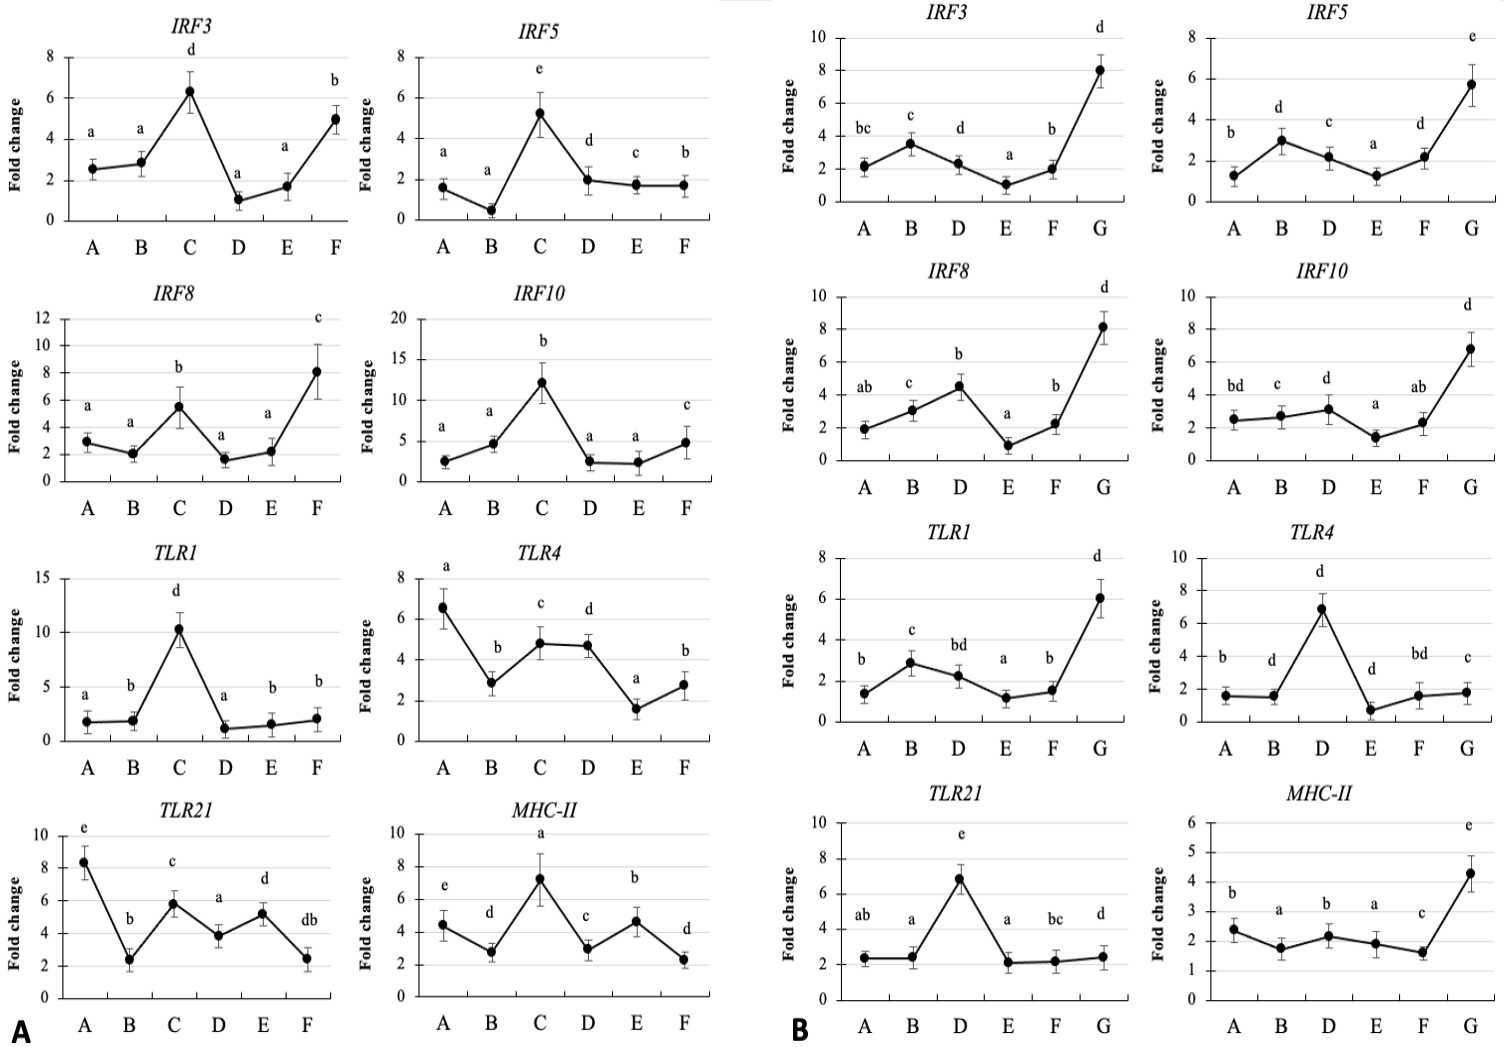
The mRNAs expression pattern of TLRs and immune-related genes TLR1, 4, 21, IRF3, 5, 8, 10, and and MHC-II in chicken erythrocyte, induced with thiram on day 6 (A) and day 10 (B). Basal diet containing groups (A, B and C) treated through 0, 20, 50 μg.kg-1 of recombinant glutathione S transferase A3 (rGSTA3) protein, and thiram-containing diet groups (D, E and F) treated through 0, 20, 50 μg.kg-1 of rGSTA3 protein, respectively. In each chick groups, different lowercase lettering (a–e) point out statistically significant differences (P < 0.05) and SEM (standard error of mean) represented by error bars.


