Effect of Meteorological Factors on the Concentration of Allergenic Pollen Grains in the Atmosphere of Capital Territory Islamabad, Pakistan
Effect of Meteorological Factors on the Concentration of Allergenic Pollen Grains in the Atmosphere of Capital Territory Islamabad, Pakistan
Farooq Jan1*, Abdur Rauf1, Ikramullah Khan1, Muhammad Yasin2, Muhammad Qayash3, Hazrat Wali1, Muhammad Luqman1, Fayaz Asad4 and Muhammad Khalid5
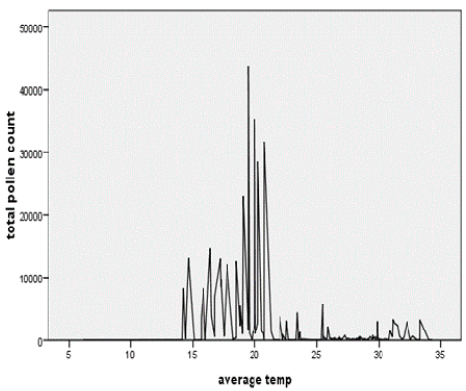
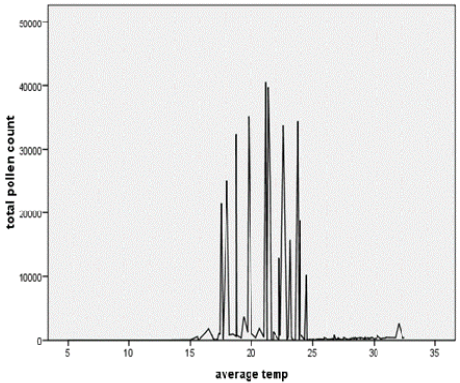
Graphical representation of total pollen count of 2009 and average temperature correlation.
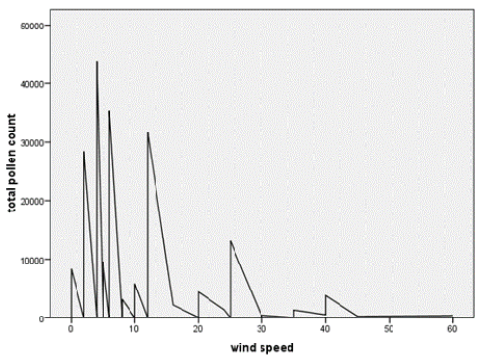
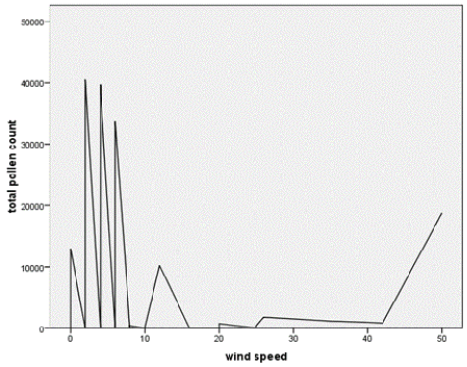
Graphical representation of total pollen count of 2009 and wind speed correlation.
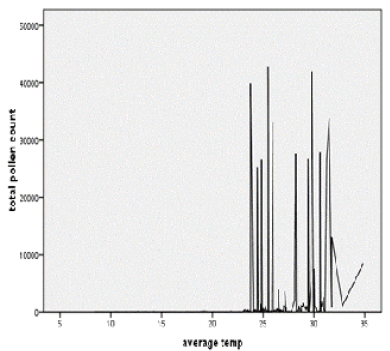
Graphical representation of total pollen count of 2010 average temp correlation.
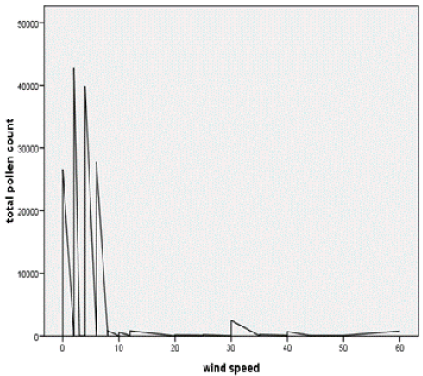
Graphical representation of total pollen count of 2010 and wind speed correlation.
Graphical representation of total pollen count of 2011 and average temp correlation.
Graphical representation of total pollen count of 2011 and wind speed correlation.
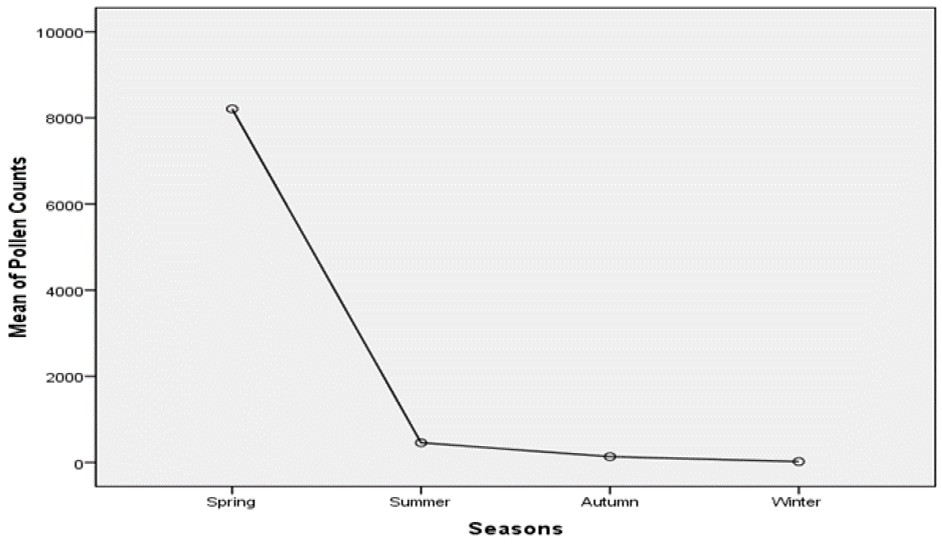
The highest mean pollen count observed in spring seasons than summer, autumn and winter, respectively. The lowest mean pollen count observed in winter seasons. Result shows that mean pollen count totally depend on flowering seasons.
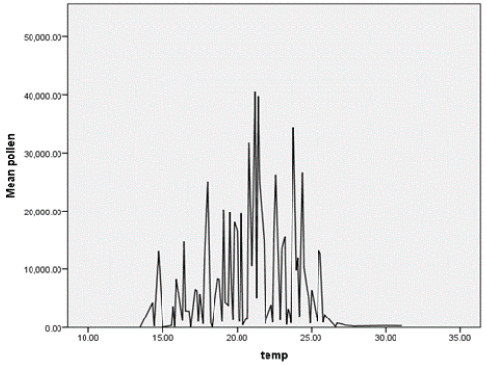
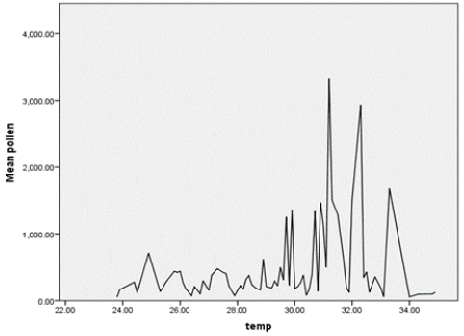
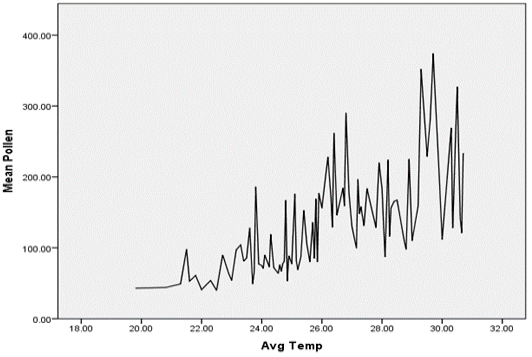
Graphical representation of three years spring mean pollen count of and average temp.
Graphical representation of three years summer means pollen count of and average temp correlation.
Graphical representation of three years autumn means pollen count of and average temp correlation.
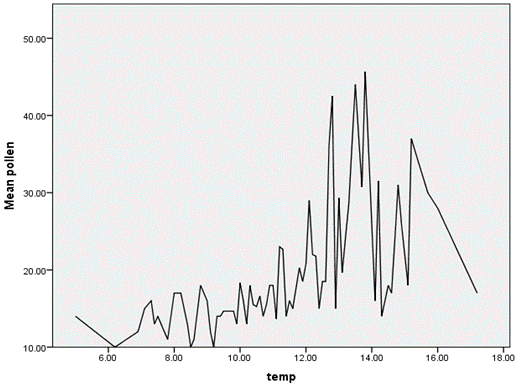
Graphical representations of three years winter mean pollen count of and average temp correlation.
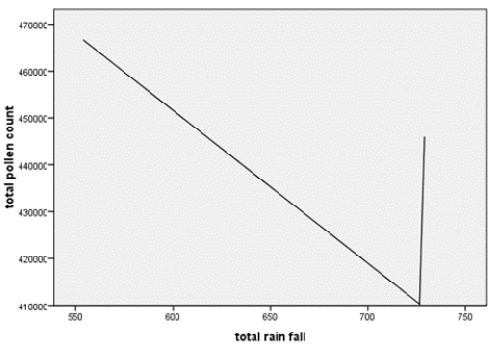
Graphical representation of correlation between total pollen count and total rain fall.


