Effect of Bio-Priming, Organic and Inorganic Nitrogen Sources and Beneficial Microorganisms on Growth and Biochemical Traits of Wheat
Effect of Bio-Priming, Organic and Inorganic Nitrogen Sources and Beneficial Microorganisms on Growth and Biochemical Traits of Wheat
Abid Khan*, Mukhtar Alam and Yousaf Jamal
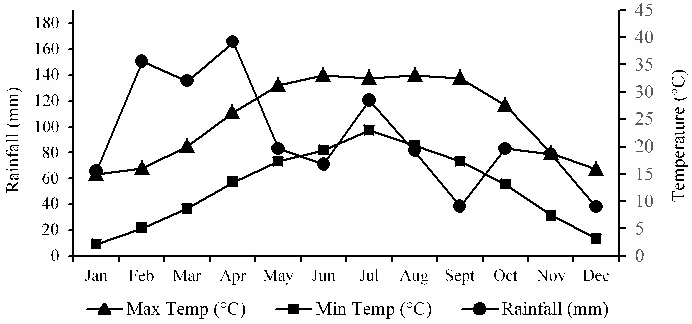
Monthly average temperature and rainfall for 2015.
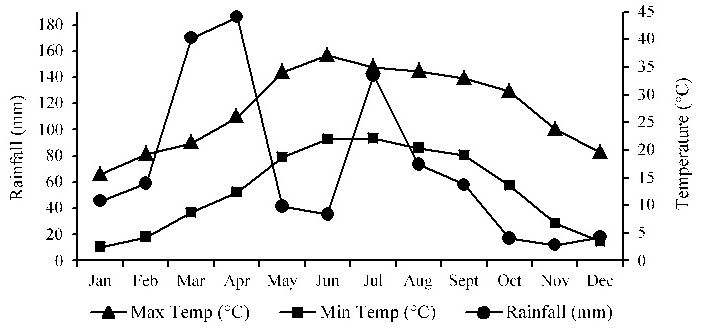
Monthly average temperature and rainfall for 2016.
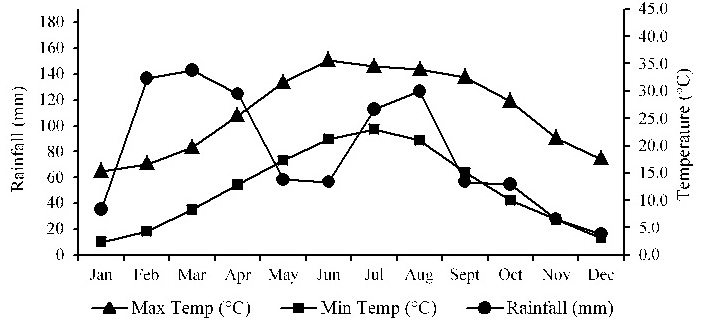
Monthly average temperature and rainfall for 2017.
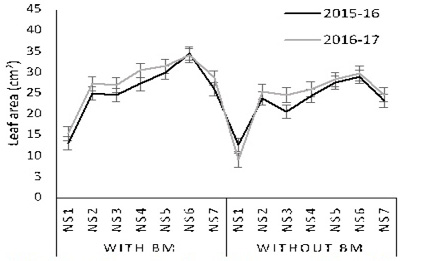
Leaf area (cm2) of wheat as affected by the interaction (Y×NS×BM) over two years.
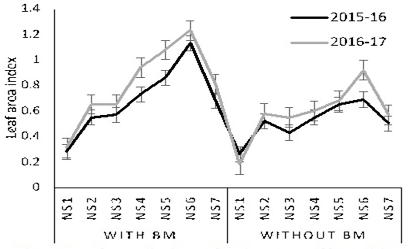
Leaf area index of wheat as affected by the interaction (Y×NS×BM) over two years.
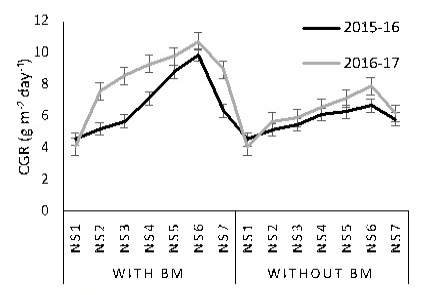
Crop growth rate (g m-2 day-1) of wheat as affected by the interaction (Y×NS×BM) over two years.
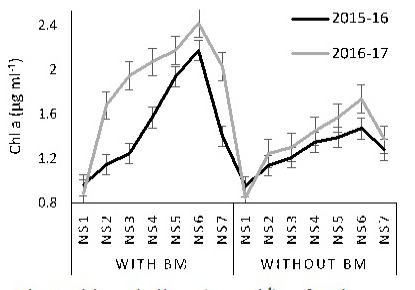
Chlorophyll a (µg ml-1) of wheat as affected by the interaction (Y×NS×BM) over two years.
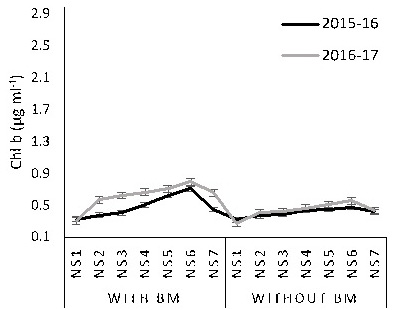
Chlorophyll b (µg ml-1) of wheat as affected by the interaction (Y×NS×BM) over two years.
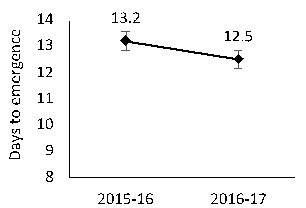
Effect of year on days to emergence.
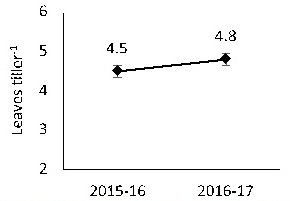
Effect of year on leaves tiller-1.
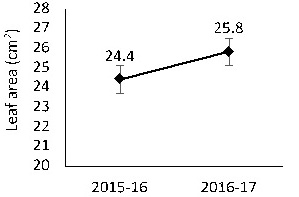
Effect of year on leaf area (cm-2).
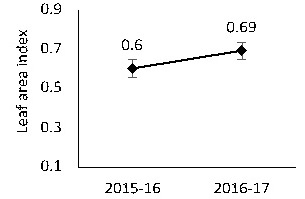
Effect of year on leaf area index.
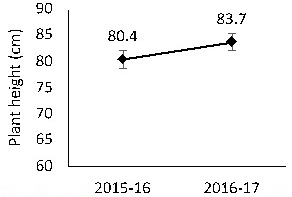
Effect of year on plant height (cm).
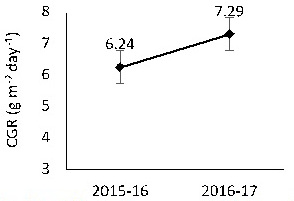
Effect of year on CGR (g m-2 day-1).
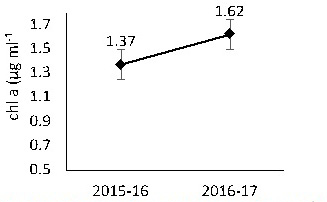
Effect of year on Chl a (µg ml-1).
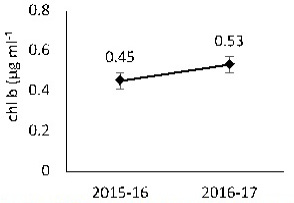
Effect of year on Chl b (µg ml-1).


