
Effect of Berberine on Some Histopathological, Enrofloxacin Residue and Aniti-Diarrheaginic Escherichia coli in Broilar Chicken


Effect of Berberine on Some Histopathological, Enrofloxacin Residue and Aniti-Diarrheaginic Escherichia coli in Broilar Chicken
Raed Hussein Salih Rabee1, Yahya Sabah Abdulameer1, Walla Farhan Obed1, Noor R Abady1, Adnan Mansour Jasim1*, Firas Hussein Albawi1, Mohammed Jasim Jawad2, Ahmed Samir Abukhomra3

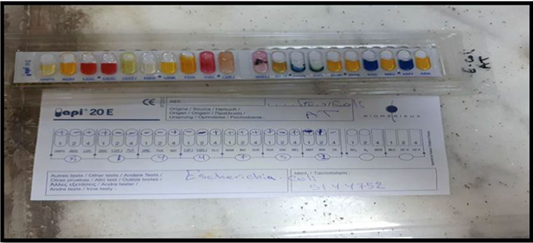
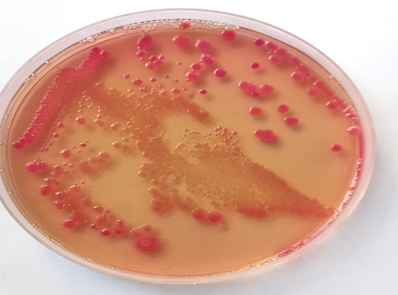
Api 20 E strip shows a specimen diagnosed as E. coli.
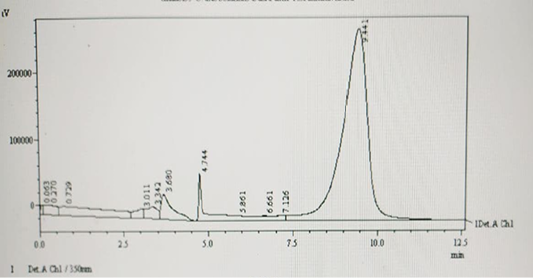
Retention time of enerofloxacin in liver using HPLC.
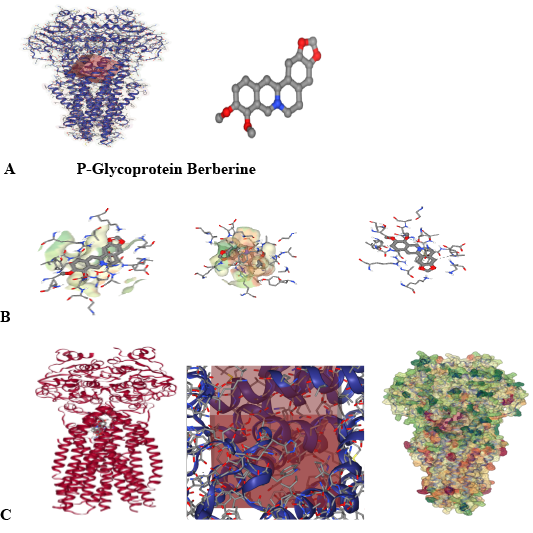
AutoDock Vina was used to obtain the berberine molecular docking solution against the p-glycoprotein target berberine (A) in the ligand binding domain of (B) Ligand interaction diagram of the berberine docking pose (dark green conventional hydrogen bond; light green carbon hydrogen bond; dark pink-pi-pi stacked interaction; light pink pi-alkyl interaction; yellow pi-sulfur interaction); (C) berberine in the active sites defined by the hydrophobic surface and surrounding residues which are labelled and represented as thin grey lines). For clarity, hydrogen atoms are not displayed. (D) illustrates the dynamic character of interactions.
Receptor protein CYP3A4 that berberine and its analogues bind to, the top compounds were chosen, and their ADMET graphs were drawn. Top-hitting chemicals docked with a high binding energy score.
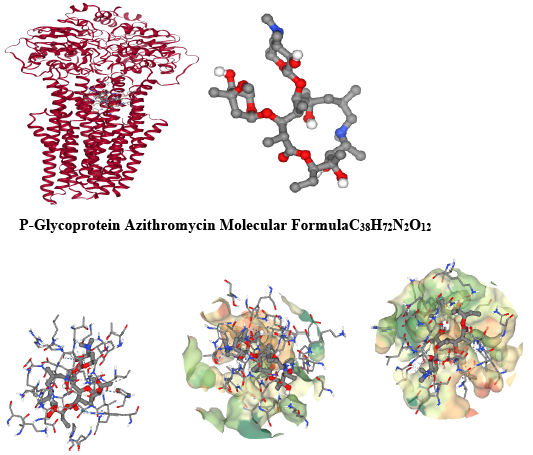
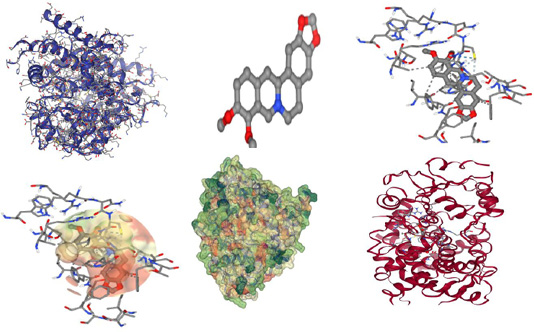
A representative 3D structure of the complex docked target protein molecule (surface p-glycoprotein) with azithromycin is shown in the molecular modeling and docking investigations of both chosen medicines with this protein.

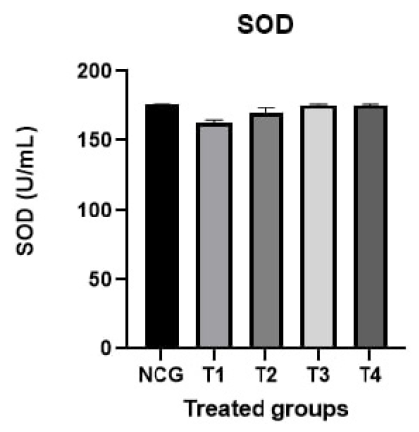
SOD value result from influence of that berberine and enerofloxacin against E. coli infection induced in broiler chicks. NCG: Negative control group T1: Inoculated with 6x10⁸ CFU/ml of E. coli. T2: Inoculated with 6x10⁸ CFU/ml of E. coli treated by enrofloxacin. T3 group: Inoculated with 6x10⁸ CFU/ml of E. coli and were treated with BBR.T4 group: Inoculated with 6x10⁸ CFU/ml of E. coli and were treated with both combination enrofloxacin and BBR

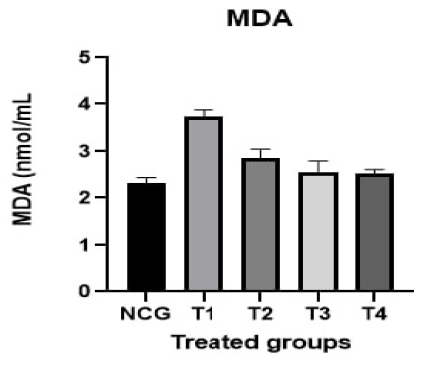
MDA value result from influence of that berberine and enerofloxacin against Ecoli infection induced in poultry chicks. NCG: Negative control group T1: Inoculated with 6x10⁸ CFU/ml of E. coli. T2: Inoculated with 6x10⁸ CFU/ml of E. coli treated by enrofloxacin. T3 group: Inoculated with 6x10⁸ CFU/ml of E. coli and were treated with BBR.T4 group: Inoculated with 6x10⁸ CFU/ml of E. coli and were treated with both combination enrofloxacin and BBR.
SOD value result from influence of that berberine and enerofloxacin against E. coli infection induced in poultry chicks. NCG: Negative control group T1: Inoculated with 6x10⁸ CFU/ml of E. coli. T2: Inoculated with 6x10⁸ CFU/ml of E. coli treated by enrofloxacin. T3 group: Inoculated with 6x10⁸ CFU/ml of E. coli and were treated with BBR.T4 group: Inoculated with 6x10⁸ CFU/ml of E. coli and were treated with both combination enrofloxacin and BBR.
SOD value result from influence of that berberine and enerofloxacin against E. coli infection induced in poultry chicks. NCG: Negative control group T1: Inoculated with 6x10⁸ CFU/ml of E. coli. T2: Inoculated with 6x10⁸ CFU/ml of E. coli treated by enrofloxacin. T3 group: Inoculated with 6x10⁸ CFU/ml of E. coli and were treated with BBR.T4 group: Inoculated with 6x10⁸ CFU/ml of E. coli and were treated with both combination enrofloxacin and BBR.
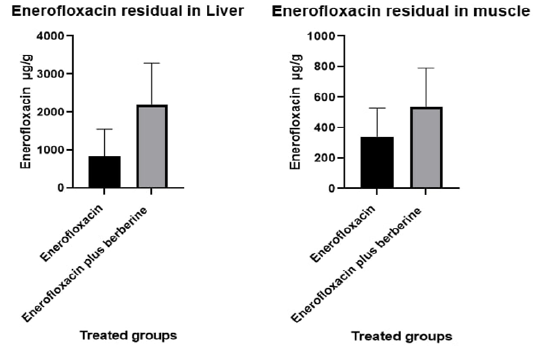
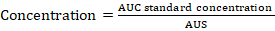
Refer to influence of that berberine on enerofloxacin concentration in liver and thigh muscle of broiler.
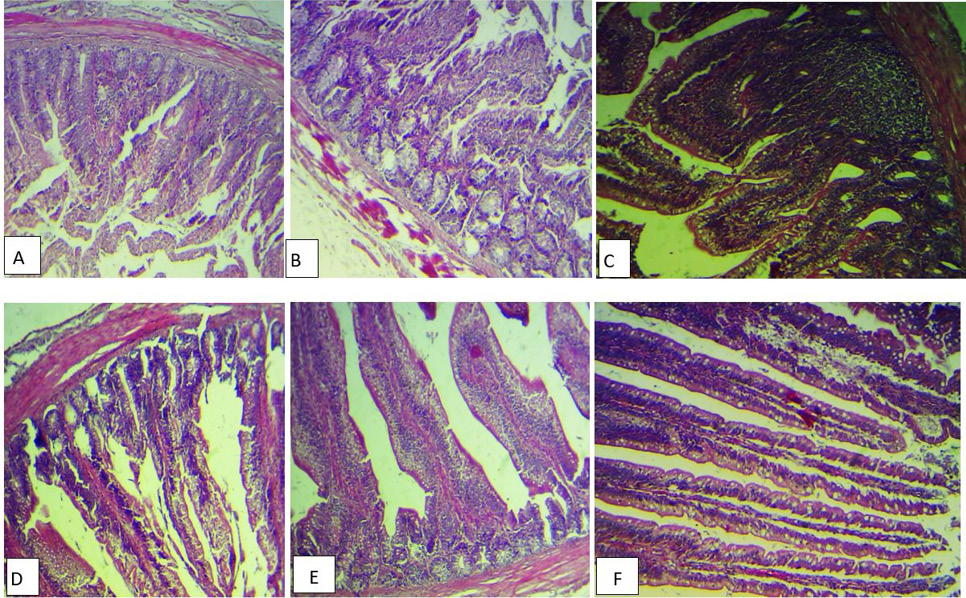
(A) Histopathological section of intestine broiler inoculated with E. coli alone showing congestion of the serosa blood vessels (), sloughing and fusion of intestinal villi (), with inflammatory cells infiltration (H&E stains ,40x). B, Histopathological section of intestine for E. coli group showing atrophy of intestinal villi (), necrosis in some glands (), with intermascularis edema (H&E stains, 40x). C, Histopathological section of intestine inoculated with E. coli and treated with berberine group showing hyperplasia of the intestinal associated lymphoid tissues with increase in goblet cells number (H&E stains, 40x). D, Histopathological section of intestine for E. coli treated with berberine group showing normal intestinal villi with increase in the numbers of the goblet cells (H&E stains, 40x). E, Histopathological section of intestine for E. coli treated with enerofloxacin group showing necrosis of the intestinal villi with inflammatory cells infiltration (H&E stains, 40x). F, Histopathological section of intestine for E. coli treated with berberine and enerofloxacin showing normal intestinal villi with increase in the numbers of the goblet cells (H&E stains, 40x).

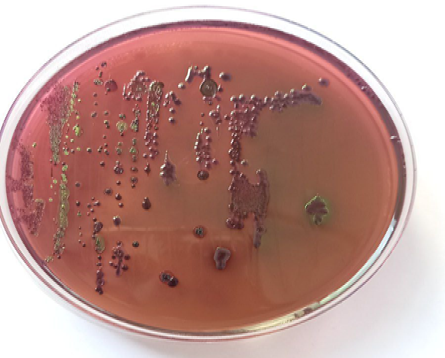
Metallic green luster of E. coli grown on Eosin Methylene Blue (EMB) agar, and gave.

