Effect of Seed Rate and Row Spacings on the Physio-Chemical Traits of Soybean


Research Article
Effect of Seed Rate and Row Spacings on the Physio-Chemical Traits of Soybean
Rasool Bux Kalhoro1, Ghulam Mustafa Laghari2*, Ghulam Hyder Jamro2 and Muhammad Ibrahim Keerio2
1Agriculture Research, Sindh, Pakistan; 2Sindh Agriculture University, Tandojam, Pakistan.
Abstract | Soybean is the most important oilseed andrich protein crop throughout the world.A two- years (2007-2008) fieldtrail was carried out to improve the soybean production under integrated agronomic practices.A three replicated experimental design was conducted, which consisted of three different seed rates (60, 75 and 90 kg ha-1) and row spacings (30cm, 45cm, and 60cm). The results exhibited higher plant 55.24cm and 55.14cm at 45 cm row spacing under the interaction of seed rate 60 and 75 kg ha-1, respectively. Whereas maximum leaf area 190.72 cm2 and 190.0 cm2 were observed from 60cm row spacing. The maximum days to flowering 45.06 and days to maturity 117.28 were recorded at row spacing 60cm with a seed rate of 90 kg ha-1. The row spacing 45 cm with a seed rate of 75 and 90 kg ha-1 showed minimum days 41.67to 41.94 to leghaemoglobium in nodules. While 60cm row spacing with all seed rates had short time 61.61 to 61.72 days to disappearance leghaemoglobium in the nodule.Furthermore, days to nodule formation and the number of nodules plant-1 were not significantly affected by seed rates, except row spacings. The 60cm row spacing had a positive relationship with nodules formation and their number in plant roots. In the case of crop growth rate (gm-2 day-1) and net assimilation rate (gm-2 day-1), both were significantly higher 0.719-0.707 and 17.46 to 17.12 gm-2 day-1 at 45 cm row spacing in combination with different seed rates. The results for biochemical characteristics of soybean plant exhibited maximum nitrogen 0.485%, phosphorus 0.506%andpotassium 0.502%in stem, potassium 1.405%in leaves, potassium 1.753%in pods, protein content 41.87% at seed rate 75 kg ha-1with row spacing 45cm. The primary conclusion is that the cultivation of soybean at a seed rate 75 kg ha-1combined with row spacing 45cm beneficial to achieve maximum yield with high nutritional quality.
Received | November 20, 2020; Accepted | December 16, 2021; Published | January 03, 2022
*Correspondence | Ghulam Mustafa Laghari, Sindh Agriculture University, Tandojam, Pakistan; Email: gmlaghari@sau.edu.pk
Citation | Kalhoro, R.B., G.M. Laghari, G.H. Jamro and M.I. Keerio. 2021. Effect of seed rate and row spacings on the physio-chemical traits of soybean. Pakistan Journal of Agricultural Research, 34(4): 854-860.
DOI | https://dx.doi.org/10.17582/journal.pjar/2021/34.4.854.860
Keywords | Soybean, Seed rate, Row spacing, Yield, Nutrition value
Introduction
The soybean is the world’s most essential oil and protein crop. Protein content in dry weight-assayed seeds ranges from 38 to 42 percent, with oil content ranging from 19 to 22 percent. Saturated fatty acids such as palmitic (12–13 percent) and stearic (3–4%) are found in soybean oil, as are unsaturated fatty acids such as oleic (19–23 percent), linoleic (48–58 percent), and linolenic (5–8%).Sugars, monosaccharides (glucose and fructose), oligosaccharides (sucrose), and oligosaccharides (oligosaccharides) are all found in soybean oil (raffinose and stachyose). Soybean seed contains a lot of minerals (Bellaloui et al., 2015). Farmers frequently use completely different seeding rates and row spacings to maximize yields. To maximize benefit, farmers often use entirely different seeding rates and row spacings. Gaps between yield potential and recorded farm yields are common when different soybean management practices are used (Cassman et al., 2003). Soybean cultivation necessitates detailed data on optimum seeding rates and row spacing.
As the population of soybean plants grows, yield rises until it reaches a straight line at 20 plants per m2 resulting in seed yields enhancement as 4.50 Mg ha-1 (Wichert and Talbert, 1993).According to Cox and Cherney (2011), seed yield increased by 7 precent when seeding rate increased from 32.1 to 42.0 seeds m-2 while it decreased by 4 percent when it decreased from 42.0 to 46.9 seeds m-2.
Aside from seed rate, row spacing is another factor that influences soybean productivity. Due to the vegetative growth of plants, the dry matter can be increased by up to 41% in comparison with the row spacing of 50cm and the row spacing of 100cm (Board et al., 1990). The maximum no of branches per plant accounts for 14-57 percent of total seed yield in rows of 19 cm (Norsworthy and Shipe, 2005).Increased seed yield when soybean crop was sown under the narrower76 cm row spacing. Row spacing that is optimal would increase yield by around 17%. (Taylor, 1982). More radiations intercept with a higher LAI, resulting in a higher photosynthesis rate (Lambert and Lowenberg, 2003). Several other researchers have identified major yield improvements as a result of properrow spacing (Holshouser and Whittaker, 2002). Due to a lack of interest on the part of researchers in the study area of Tando Jam (Sindh), data on soybean cultivation is limited. In the present study, the objective was to determine the effect of seed rate and row spacing on physio-chemical characteristics of soybean yields in order to establish production practicestechnology package know-how for improved crop management.
Materials and Methods
Study site, climate and soil
Tando Jam (25.4299° N, 68.5426° E) is located in Sindh’s lower region, just 20 kilometres from Hyderabad. Annual rainfall falls less of potential evapotranspiration, preventing crop production without irrigation. The most of rain falls during the summer monsoon season, due to occasional westerly waves that reach the country’s southern regions.Total annual rainfall ranges from 145 to 155 mm.Because of the Arabian Sea, the study region is slightly cooler and more humid (Kazi et al., 2016). The soil has a clay loam texture, low organic matter (0.54-0.58 percent) and high exchangeable potassium (165 mg kg-1) but low nitrogen (70-30 percent) and phosphorus (3.00-3.51 mg kg-1). Table 1 lists the basic soil characteristics.
Experimental design and management practices
A two-year (2007-08) field experiments were conducted to improve soybean production under integrated agronomic practices. There was three replicated experimental design, which consisted of three different seed rates (60, 75 and 90kg ha-1), row spacings (30 , 45 and 60cm).Plot size was 3 x 5 m2 = 15 m2.One deep ploughing followed by shallow ploughing and levelling, after soaking dose when soils come into condition cross ploughing followed by plankingapplied. The soybean variety NARC-I was sown on 15th May of each year. The sowing method was drilling, fertilizer ½ bags of DAP per acre at sowing time. First irrigation 26 days after sowing. Plant protection measures, particularly insect pest control by insecticides,were according to local farmer practices. The beans were harvested when the leaves have fallen, and the lowest pods have turned yellowish and dried and seed moisture content was dropped to 12-13%.
Table 1: Basic physical and chemical properties of soil at different depths.
|
Depth (cm) |
BD (gcm-3) |
Particle fraction (%) |
Soil texture (USDA) |
pH value |
θs (cm3cm-3) |
θfc (cm3cm-3) |
θwp (cm3cm-3) |
Ks (cmd-1) |
||
|
Sand |
Silt |
Clay |
||||||||
|
0~20 |
1.43 |
33.2 |
46.8 |
20.3 |
Clay loamy |
7.5 |
0.48 |
0.270 |
0.126 |
16.28 |
|
20~40 |
1.44 |
33.4 |
45.8 |
19.3 |
Clay loamy |
7.5 |
0.38 |
0.291 |
0.133 |
14.89 |
|
40~60 |
1.32 |
30.6 |
44.5 |
24.9 |
Loamy |
7.6 |
0.35 |
0.292 |
0.144 |
15.23 |
|
60~80 |
1.52 |
35.4 |
48.4 |
16.2 |
Loamy |
7.6 |
0.37 |
0.261 |
0.112 |
6.13 |
|
80~100 |
1.52 |
37.4 |
46.4 |
16.2 |
Loamy |
7.6 |
0.337 |
0.263 |
0.113 |
6.12 |
Note: BD: bulk density; θs: soil saturated water content (0 kPa); θfc: SWC at field capacity (33.34 kPa); θwp: SWC at permanent wilting point (1500 kPa); Ks: saturated hydraulic conductivity.
Data collection and statistical analysis
Days to flowering were calculated using various dates of physiological maturity and sowing, while days to maturity were calculated using various dates of physiological maturity and sowing. When root red colour nodules emerged, the days to leghaemoglobium were counted. When the colour of the nodules changed to green, the days to disappearance of leghaemoglobium were counted.Equations 1-3 were used to quantify and calculate leaf area (cm-2), crop growth rate (g-2 day-1) and net assimilation rate (NAR, g-2 day-1) (Sagoo, 2012). The Kjeldahl method was used to calculate total nitrogen concentrations in the plant. The phosphorus and potassium contents of the plant were calculated using the Cavell, 1955, process, which was also used by Bellaloui et al. (2015).Toevaluate the effect of different seed rates and row spacings on soybean growth and yield, all collected data were statistically analyzed using Statistix 8.1 software. At the 0.05 probability level, the means of each treatment were compared using the least significant difference (LSD) test (Leghari et al., 2019).
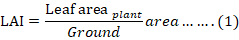
Where;
LAI = Leaf area index.
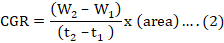
Where;
CGR: Crop growth rate; W1 and W2: Dry weight; t1 and t2: Time.


Where;
Net assimilation rate, TDM: Total dry matter; LAD: Total leaf area duration; LAI1: Leaf area index at initial developmental growth stage; LAI2: Leaf area index at final growth (maturation) stage; t1: Time corresponding to initial developmental stage; t2: Time corresponding to maturation stage.
Results and Discussion
Effect of seed rate and row spacings on the physio-chemical traits of soybean
The optimal seed rate and row spacing are crucially important to obtain maximum soybean productivity. Similary researchers also stated that dense planting adversely affects the yield and quality of soybean (Edwards and Purcell, 2005) by increasing the plant’s competition for water, nutrients, light, space, etc. Therefore, highly increased seed rate and row spacing both have a negative impact on the physicochemical characteristics of soybean.
Physiological traits of soybean
Effect of seed rate and row spacing on the physiological traits of soybeans shown in Figure 1. The research findings indicated that seed rate and row spacing both exhibited various soybean traits. The enhanced height of plants 55.24 cm and 55.14 cm was observed at 45 cm row spacing under the interaction of seed rates 60 and 75 kg ha-1, respectively. Enhanced leaf area 190.72 cm2 and190.0 cm2 observed from 60 cm row spacing. The maximum days to flowering 45.06 and days to maturity 117.28 were recorded at row spacing 60 cm with a seed rate of 90 kg ha-1. The row spacing 45 cm with a seed rate of 75 and 90 kg ha-1showed highly positive response to days 41.67-41.94 to leghaemoglobium in nodules. While 60 cm row spacing with all seed rates had a short time of 61.61 to 61.72 days to disappearance leghaemoglobium in the nodule our findings were confirmed with Holshouser and Whittaker (2002).
Furthermore, days to nodule formation and the number of nodules plant-1 were not significantly affected by seed rates, except row spacing. The 60 cm row spacing had a positive relationship with nodules formation and their number in plant roots. In the case of crop growth rate (gm-2 day-1) and net assimilation rate (gm-2 day-1), both were significantly higher 0.719-0.707 gm-2 day-1 and 17.46-17.12 gm-2 day-1 at 45 cm row spacing in combination with different seed rates. Thus,dry matter and grain yield were increased as well. However, the effect of the seed rate was not obvious. The results of this study agree with previous research of Holshouser and Whittaker (2002), Harder et al. (2007) they reported that narrow row spacing about 76cm improves plant growth over wide row planted soybeans with over 4,45,000 plants ha-1 compared to highly less seeding at the same row spacing.
Our above findings confirmed by researchers tey stated that plant productivity was influenced by increased population density when the seed rate was increased excessively (Ball et al., 2000). Optimum row spacing increases the light interception of crop about 95% compared to 100 cm of row spacing (Weber et al., 1966; Oplinger and Philbrook, 1992; Cox et al., 2012).
Bio-chemical traits of soybean
The effect of the seed rate and the row spacing on the physiologicaltraits of soybean is shown in Figure 2. The results showed that maximum nitrogen 0.485%in the stem, phosphorus0.506%, kinetic 0.502% in stem,kinetic 1.405% in leaves and kinetic 1.753% in pods, protein content41.87% applied seed rate 75 kg ha-1 at row spacing 45cm. Whereas,thehigher concentration of P in leaves was 1.318% at seed rate 60 kg ha-1in combination with row spacing 45cm. Furthermore, the lowoil content of 18.27% was observed at 60 kg ha-1seed with row spacing of 30cm. In the case of NPK concentrations and protein content, the low nitrogen 0.405% and Phosphorus 0.407% in the stem, phosphorus 1.202% in leaves, Kinetic 1.308% in leaves, protein 32.199% at 60 kg ha-1seed rate with row spacing 30cm. While K (%) in pods was 1.668% at 90 kg ha-1 seed ratewith row spacing 30cm. Results indicate that seed rate and row spacing hasa major effect on the NPK concentrations in stem and leaves, protein, and oil content. These results are in line with Bellaloui et al. (2015) reported that planting soybean seeds at variable rates and different row spacing result in different plant responses. Optimum seed rate and row spacing enhanced seed protein and P concentrations.The increases in protein concentrations could be due to decreases in carbohydrates (Wilcox and Shibles, 2001) and variation of biosynthesis of oil could be due to higher enzymic activity after increased nutrients absorption of the plant from the soil, light
interception, early canopy closure (Bellaloui et al., 2014; Andrade et al., 2002; Taylor et al., 1982).
Conclusions and Recommendations
This research demonstrated a different physio-chemical response soybean to variable seed rate and row spacings. Excessive and seed rate and highly increased and reduced row spacings had an adverse effect on the growth and nutrition value of soybean. Cultivation of soybean at a seed rate of 75 kg ha-1 in combination with the spacing 45 cm row to rowwould be beneficial to achieve maximum oil yield and protein concentrations. The biochemical response of soybean was more obvious than physiological to different combinations of seed rate and the row spacing. The seed rate alone had no significant effect on both plants’ physiological and biochemical characteristics. The findings of this study provide insights into the improvement of the production technology of soybean.
Novelty Statement
Keeping in view the importance of edible oil production, production technology of soybean i.e., sowing rate and roe spacing traits was determined in manuscript.
Author’s Contribution
Rasool Bux Kalhoro: Main Author and wrote the manuscript.
Ghulam Mustafa Laghari: Guided in research work.
Ghulam Hyder Jamro and Muhammad Ibrahim Keerio: Co-supervisor, guided and Did research work.
Conflict of interest
The authors have declared no conflict of interest.
References
Andrade, F.H., P. Calvino, A. Cirilo and P. Barbieri. 2002. Yield responses to narrow rows depend on increased radiation interception. J. Agron., 94: 975–980. https://doi.org/10.2134/agronj2002.0975
Ball, R.A., L.C. Purcell and E.D. Vories. 2000. Short season soybean yield compensation in response to population and water regime. Crop Sci., 40:1070-1078. https://doi.org/10.2135/cropsci2000.4041070x
Bellaloui, N., A. Mengistu, E.R. Walker and L.D. Young. 2014. Soybean seed composition as affected by seeding rates and row spacing. Crop Sci., 54: 1782–1795. https://doi.org/10.2135/cropsci2013.07.0463
Bellaloui, N., H.A. Bruns, H.K. Abbas, A. Mengistu, D.K. Fisher and K.N. Reddy. 2015. Effects of row-type, row-spacing, seeding rate, soil-type, and cultivar differences on soybean seed nutrition under us Mississippi Delta conditions. PloS one, 10(6): e0129913. https://doi.org/10.1371/journal.pone.0129913
Board, J.E., B.G. Harville and A.M. Saxton. 1990. Branch dry weight in relation to yield increases in narrow-row soybean. J. Agron., 82:540-544. https://doi.org/10.2134/agronj1990.00021962008200030021x
Cassman, K.G., A.R. Dobermann, D.T. Walters and H. Yang. 2003. Meeting cereal demand while protecting natural resources and improving environmental quality. Annu. Rev. Environ. Resour., 28:315-358. https://doi.org/10.1146/annurev.energy.28.040202.122858
Cavell, A.J. 1955. The colorimetric determination of phosphorus in plant materials. J. Sci. Food Agric., 6: 479–480. https://doi.org/10.1002/jsfa.2740060814
Cox, W.J., J. Orlowski, A. Ditommaso and W. Knoblauch. 2012. Planting soybean with a grain drill inconsistently increases yield and profit. Agron. J., 104: 1065-1073. https://doi.org/10.2134/agronj2012.0109
De Bruin, J.L. and P. Pedersen. 2008. Effect of row spacing and seeding rate on soybean yield. J. Agron., 100:704-710. https://doi.org/10.2134/agronj2007.0106
Edwards J.T. and L.C. Purcell. 2005. Soybean yield and biomass responses to increasing plant population among diverse maturiygroups: I. Agronomic Characteristics. Crop Sci., 45:1770-1777. https://doi.org/10.2135/cropsci2004.0564
Harder, D.B., C.L. Sprague and K.A. Renner. 2007. Effect of soybean row width and population on weed, crop yield, and economic return. Weed Technol., 21:744–752. https://doi.org/10.1614/WT-06-122.1
Holshouser, D.L. and J.P. Whittaker. 2002. Plant population and row-spacing effects on early soybean production systems in the Mid-Atlantic USA. J. Agron., 94:603-611. https://doi.org/10.2134/agronj2002.6030
Lambert, D.M. and J. Lowenberg-DeBoer. 2003. Economic analysis of row spacing for corn and soybean. J. Agron., 95:564-573. https://doi.org/10.2134/agronj2003.5640
Leghari, S.J., K. Hu, H.Liang and Y. Wei. 2019. Modeling water and nitrogen balance of different cropping systems in the North China Plain. Agronomy, 9(11): 696. https://doi.org/10.3390/agronomy9110696
Norsworthy, J.K. and E.R. Shipe. 2005. Effect of row spacing and soybean genotype on mainstem and branch yield. J. Agron., 97:919-923. https://doi.org/10.2134/agronj2004.0271
Oplinger, E.S. and B.D. Philbrook. 1992. Soybean planting date, row width, and seeding rate response in three tillage systems. J. Prod. Agric., 5:94-99. https://doi.org/10.2134/jpa1992.0094
Sagoo, A.G. 2012. Integration of management techniques to develop resource conservation technology for autumn sugarcane (Saccharum officinarum L.) grown on different soils under arid conditions (Doctoral dissertation, Gomal University, Dera Ismail Khan). Available online at http://prr.hec.gov.pk/jspui/handle/123456789/1719.
Taylor, H.M., W.K. Mason, A.T.P. Bennie and H.R. Rowse. 1982. Responses of soybeans to two row spacings and two soil water levels. I. An analysis of biomass accumulation, canopy development, solar radiation interception and components of seed yield. Field Crop Res., 5: 1–14.
Weber, C.R., R.M. Shibles and D.F. Byth. 1966. Effect of plant population and row spacing on soybean development and production. J. Agron., 58: 99-102. https://doi.org/10.2134/agronj1966.00021962005800010034x
Wichert, R.A. and R.E. Talbert. 1993. Soybean [Glycine max (L.)] Response to lactofen. Weed Sci., 41:23-27. https://doi.org/10.1017/S0043174500057520
Wilcox, J.R and R.M. Shibles. 2001. Interrelationships among seed quality attributes in soybean. Crop Sci., 41: 11–14. https://doi.org/10.2135/cropsci2001.41111x
To share on other social networks, click on any share button. What are these?