

Effect of Metformin on P53 and its Interacting Partners in Breast Cancer Cell Line MCF-7


Effect of Metformin on P53 and its Interacting Partners in Breast Cancer Cell Line MCF-7
Mehroze Amin1, Afifa Yaqub1, Qindeel Fatima1, Rabail Hassan Toor1,3 and Abdul Rauf Shakoori1,2*
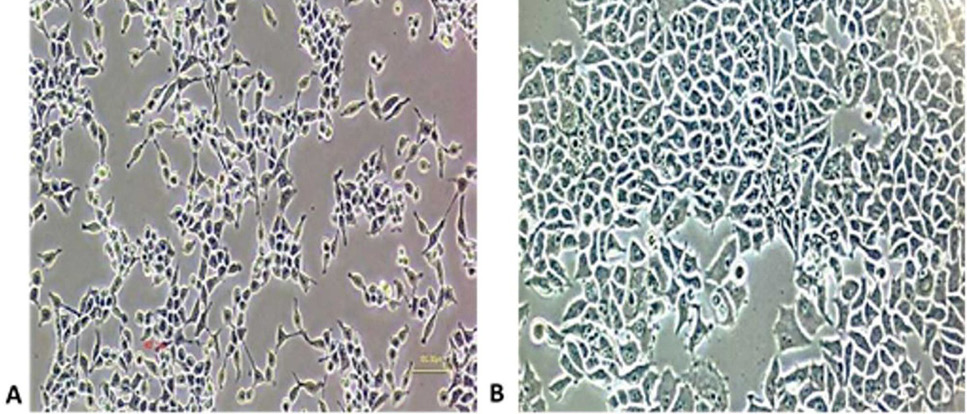
Morphology of human embryonic kidney cell line HEK-293 (A) and human breast cancer cell line MCF-7. (B) Both cell lines showed normal epithelial-like morphology. The cells are 60 – 70 % confluence at the time images were taken under 100X magnification.
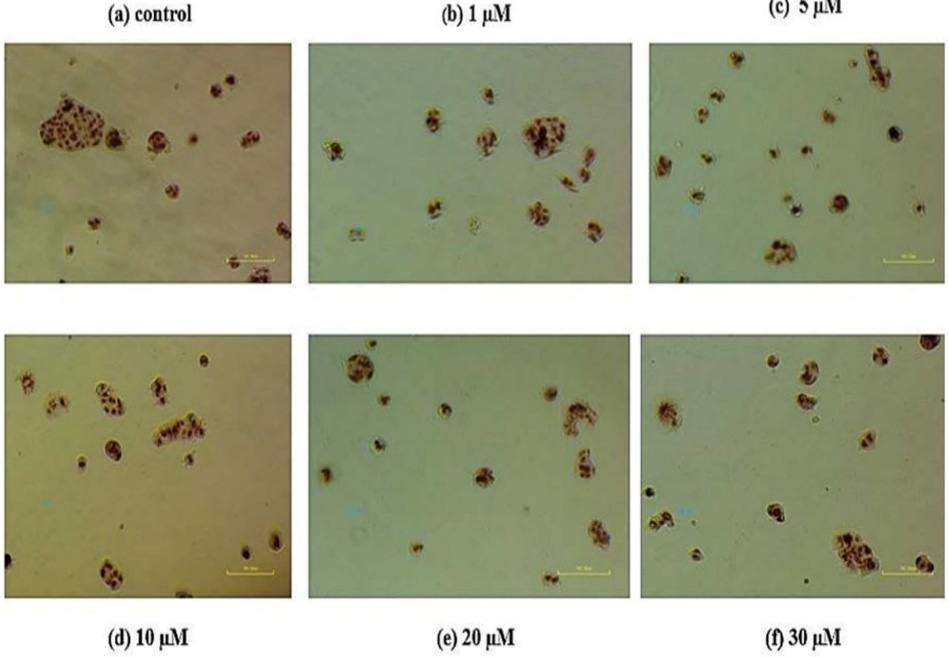
MCF-7 cells stained with neutral red after treatment with different concentrations of metformin (1, 5, 10, 20 and 30 µM) for 48h. Compared with control, cells treated with higher concentrations of metformin appear to be stressed with smaller size and reduced numbers.
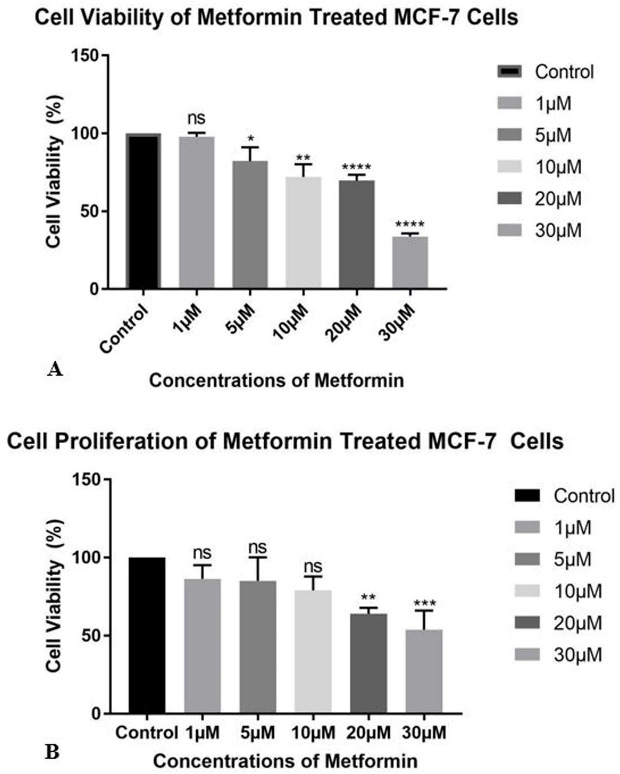
Effect of different concentrations of metformin on cell viability (neutral red assay) and cell proliferation (BrdU assay) of breast cancer cell line MCF-7. Significant reduction was observed in these parameters at higher concentrations of metformin. ns= not significant, * = P≤0.05, ** = P≤0.01, **** = P≤0.0001.

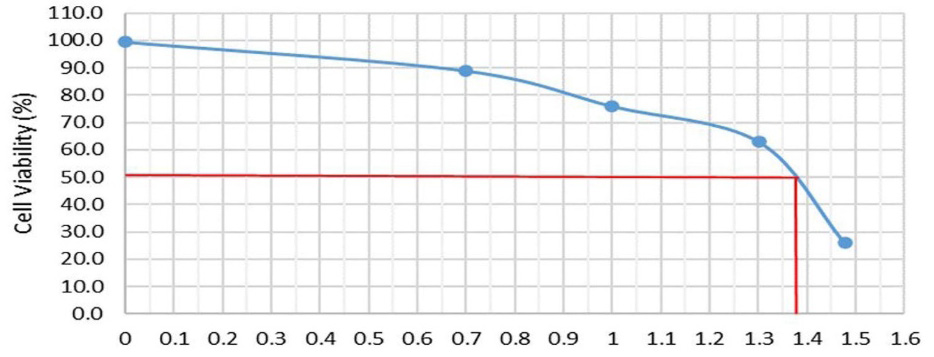
A dose-dependent logarithmic curve for metformin treated MCF-7 cells. The log values for the concentrations of metformin were calculated and plotted against percentage cell viabilities. Antilog value corresponding to 50 % cell viability (EC50 of metformin) for MCF-7 cell line was 22.75 µM.

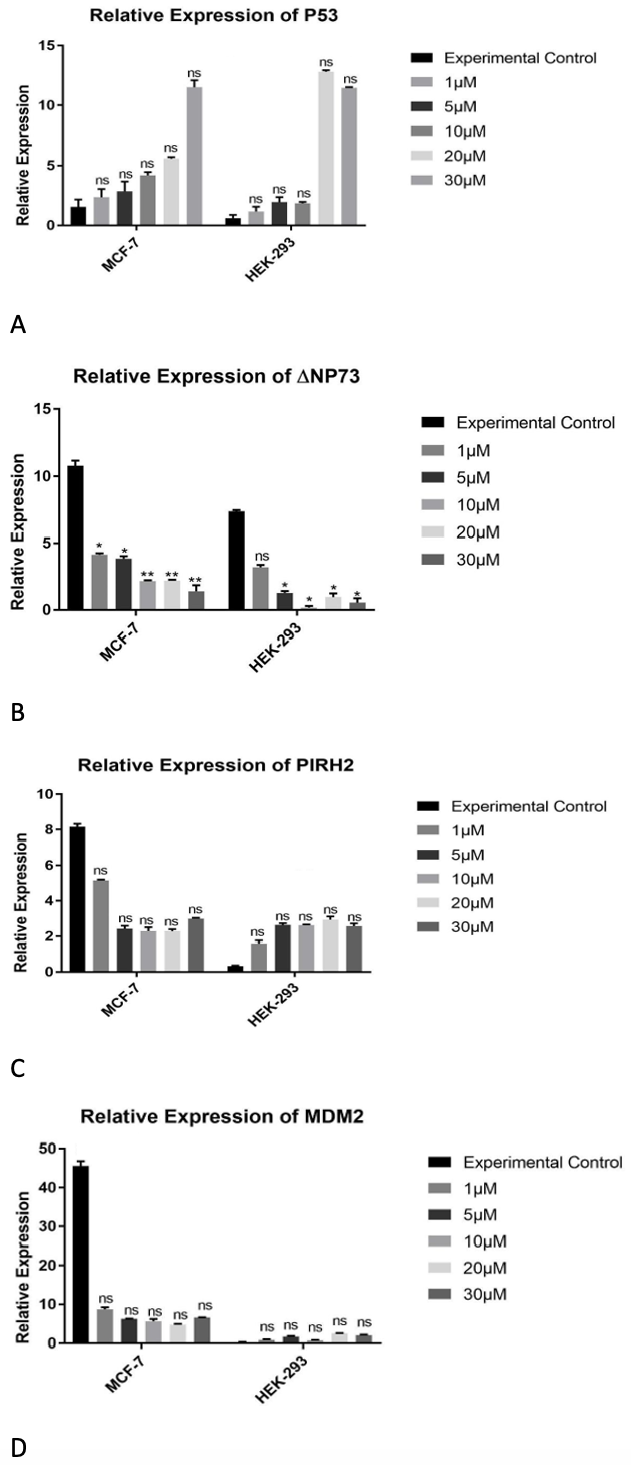
Effect of metformin on expression of P53, ΔNp73, PIRH and MDM2 in metformin treated MCF-7 and HEK-293 cells. Compared to control, dose-dependent upregulation was observed in p53, and downregulation in expression of other genes in MCF-7 and HEK-293 cell lines.

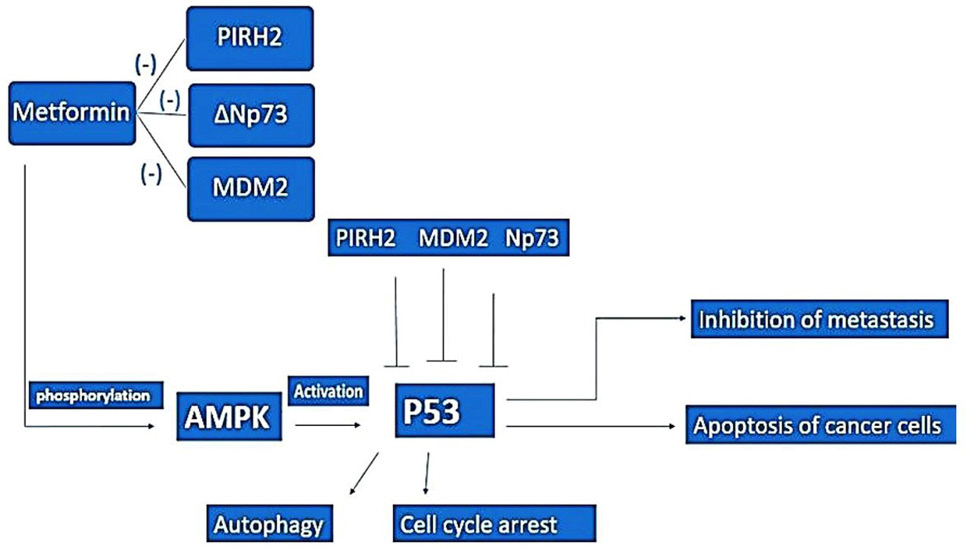
Schematic representation of antitumor activity of metformin.


