
Drought Risk Assessment: A Case Study in Punjab, Pakistan


Drought Risk Assessment: A Case Study in Punjab, Pakistan
Muhammad Amin1, Aftab Ahmad Khan2, Abida Perveen1, Zareen Rauf1, Sher Shah Hassan2*, Muhammad Arif Goheer2 and Muhammad Ijaz2
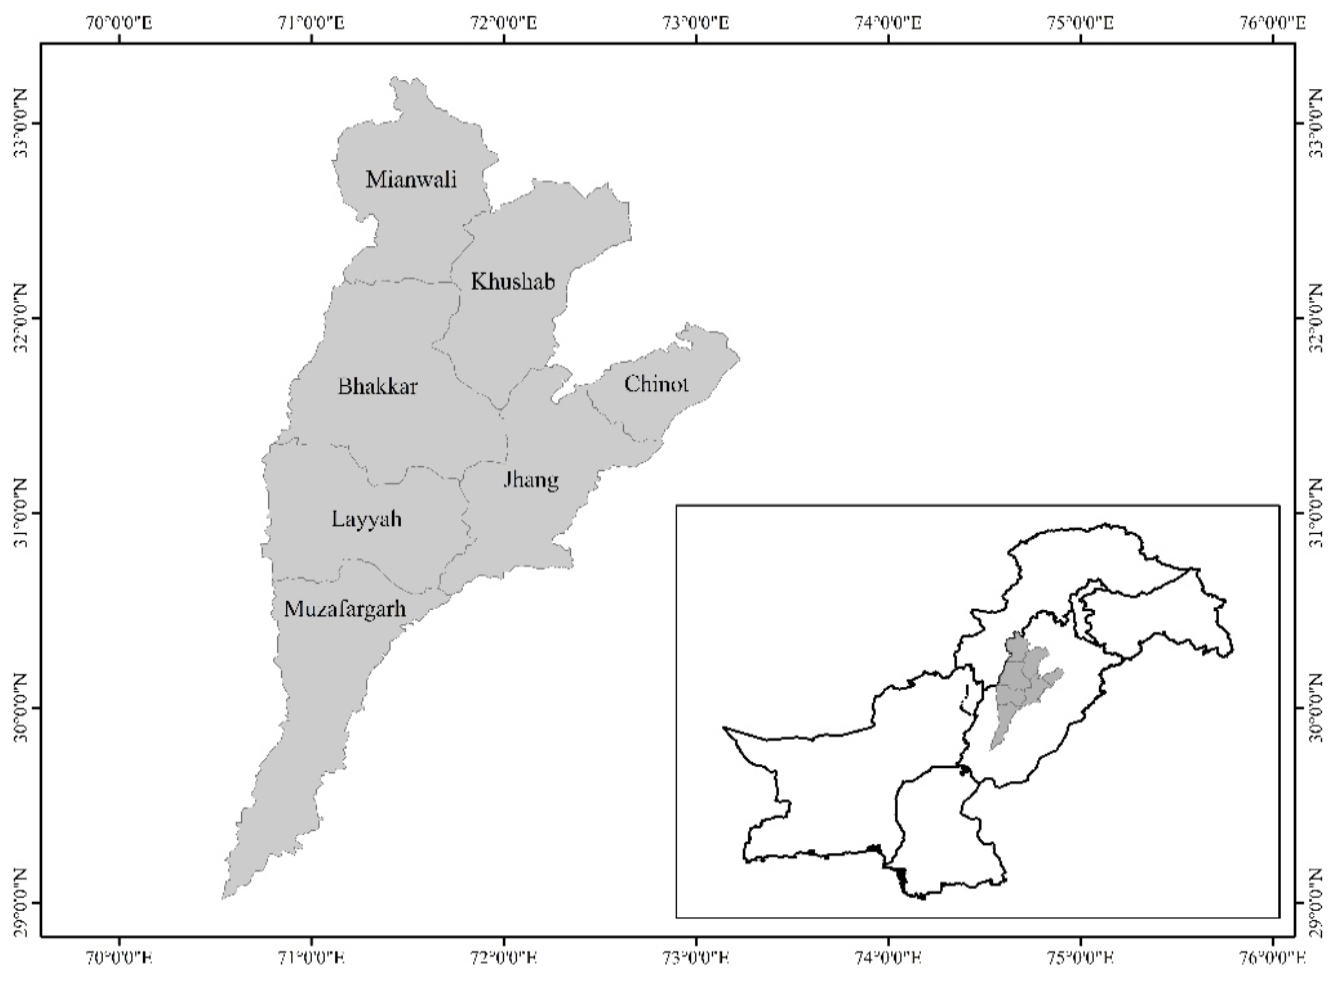
Dry land area of Punjab, Pakistan (study area).
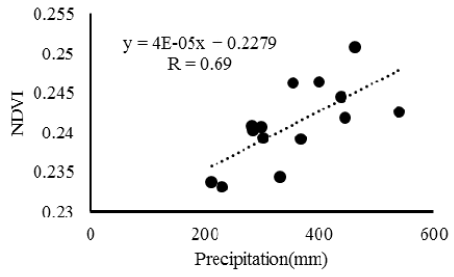
Regression between Precipitation and Mean NDVI.
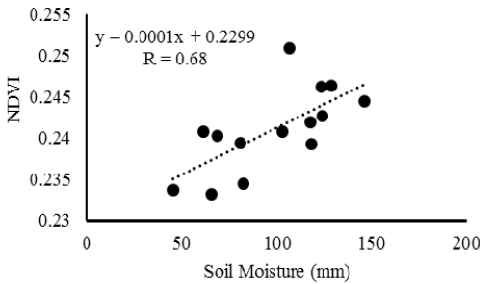
Regression Between Soil Moisture and Mean NDVI.
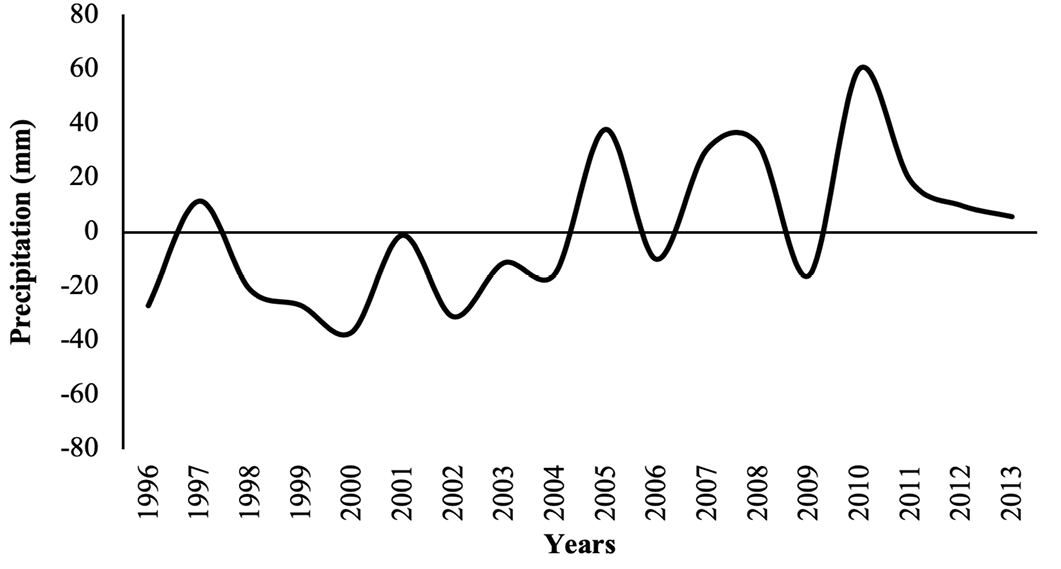
Precipitation Anomaly for years 1996 – 2013.
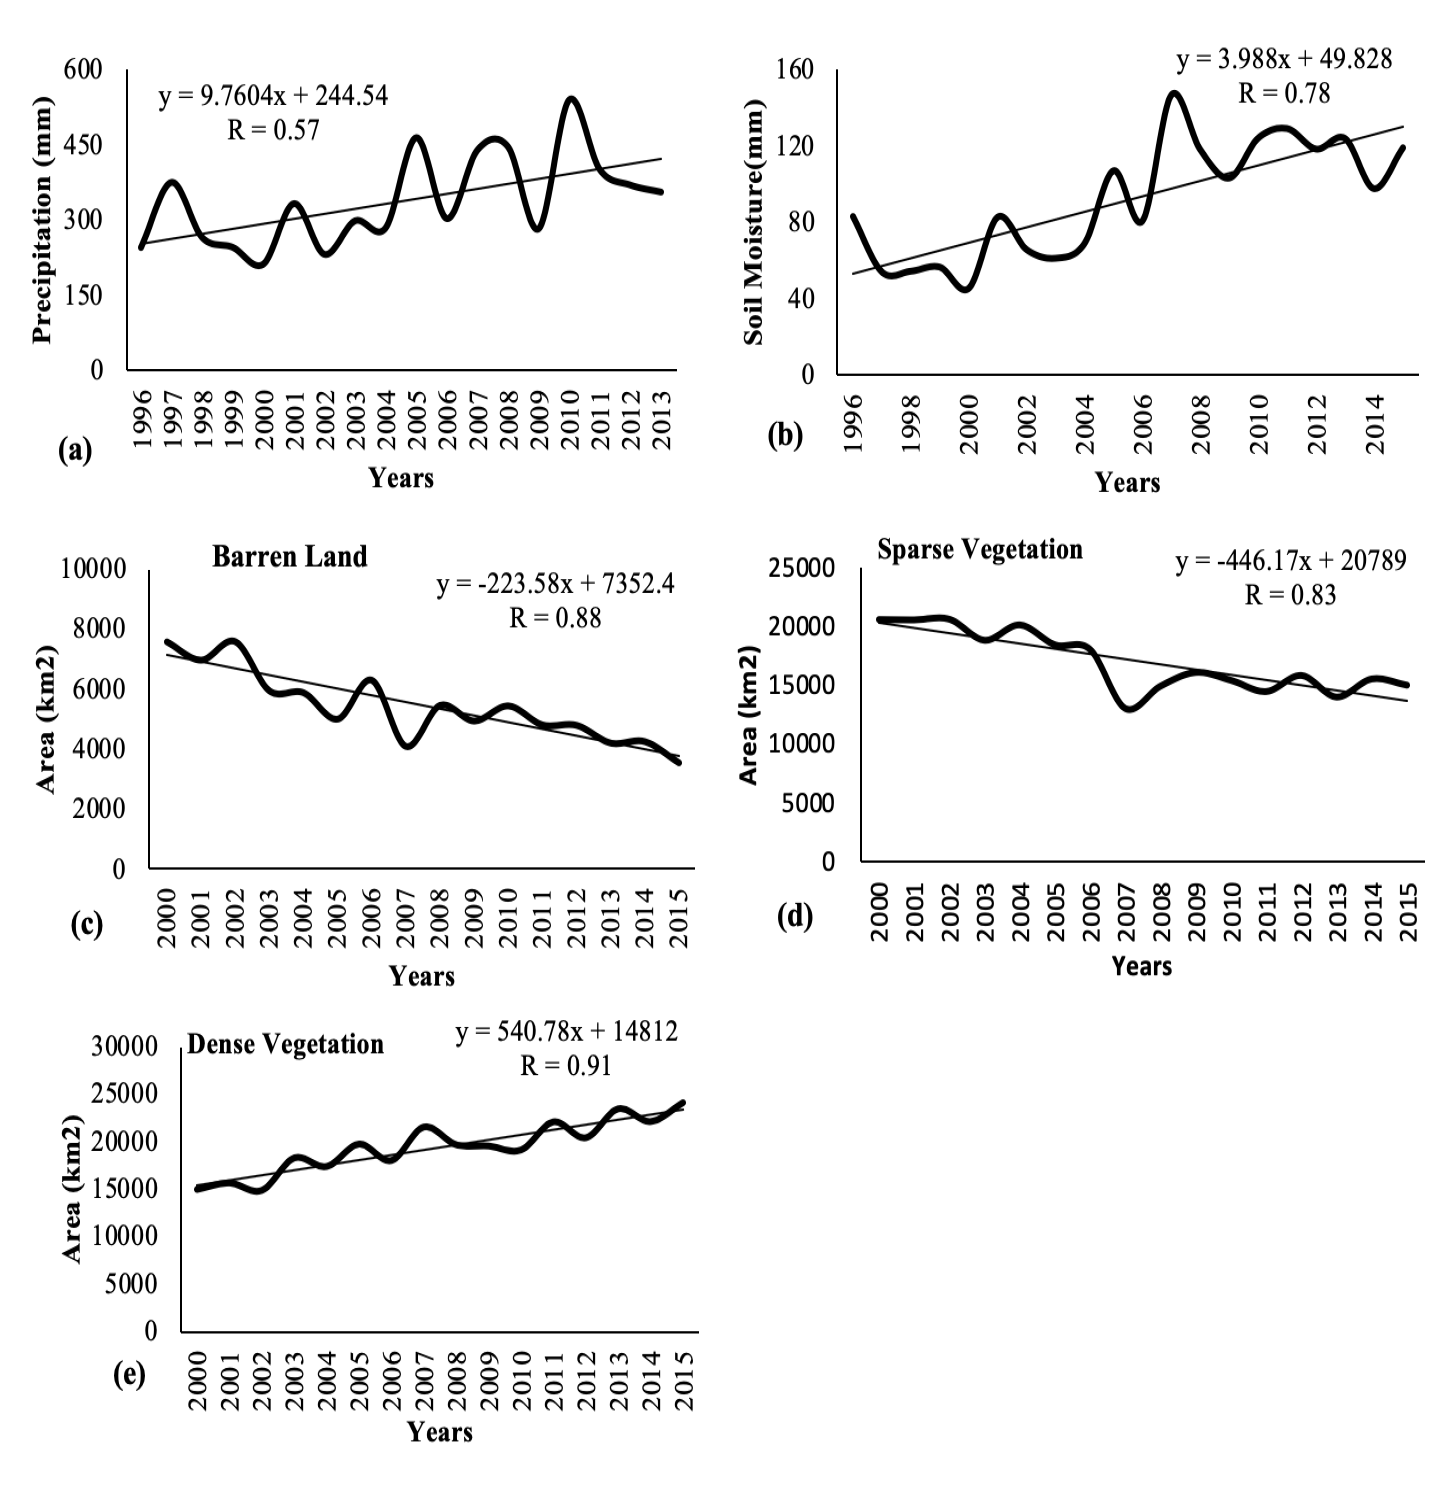
early analysis of precipitation (a), Soil moisture (b), Barren (c), Sparse (d) and Dens (e) Vegetation.
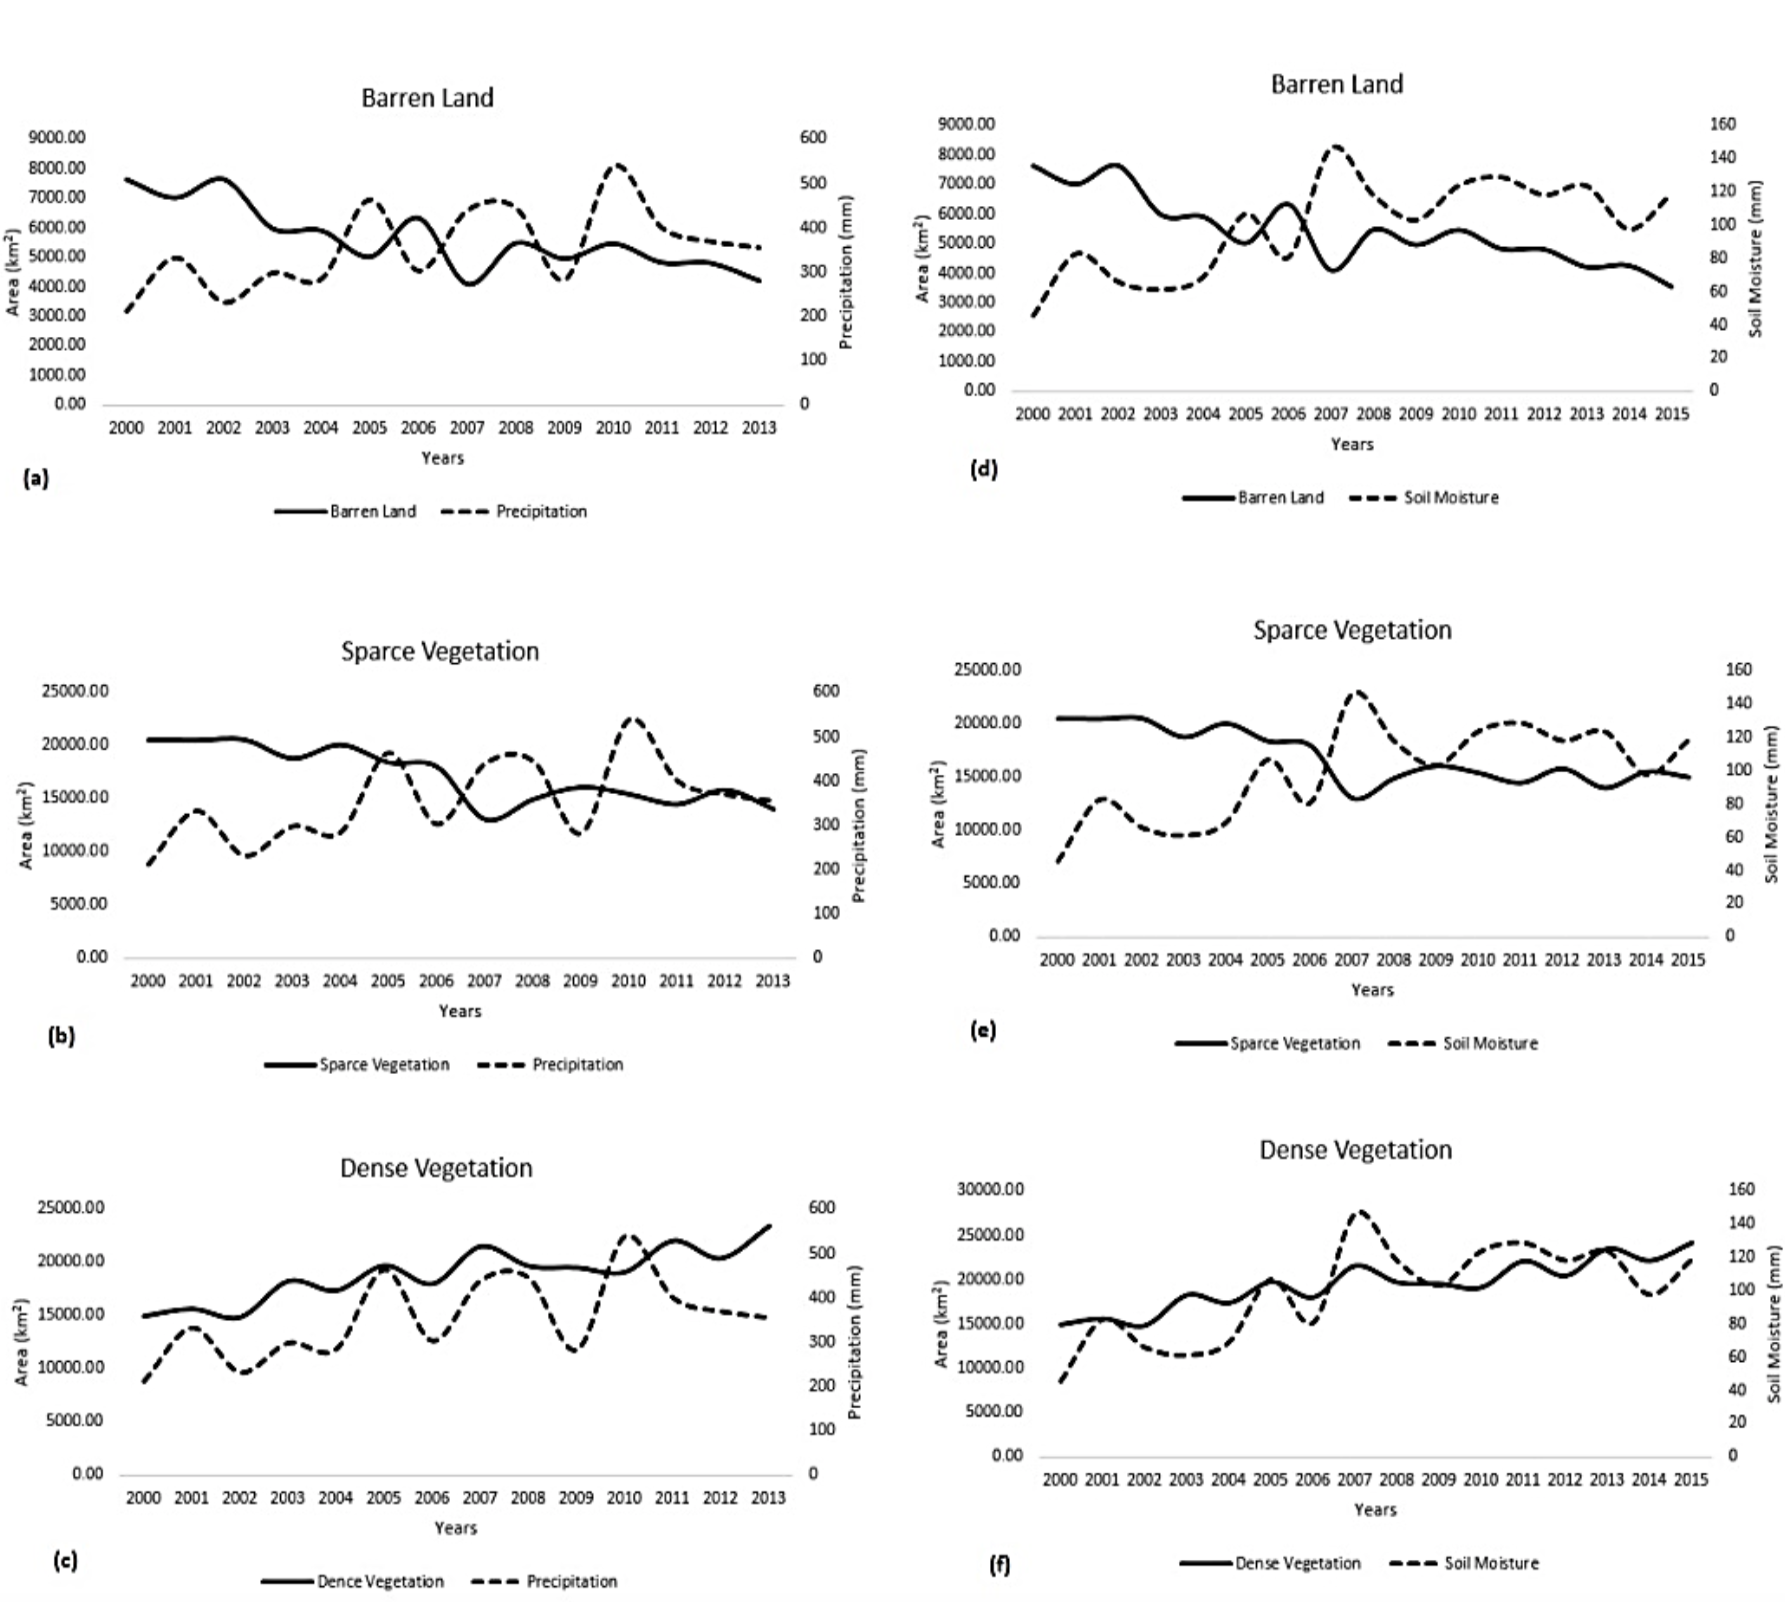
Soil Moisture and Precipitation Relation with Barren land (a) (d), Sparse Vegetation (b) (e), Dense Vegetation (c) (f).
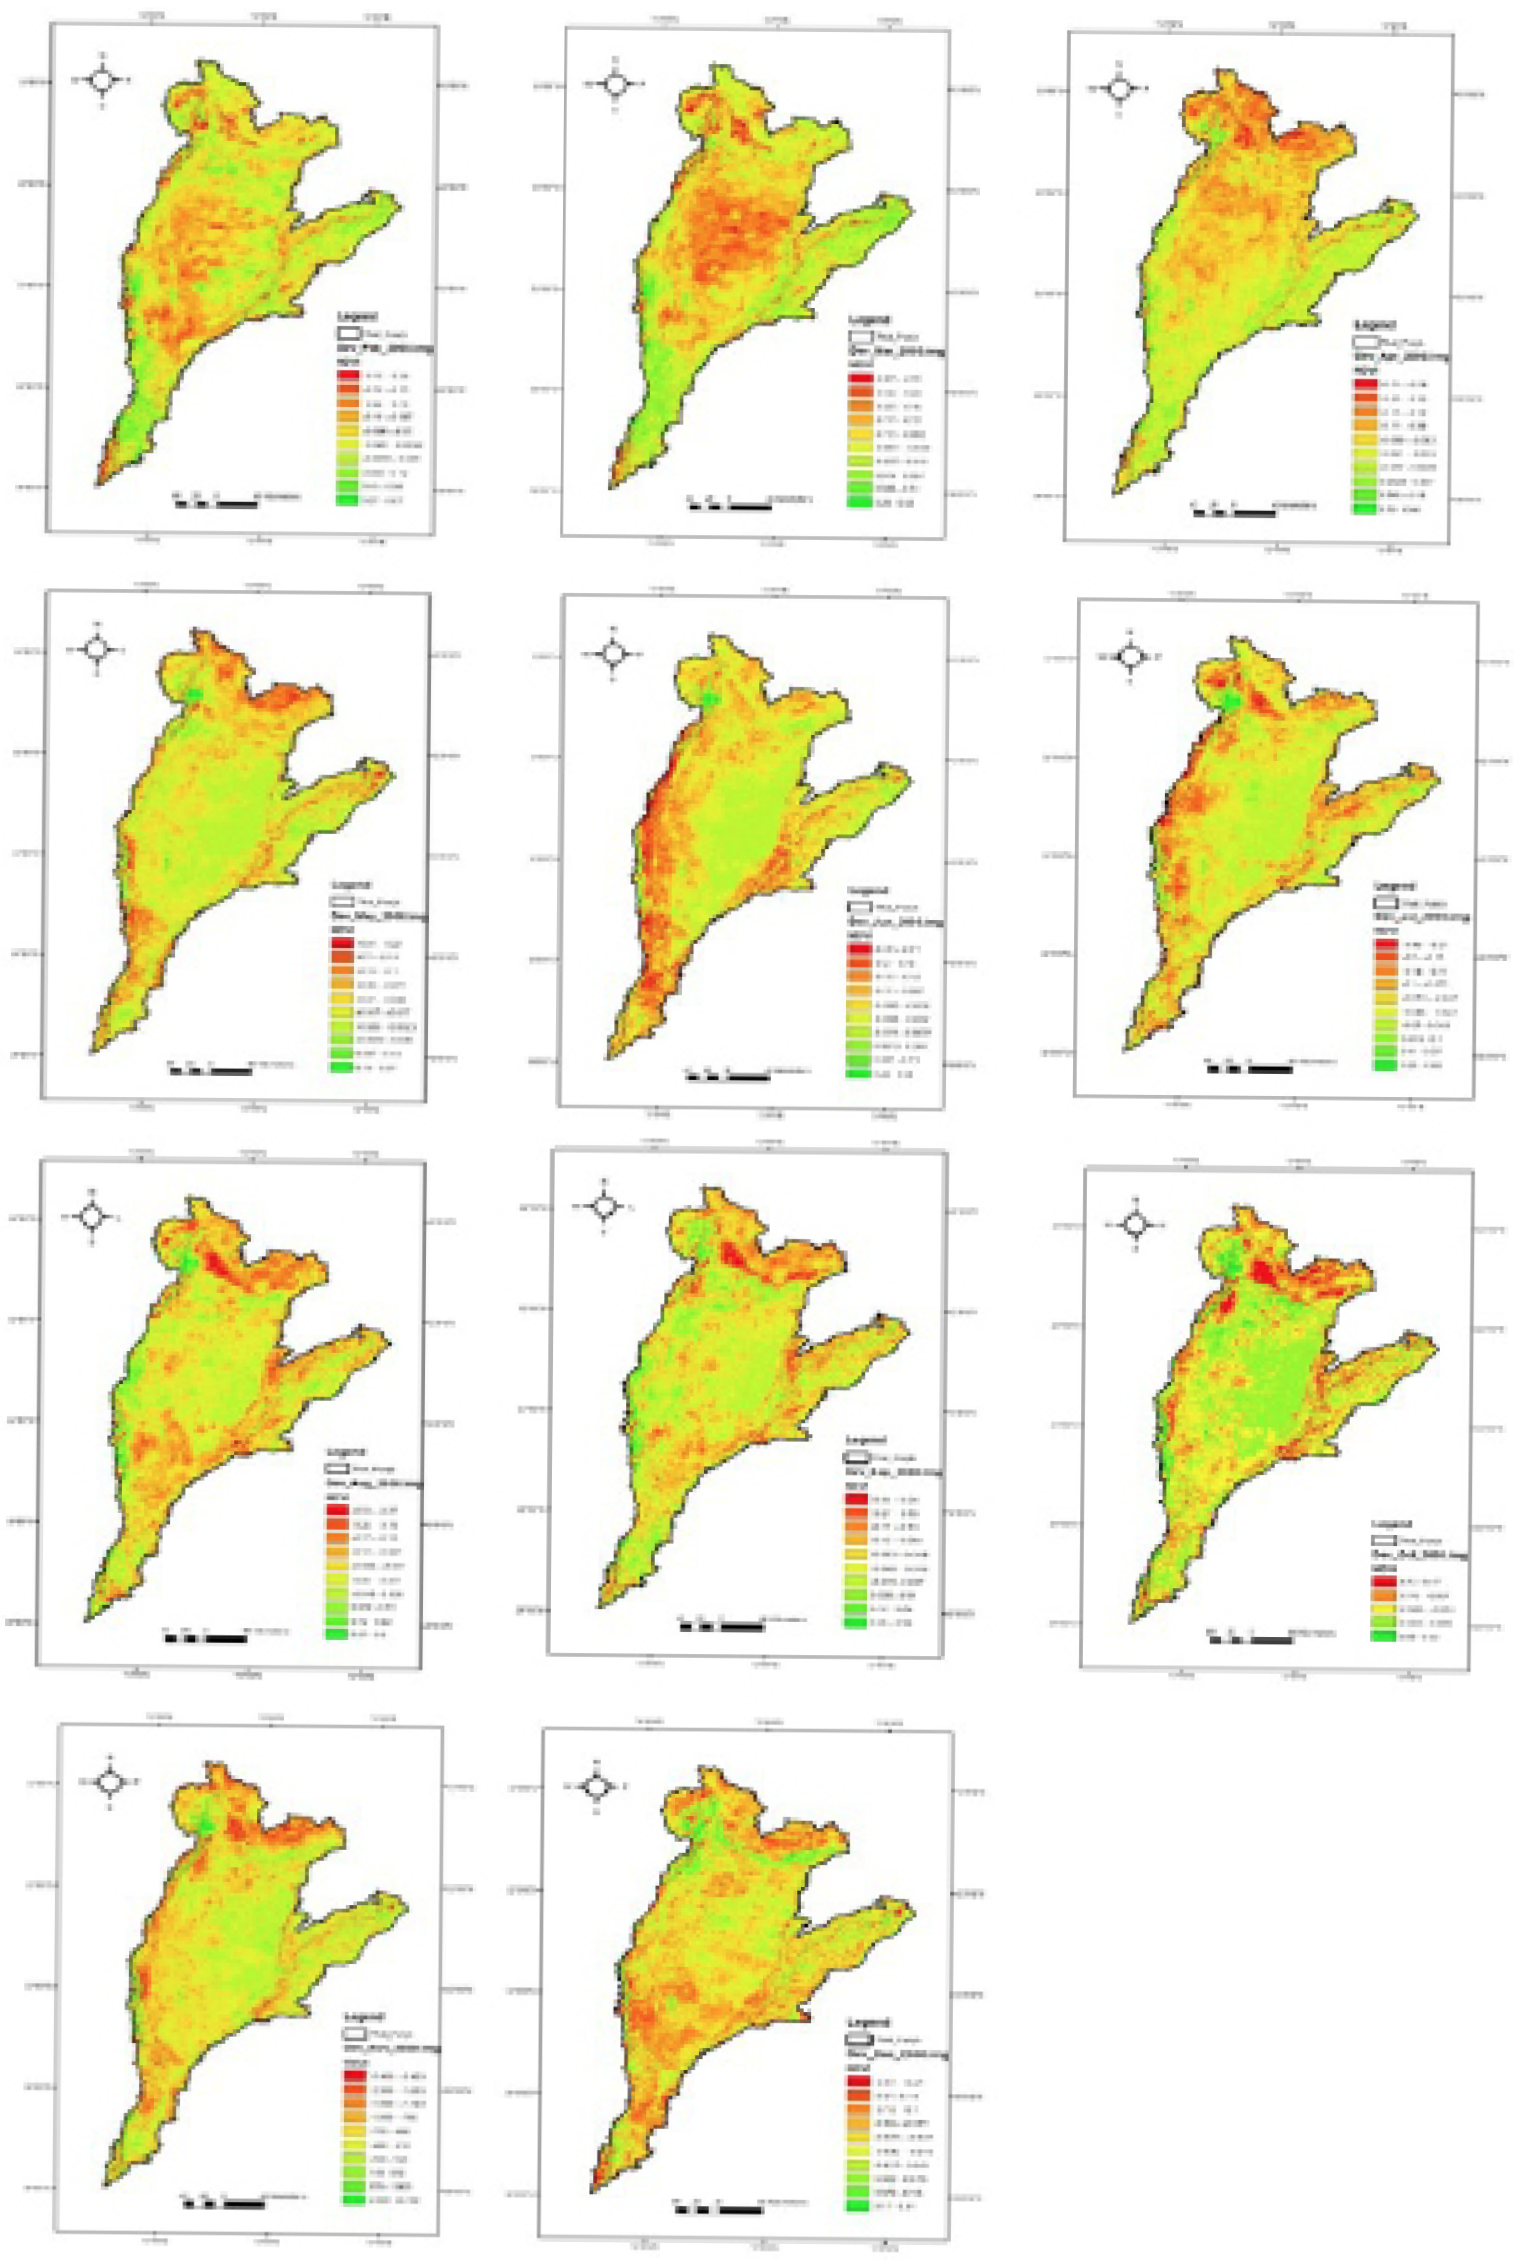
DEVNDVI of Drought year 2000 calculated from long term means of respective months in a year; (a) Feb, (b) Mar, (c) Apr, (d), May, (e) Jun, (f) Jul, (g) Aug, (h) Sep, (i) Oct, (j) Nov, (k) Dec.
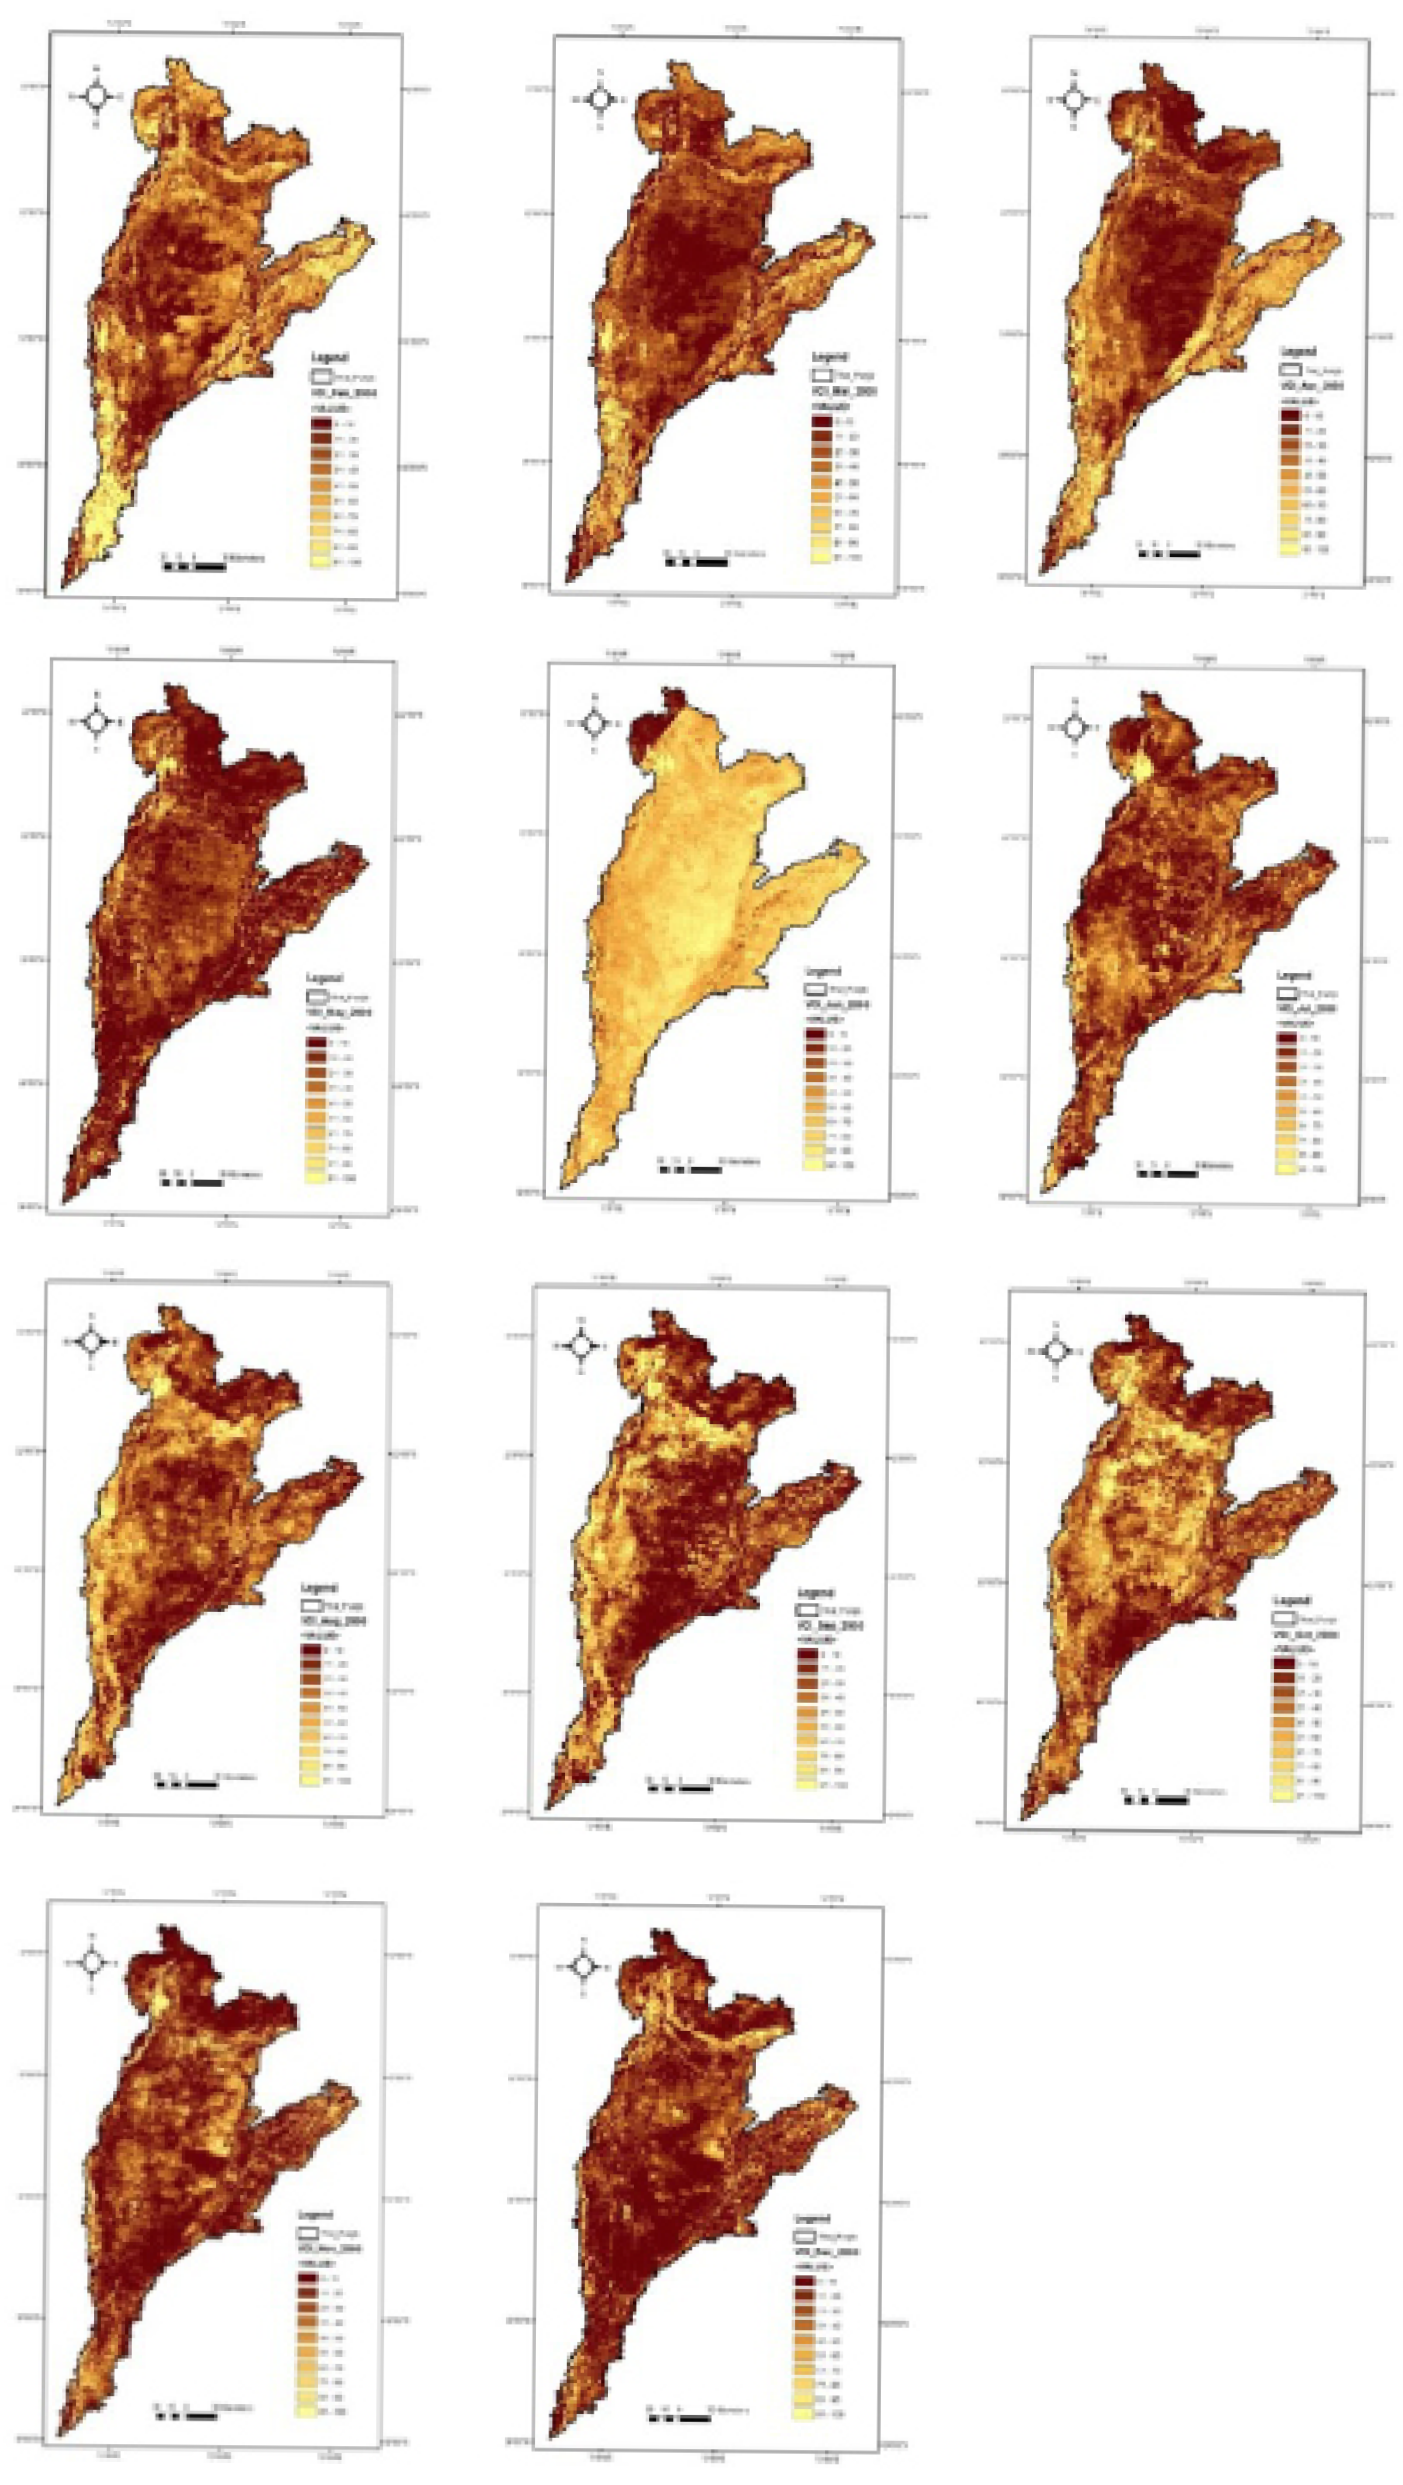
VCI of Drought year 2000 calculated from long term minimum and maximum of respective months in a year; (a) Feb, (b) Mar, (c) Apr, (d), May, (e) Jun, (f) Jul, (g) Aug, (h) Sep, (i) Oct, (j) Nov, (k) Dec
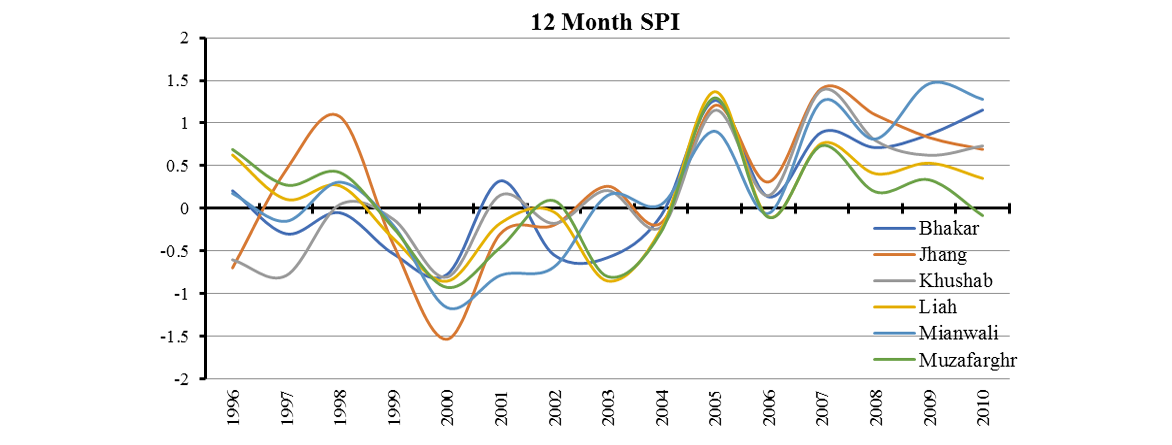
12-Month SPI of the districts of Thal region.


