
Does Access to Basic Services and Productive Assets Influence Agricultural Households’ Dietary Diversity and Food Security? Evidence from Ogun State, Nigeria


Research Article
Does Access to Basic Services and Productive Assets Influence Agricultural Households’ Dietary Diversity and Food Security? Evidence from Ogun State, Nigeria
Shakirat Bolatito Ibrahim1, Raheem Olatunji Aminu1,2*, Aisha Olushola Arowolo1 and Adams Sanusi Musa1
1Department of Agricultural Economics and Farm Management, Federal University of Agriculture Abeokuta, Abeokuta, Nigeria; 2School of Agriculture, Policy and Development, University of Reading, Reading, United Kingdom.
Abstract | This study aimed to examine how basic services and agricultural assets could affect the status of food security and dietary diversity among agricultural households in Ogun State, Nigeria. Data were collected cross-sectionally from 208 households containing 1546 individuals. The results show that 73% of farmers owned the cultivated land, while 26% had rights over the cultivated land. The average distance of the sampled households to public and private hospitals in the study area is 2.33km and 0.88km. Most households consume cereals, roots, and tubers. As indicated by the household dietary diversity score, 85.64% of households showed a high level of dietary diversity. The food expenditure data shows that food insecurity affected 59% of households, with levels of severity and depth of food insecurity of 0.27 and 0.19, respectively. The ordered logit result indicates that gender, farmer association, cooperative society, extension visits, access to credit, remittances, and land ownership significantly influenced household dietary diversity status. In the logit model, age, household size, land ownership, cooperative society, extension visits, credit availability, land rights, and distance to medical centres are significantly correlated with food insecurity. Thus, policy strategies aimed at improving households’ access to functional healthcare services and cultivable agricultural land are needed to improve dietary diversity and food security.
Received | February 13, 2023; Accepted | September 12, 2023; Published | October 30, 2023
*Correspondence | Raheem Olatunji Aminu, Department of Agricultural Economics and Farm Management, Federal University of Agriculture Abeokuta, Abeokuta, Nigeria; Email: r.o.aminu@pgr.reading.ac.uk
Citation | Ibrahim, S.B., R.O. Aminu, A.O. Arowolo and A.S. Musa. 2023. Does access to basic services and productive assets influence agricultural households’ dietary diversity and food security? Evidence from Ogun State, Nigeria. Sarhad Journal of Agriculture, 39(4): 787-799.
DOI | https://dx.doi.org/10.17582/journal.sja/2023/39.4.787.799
Keywords | Basic infrastructure, Productive assets, Food insecurity, Nigeria
Copyright: 2023 by the authors. Licensee ResearchersLinks Ltd, England, UK.
This article is an open access article distributed under the terms and conditions of the Creative Commons Attribution (CC BY) license (https://creativecommons.org/licenses/by/4.0/).
Introduction
Infrastructure and productive agricultural assets are essential for sustainable agriculture development to ensure food security, reduce poverty, and increase economic growth. Jamaludheen et al. (2022) described productive agricultural assets as various types of assets used to produce agricultural goods and services. These assets could be movable (farm machinery and implements, livestock) or immovable (land and buildings). Obayelu et al. (2014) described basic services as infrastructures that facilitate the provision of an environment necessary for primary, secondary, and tertiary production activities. Infrastructural facilities can be classified as physical facilities, social amenities, and institutional infrastructure (Rahji, 2007; Obayelu et al., 2014; Demenge et al., 2015). Efficient farm operation, sustainable agricultural productivity growth, and agro-industry development are prerequisites for efficient public infrastructure in the agricultural sector (Oni, 2013). Nigeria’s agricultural production is largely dependent on smallholder farmers (Anthony et al., 2021), residing in remote areas often characterised by a poor road network with major markets and towns, the poor state of public infrastructure and market information (Abu and Soom, 2016).
Nigeria is characterised by an abysmally poor state of public infrastructure and was ranked 132 out of 137 countries in 2017, according to the World Economic Forum, (2018). Foster and Pushak (2011) submitted that the nature and quality of Nigeria’s rural road network are pretty lower than those required to service the rural agricultural economy, as about 80 per cent of the rural populace in the country lack access to an all-season road. The poor state of public infrastructure in Nigeria is exacerbating food insecurity and poverty through poor market linkages between agricultural traders (off-takers, wholesalers, and retailers) and farmers, inefficient and non-effective agricultural marketing, and high prices of food commodities (Olayiwola and Adeleye, 2005; Umoren et al., 2010).
Increasingly, governments and development agencies prioritise food security, especially in low-income countries (FAO, 2015). As part of sustainable development goal 2, the goal emphasises the promotion of sustainable, productive agriculture through increased investment in rural infrastructure, supporting smallholder farmers, and ensuring equitable access to land, technology, markets, information, and other relevant, productive resources across all categories of farmers to achieve zero hunger and food security (UNICEF/WHO, 2015). Nigeria’s food insecurity severity could be linked to the comprehensive domestic food demand-supply gap, as the country’s agricultural output and domestic food supply are insufficient to meet the rising demands of the country’s increasing population (Metu et al., 2016). The global hunger index for Nigeria in 2020 was 28.3, making it 103 out of 116 countries in terms of hunger (Global Hunger Index, 2021). Food insecurity in Nigeria is prevalent among low-income rural households relative to urban households (Akerele et al., 2013).
Food security is directly and importantly linked to access to basic productive assets and infrastructural development. Specifically, the availability of adequate and functional infrastructural facilities enhances individuals’ and households’ physical, economic, and socio-cultural access to food as well as the utilisation of food. Previous literature evidence indicates that adequate investment in rural infrastructure is essential to developing the Nigerian food system, which has significant direct implications for the country’s food security. Omotoso et al. (2022) assessed the influence of access to rural infrastructure on food crop production efficiency in Ogun State, Nigeria. Their findings revealed that in addition to production inputs, rural infrastructure significantly impacts the agricultural income and efficiency of food crops produced as crop farmers in infrastructure-developed areas earn more profit per hectare of cultivated land than their counterparts in less-developed infrastructure areas. Ezeabasili et al. (2014) examined how existing infrastructure facilities in Anambra State, Nigeria, could improve food security. Their findings revealed a need for adequate upgrading and rehabilitation of existing infrastructural facilities to improve the food security situation of the inhabitants of the study area. The impact of the Community-Driven Development (CDD) approach in sustainably increasing access of the poor to rural infrastructure on the livelihood of smallholders in agricultural communities in Edo State, Nigeria, was evaluated by Emokaro and Oyoboh (2016). They found that the CDD approach effectively enhanced the rural poor’s access to improved infrastructure on a sustainable basis, which resulted in measurable improvements in the respondents’ income-earning power, water, sanitation, hygiene and health status. Based on the foregoing arguments, this study examined the impact of basic infrastructure and agricultural assets on smallholder agricultural households dietary diversity and food security in Ogun State, Nigeria. Specifically, this study focused on achieving the following objectives:
- Describe the socio-economic characteristics and basic infrastructure, and productive assets accessible to the smallholder agricultural households.
- Describe various types of food groups consumed by the smallholder agricultural households.
- Determine the dietary diversity status of the smallholder agricultural households.
- Determine the food security status of the smallholder agricultural households.
- Determine the influence of access to basic services and productive assets on the dietary diversity of the smallholder agricultural households.
- Determine the influence of access to basic services and productive assets on the food security of the smallholder agricultural households.
The remainder of this article is structured as follows. The data collection procedure, data source, and analysis method are briefly introduced in section 2. Section 3 discusses our findings and their relevance to achieving food security. Section 4 concludes based on our findings and presents some important policy guidelines.
Materials and Methods
Study area and sampling
The study was conducted in Ogun State, popularly called the Gateway state. This state has a total land area of 16,432 km2, which lies within the tropics. Ogun state lies within latitudes 6o 20’ and 7o 58’ and longitude 2o 40’ and 4o 35’ East of the Greenwich Meridian and has a total population of above 7 million (Ogun State, 2020). In Nigeria, the state is one of the largest manufacturing centres because of its dense concentration of industrial estates (Ogun State, 2020). Ogun state lies between two (rainforest and derived savanna) of the six agroecological zones in Nigeria suitable for mass food production (Adekoya, 2014). Most rural dwellers in the state are predominantly farmers (Ibrahim et al., 2019) and major producers of food crops such as cassava, maise, plantain, rice, and cocoa. The Agricultural Development Programme (ADP) divides Ogun state into four (4) ADP zones comprising Abeokuta, Ikenne, Ijebu-ode and Ilaro for agricultural administrative convenience.
Data for this study were acquired from primary sources using a well-structured questionnaire. A combination of multistage random sampling and systematic sampling methods was employed to select the two hundred and eight (208) participating smallholder agricultural households (consisting of 1546 household members). The first sampling stage involves the random selection of Abeokuta and Ikenne ADP zones out of the four ADP zones in the state. This is followed by randomly selecting two blocks from the two selected ADP zones. During stage three, two cells were randomly selected from each block to make a total of four cells. From the previous cells, two villages were randomly selected for the fourth stage, resulting in 8 villages. The last stage was a systematic sampling selection of 26 participating households from each of the eight selected villages. This was achieved by obtaining the total number of agricultural households in each village from the Ogun state Agricultural Development Programme (OGADEP) to be used as the sampling frame. The total number of agricultural households was then divided by 5 to calculate the Sampling Interval (SI) to get a random starting point for the systematic selection of the 26 agricultural households from the 8 earlier selected villages. Due to the omission of important variables in a few participating households, responses from fully completed questionnaires by two hundred and two (202) respondents were used for the data analysis.
Methods and tools of data analysis
Data were imputed into Microsoft Office 365 Excel spreadsheet (Microsoft, 2021) for cleaning, handling, and storage and later exported to Stata SE version 17 (Stata Corp, 2021) for further analysis.
Descriptive statistics
Frequency and percentage distribution tables were adopted to describe various household food consumed (Figure 1) and their socio-economic characteristics such as age, sex, marital status, farm size, type of enterprise, access to basic infrastructure and productive assets, among others.
Household dietary diversity score
The data on smallholder agricultural households’ food consumption were collected using the 24-hour dietary recall approach. This approach has received wider popularity among scholars working on food and nutrition security, most importantly in developing countries (Agbadi et al., 2017; Mango et al., 2014; Muhammad-Lawal et al., 2017; Pritchard et al., 2019). The households were visited at their various homes and elicited information on food consumed from the women in the respective households. Women were assumed to have a better retentive memory, especially about the food consumed by the household since women are mostly involved in cooking the food (Muhammad-Lawal et al., 2017). Households were asked to provide information about their meals, dishes, and other food items and beverages consumed during the past 24 hours, which were aggregated into 12 food groups based on the Food and Agriculture Organisation (2010) grouping. All food groups mentioned by the households were summed to calculate their respective household dietary diversity score (HDDS), which ranges from 0 to 12. The HDDS was into three broad categories: Low, medium and high dietary diversity (Table 4). The dietary diversity cut-offs were adopted from the FANTA project of FAO (2010) due to a lack of national guidelines to base cut-offs. It should be noted that HDDS does not reflect the quantity of food consumed. Thus, HDDS is designed to reveal a glimpse of the household’s financial capability to access varied diets (FAO, 2010).
Ordered logistic regression model
Using the ordered logistic regression model, this study examined the effects of access to basic infrastructural services and production assets on agricultural households’ dietary diversity. The ordered logistic regression model is expressed explicitly as follows.

Where; Yi =1 (low dietary diversity), Yi = 2 (medium dietary diversity) and Yi =3 (high dietary diversity), β0 = Constant, Q’ is a vector of variables representing household access to basic service, and this include: Q1 = Extension visits, Q2 = Access to credit, R’ is a vector of variables representing the household access to productive assets, and this include: R1 = Land ownership, S’ denotes the vector of household-level socio-economic characteristics, and this include: S1= Gender, S2 = Age, S3 = Household size, S4 = Primary education, S5 = Secondary/tertiary education, S = Farm association, S7 = Cooperative membership, S8 = Remittance.
Measuring food security
The FGT decomposable measure developed by Foster et al. (1984) was used to measure household food security. Following Akerele et al. (2013), the FGT measures were modified as a Food security index. This index has been widely applied in scholarly works (Ayinde et al., 2012; Iqbal et al., 2018; Ibrahim et al., 2019). The general specification of the model is given below:
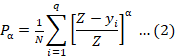
Where; Pα= Representation of FGT index, q = Number of food insecure household, z = Food security line for household, Yi = per-capita food expenditure of ith insecure household, N = Total number of households, ⍺ = 0 gives the headcount ratio, i.e., the proportion of households below the food security line. ⍺ = 1 gives the food security gap index, i.e., the proportion of the food security threshold (line) that an average food-insecure household will require to attain the food security line. ⍺ = 2 gives the food insecurity severity index; it gives the most food insecure a weight, indicating that the closer the value is to 1, the higher the seriousness of food insecurity. To construct the food security line, the two-third mean per capita of household expenditure on food was used as the benchmark to categorise households into food-secure and non-food-secure households. The food security line is derived as follows:

Where; HPCFE = Household per-capita food expenditure; HFE = Household food expenditure; NHS = Number of household size

TPCFE = Total per-capita food expenditure.

MPCFE = Mean per-capita food expenditure; N = population size.

Z = Food Security Line
Decision: If HPCFE ≥ Z = Household is food secure = 0; If HPCFE ≤ Z = Household is food insecure = 1
Logistics regression model
A logistic regression model was estimated to determine the impact of access to basic services and productive assets on food poverty in the study area. Following Ibrahim et al. (2019), the model is expressed as follows;


Explicitly,

Where; Yi = 1 if the household is food insecure and 0 if otherwise; β0 = Constant, Q’ is a vector of variables representing household access to basic service, and this include, Q1 = extension visit, Q2 = Access to credit, Q3= Distance to the private health centre in kilometres, Q4 = Distance to the public health centre in kilometres. R’ is a vector of variables representing the household access to productive assets, and this include, R1 = Land ownership, R2 = Land right, S’ denotes the vector of household-level socio-economic characteristics, and this include, S1 = Gender, S2 = Age, S3 = Household size, S4 = Marital Status, S5 = Year of education, S6 = Number of house members in the farm operation, S7 = Cooperative membership.
Results and Discussion
Description of respondents socio-economic characteristics
The summary statistics of the sampled agricultural households’ socio-economic characteristics are presented in Tables 1. According to the results, 84% of the sampled agricultural households are headed by males, with 77% being married households. The majority (about 80%) of the respondents are between 31 and 60 years old, indicating that they are in their active and productive age. The average age of the household heads is approximately 45 years. About 56% of the agricultural household heads reported having no formal education; 27% had primary education; 14% were educated up to the secondary level, while 2% reported having tertiary educational qualifications.
Table 1: Data description for selected variables.
|
Variables |
Description |
Mean |
Standard deviation |
|
Gender |
Dummy for the gender of household head (male = 1) |
0.84 |
0.37 |
|
Age |
Age of household head (years) |
45.16 |
9.22 |
|
Household size |
Number of household members |
7.65 |
2.91 |
|
Years of education |
Number of years of schooling of household head (years) |
2.98 |
4.34 |
|
No. of household members in the farm operation |
Number of household members engaged in the household farming operations |
4.96 |
2.72 |
|
Membership in a cooperative society |
Dummy for whether a household is a member of any cooperative society (Yes = 1) |
0.32 |
0.47 |
|
Extension Contacts |
Number of visits made by extension agent during the last production season |
5.34 |
2.82 |
|
Access to credit |
Dummy for access to credit by the household head (Have access =1) |
0.17 |
0.37 |
|
Remittance (‘000) |
The total amount of money received by the household from friends and families within and out of the country (₦) in thousands |
2.72 |
8.03 |
|
Land ownership |
Dummy for ownership of land by the household (Owned =1) |
0.73 |
0.44 |
|
Land right |
Dummy for household head right to sell or lease a land (Have right =1) |
0.26 |
0.44 |
|
Distance to the private health centre |
Distance to the nearest private health care centre (Km) |
0.88 |
0.41 |
|
Distance to the government health centre |
Distance to the nearest government health care centre (Km) |
2.33 |
1.51 |
The mean household size was approximately 8 persons. Within each household, about 5 persons, on average, engaged in the households’ farming operations. 32% of the agricultural households are members of cooperative society, 90% benefitted from agricultural extension services, while 17% of the respondents reported having access to agricultural credit. Furthermore, most households (73%) owned their cultivated agricultural land. However, only about a quarter of these household heads had the right to sell or lease their agricultural land.
Profile household food consumption
To understand the sampled agricultural households’ dietary diversity, the frequency distribution of the different food groups consumed by the respondents was examined, as represented by Figure 1 and Table 2. It was found that most of the respondents consumed a diet from cereal (91%), root and tuber (91%) and vegetable (90%) sources; likewise, a higher proportion of households consumed oil/fat (80%) and legume (67%). Concerning animal food consumption, 78% of households consume meat, while 48%, 25%, and 8% of the sampled households consume fish, egg, and milk. In addition, nearly 51% of the sampled households consumed fruit and SCB, while 8% consumed sweets during the previous day of the survey. This result is in line with findings in the existing literature about the food composition pattern of rural households (Obayelu et al., 2009).
Table 2: Description of food categories consumed by household.
|
Variable |
Observation |
Mean |
Std. Dev. |
Rank |
|
Cereal |
202 |
0.91 |
0.29 |
1 |
|
Root and Tuber |
202 |
0.91 |
0.29 |
1 |
|
Fruit |
202 |
0.51 |
0.50 |
6 |
|
Vegetable |
202 |
0.90 |
0.30 |
2 |
|
Meat |
202 |
0.78 |
0.42 |
4 |
|
Egg |
202 |
0.25 |
0.43 |
8 |
|
Fish |
202 |
0.48 |
0.50 |
7 |
|
Legume |
202 |
0.67 |
0.47 |
5 |
|
Milk |
202 |
0.08 |
0.27 |
10 |
|
Oil and Fat |
202 |
0.82 |
0.39 |
3 |
|
Sweets |
202 |
0.18 |
0.38 |
9 |
|
SCB |
202 |
0.51 |
0.50 |
6 |
The households dietary diversity score (HDDS) information is presented in Table 3. The result shows that the average HDDS among the respondents is 7.86, with most households (85.64%) having high dietary diversity. The households with low dietary diversity (8.91%) and medium dietary diversity (5.45%) have a mean score of 1.22 and 5.00, respectively, indicating that most sampled households consumed more than five food groups. Our result is in line with the findings of Udoh and Udoh (2019) that most households in Akwa Ibom, Nigeria are sufficiently diverse in their diets. Besides, the most consumed food groups appear to be cereals, root and tubers, and vegetables, as evidenced by our result (Figure 1), which could likely be from their farm produce rather than incurring costs on them. This is not uncommon among smallholder farm households in Nigeria as this
Table 3: Distribution of household dietary diversity score (HDDS).
|
Dietary diversity score |
Frequency |
Mean |
Percentage |
|
Low (1-3 food groups) |
18 |
1.22 |
8.91 |
|
Medium (4-5 food groups) |
11 |
5.00 |
5.45 |
|
High (above 5 food groups) |
173 |
7.86 |
85.64 |
|
Total |
202 |
100 |
Table 4: Ordered logistic regression results for the effect of access to basic services and productive assets on household dietary diversity status.
|
Variables |
Coefficient |
Standard error |
z-statistics |
p value |
|
Gender |
-4.081*** |
1.203 |
-3.39 |
0.001 |
|
Age |
0.022 |
0.044 |
0.49 |
0.625 |
|
Household size |
-0.021 |
0.151 |
-0.14 |
0.889 |
|
Primary education |
-0.160 |
0.797 |
-0.2 |
0.841 |
|
Secondary/tertiary education |
0.223 |
0.866 |
0.26 |
0.797 |
|
Farmer Association |
-1.672* |
0.899 |
-1.86 |
0.063 |
|
Membership of cooperative |
5.059*** |
1.772 |
2.85 |
0.004 |
|
Extension contacts |
0.477*** |
0.162 |
2.95 |
0.003 |
|
Credit access |
4.619*** |
1.379 |
3.35 |
0.001 |
|
Remittance |
0.180*** |
0.072 |
2.5 |
0.013 |
|
Land ownership |
2.649*** |
0.841 |
3.15 |
0.002 |
|
cut1 |
5.910 |
2.457 |
||
|
cut2 |
6.731 |
2.479 |
||
|
Number of observations |
180 |
|||
|
Likelihood Ratio Chi2 (11) |
46.25 |
|||
|
Probability > Chi2 |
0.000 |
|||
|
Pseudo R2 |
0.251 |
|||
|
Log-likelihood |
-68.917508 |
|||
***Significance at 1% level, **Significance at 5% level, *Significance at 10% level.
Table 5: Results of the marginal effects on the effect of access to basic services and productive assets on household dietary diversity status probability.
|
Variables |
Y = 1 (Low) |
Y = 2 (Medium) |
Y = 3 (High) |
|||
|
Dy/Dx |
Std. Err. |
Dy/Dx |
Std. Err. |
Dy/Dx |
Std. Err. |
|
|
Gender |
0.467*** |
0.152 |
0.070** |
0.038 |
-0.537*** |
0.124 |
|
Age |
-0.001 |
0.003 |
-0.001 |
0.001 |
0.002 |
0.004 |
|
Household size |
0.001 |
0.009 |
0.001 |
0.004 |
-0.002 |
0.013 |
|
Primary |
0.010 |
0.050 |
0.005 |
0.024 |
-0.015 |
0.074 |
|
Secondary |
-0.012 |
0.047 |
-0.006 |
0.023 |
0.019 |
0.070 |
|
Farmer Association |
0.098** |
0.051 |
0.046** |
0.028 |
-0.144** |
0.075 |
|
Cooperative membership |
-0.296*** |
0.103 |
-0.141** |
0.061 |
0.437*** |
0.143 |
|
No of extension visit |
-0.028** |
0.010 |
-0.013** |
0.005 |
0.041*** |
0.013 |
|
credit access |
-0.487** |
0.130 |
-0.051 |
0.044 |
0.538*** |
0.093 |
|
Remittance |
-0.011*** |
0.004 |
-0.005*** |
0.002 |
0.016*** |
0.006 |
|
Land ownership |
-0.192** |
0.079 |
-0.089*** |
0.031 |
0.282*** |
0.095 |
***Significance at 1% level, **Significance at 5% level, *Significance at 10% level.
category of agricultural workers primarily cultivates cereals, root and tubers, vegetables and fruits. This assertion is strengthened by the submission of Fawole et al. (2016).
Effect of access to basic services and productive assets on household dietary diversity status
The ordered logistic regression model estimated the influence of respondents’ access to basic services and productive assets on household dietary diversity status (Tables 4 and 5). Of the 11 explanatory variables included in the model, 7 were statistically significant and influenced household dietary diversity status. These include household head’s gender, farmer association, membership of the cooperative society, number of extension visits, access to credit, remittances, and ownership of land (Table 4). The likelihood ratio chi-square (46.25) with a p-value (0.000) revealed that all variables included in the model jointly and significantly influence the household dietary diversity status. The cutoff points denote the threshold points of the underlying latent variable indicating the three dietary diversity groups. The estimated coefficients of independent variables indicate the likelihood of the dependent variable (dietary diversity status) increasing or decreasing in response to a change in each independent variable. Consequently, the marginal effects of each independent variable were estimated to account for the actual magnitude of a change in the independent variables (Table 5). The statistical significance of the estimated coefficients and the marginal effects were discussed in relation to the low dietary diversity group (Y = 1) as the base category.
Gender significantly and negatively (p<0.01) influences the household dietary diversity status; male-headed households are less likely to attain high dietary diversity than their female-headed counterparts. The marginal effect estimate shows that households headed by a male have a higher likelihood of consuming low and moderately-diverse diets by 46.7% and 3.8%, respectively, but a lower probability of consuming highly diverse diets by 53.7% than their female-headed counterparts. This could be because women are culturally and socially responsible for food choices and preparation. Hence, they are more likely to be well informed about the nutritional benefits of various food groups and the appropriate food combination to achieve improved health and nutrition for their families. This result aligns with Taruvinga et al. (2013) findings that households headed by the female are more likely to consume highly diverse diets than their male-headed counterparts in South Africa. However, our result contradicts the findings of Muhammad-Lawal et al. (2017) that male-headed households are expected to consume well-diverse diets in Kwara State, Nigeria.
Membership in farmer associations has a significantly negative (p<0.10) influence on the household dietary diversity status. The marginal effect indicates that being a member of a farmer association will raise the households’ likelihood of having low dietary diversity by 9.8% and the medium group by 4.6% while lowering the possibility of the households falling into the higher group by 14.4%. This result negates aprior expectations and the submission by Onyeneke et al. (2020) that membership in farmer groups improves household dietary diversity in southeast Nigeria. Expectedly, a member of the farmer association should have a better chance of accessing useful information that can improve farm productivity and increase household income, which can then translate to better dietary status.
Consistently with the findings of Dereje et al. (2021), our results revealed that membership in a cooperative society significantly (p<0.01) and positively influenced the household dietary diversity status. That means being a member of a harmonious society decreases the probability of being in the low and medium categories by 29.6% and 14.1% while increasing the chance of being in the high category by 43.7%. Expectedly, membership in a cooperative society provides a wide range of opportunities such as access to market information, sharing of farming experience and dissemination technology, which will enhance the household income, positively impacting the households’ dietary diversity status.
Furthermore, in agreement with Luckett et al. (2015), our results revealed that access to extension services positively and significantly (p<0.01) affects household dietary diversity, which indicated that households with access to extension services have a higher likelihood of being in the high category. This marginal effect showed that access to extension services reduces the chance of a household being in the low and medium categories by 2.8% and 1.3%, respectively, while increasing the possibility of a household being in the high category by 4.1%. Our result could explain that farming households benefit from extension services beyond farming-related advisory services. Moreover, having access to extension services can translate to better and more efficient management of resources, directly improving the household income and their ability to consume nutrient-rich food commodities.
Access to credit positively and significantly (p<0.01) affects smallholder agricultural households’ dietary diversity, implying that credit access lowers households’ chances of being in the low dietary group by 48.7% while raising the possibility of being in the high group by 53.8%. Since agricultural credit access is a significant factor hindering the productivity of farming households, households with access to credit can procure quality inputs that can translate to better output, increasing their income and making more food available. This result relates to Annim and Frempong (2018) submissions and Bidisha et al. (2017) that credit access increases the dietary diversity of households in Ghana and Bangladesh.
In line with the findings of Shively and Evans (2021), our results indicate that remittance significantly positively affects households likelihood of consuming higher-quality diets. This suggested that an increase in household remittance reduces the households’ propensity of being in low and medium dietary diversity groups by 1.1% and 0.5%, respectively, while increasing the tendency of being in the high group by 1.6%.
Land ownership significantly influences household dietary diversity status (p<0.01). This indicates that owning land reduces the probabilities of being in the low and medium categories by 19.2% and 8.9%, respectively, while increasing the chance of attaining the high category by 28.2%. This result shows that farming households with landowners have more significant opportunities to cultivate different crops, ultimately increasing their dietary diversity. This finding supports the empirical evidence from Kiboi et al. (2017) that land ownership positively influenced pregnant women’s dietary diversity status in Kenya.
Table 6: Distribution of household food security status (HFSS).
|
Household food security status (HFSS) |
Interpretation |
Value |
|
P0 |
Headcount ratio |
0.59 |
|
P1 |
Poverty Gap |
0.27 |
|
P2 |
Severity |
0.19 |
|
Mean household per capita expenditure per month |
₦7872 ($19.2USD) |
|
|
Poverty line |
₦5248 ($12.8USD) |
|
|
Observation |
202 |
|
Note: official exchange rate: $410/₦1
Assessment of agricultural households food security status
The result of the adapted FGT poverty index (Table 6) shows that the estimated monthly per capita household food expenditure was ₦7872 ($19.2USD), and the estimated food security cutoff line was ₦5248 ($12.8USD). The headcount ratio (P0) revealed that 59% of agricultural households are food insecure. The poverty gap index (P1) shows that the sampled agricultural household required 27% of the food security line (₦1.139.88) ($2.78) to become food secure. The poverty squared gap index (P2) indicated that 19% of the sampled agricultural households had severe food insecurity. Generally, agrarian household food expenditure is a function of the level of production and household income. Our result shows that food insecurity is high, implying that most households spend less money on food purchases. This could be driven by the fact that household consumes more home-grown food rather than purchased food items, mainly if the households cultivate cereals, root and tubers, vegetables and legumes, which are the common food groups that are both mainly cultivated and consumed by smallholder agricultural households in Nigeria. This submission is similar to the findings of Fawole et al. (2016).
Determinants of food security status among the agricultural household
The effects of access to basic services and productive assets on the food security of agricultural households were analysed using the logistic regression model. Table 7 presents the estimated coefficient, the marginal effects, standard errors, z-values and p-values. The estimated Chi-square value of the logistic regression was 117.920 with a p-value of 0.0000; the likelihood ratio statistics indicated the overall fitness of the model. It was found that age, household size, marital status, number of household members in the farming operation, membership of the cooperative society, extension contacts, access to credit, land ownership, land right, distance to the private health centre, distance to public health centre are the significant predictors of agricultural households’ food security status (Table 7).
The household head’s age coefficient shows a positive and significant (p<0.05) influence of the household head’s age on the household food poverty status. This suggests that an additional age by the household head will increase the household’s likelihood of food insecurity by 1.4%. This could be because, as a farmer gets older, the ability to carry out farming activities diminishes and thus worsen their food insecurity. This contradicts our apriori expectation and the results of Abdullah et al. (2019).
Household size has a positive and significant (p<0.01) correlation with the household food security status, indicating that an additional person will raise the household’s likelihood of food poverty by 15.3%. Arguably, households whose additional members are not economically active (15-64 years) will have more mouths to feed, which could negatively affect per capita income, expenditure, and food consumption (Aidoo et al., 2015).
The negative coefficient of marital status significantly (p<0.05) influenced household food security status. This suggests that households whose heads are married have a lesser probability of being food insecure by 15.7% than their unmarried counterparts. Expectedly, married couples have a better chance of pooling their resources, making it easier for them to dedicate a reasonable portion of their income to household consumption.
Table 7: Logistic regression results for the effect of access to basic services and productive assets on household food security status.
|
Variable |
Y (dy/dx) |
Coefficient |
Standard error |
z-statistics |
p value |
|
Gender |
0.033 |
0.294 |
0.865 |
0.34 |
0.734 |
|
Age |
0.014 |
0.116** |
0.063 |
1.83 |
0.067 |
|
Household size |
0.153 |
1.303*** |
0.438 |
2.98 |
0.003 |
|
Marital Status |
-0.157 |
-1.337** |
0.656 |
-2.04 |
0.042 |
|
Year of education |
-0.004 |
-0.035 |
0.096 |
-0.36 |
0.719 |
|
No. of house members in the farm operation |
-0.118 |
-1.002** |
0.416 |
-2.41 |
0.016 |
|
Cooperative membership |
-0.469 |
-3.995*** |
0.921 |
-4.34 |
0.000 |
|
Extension contacts |
-0.056 |
-0.481** |
0.190 |
-2.53 |
0.011 |
|
Access to credit |
-0.288 |
-4.540*** |
1.450 |
-3.13 |
0.002 |
|
Remittances |
-0.002 |
-0.016 |
0.044 |
-0.36 |
0.721 |
|
Land ownership |
-0.293 |
-4.045*** |
1.332 |
-3.04 |
0.002 |
|
Land right |
0.192 |
1.637** |
0.739 |
2.22 |
0.027 |
|
Distance to the private health centre |
0.720 |
6.133*** |
2.016 |
3.04 |
0.002 |
|
Distance to the public health centre |
0.116 |
0.986** |
0.387 |
2.55 |
0.011 |
|
Constant |
-4.335*** |
3.490 |
-1.24 |
0.214 |
|
|
No of observation |
183 |
||||
|
LR chi2(14) |
117.920 |
||||
|
Probability>Chi2 |
0.000 |
||||
|
Log-likelihood |
-66.175 |
||||
|
Pseudo R2 |
0.471 |
***Significance at 1% level, **Significance at 5% level, *Significance at 10% level.
The number of household members in farming operations negatively and significantly determines the household food security status. It implies that an additional one household member in a farming operation will reduce the household’s probability of being food insecure by 11.8%, thus, indicating that having an additional working-age household member will contribute positively and significantly to achieving the household’s food security status.
The coefficient of household membership in a cooperative society has a negative and significant (p<0.01) effect on household food insecurity. This shows that a household with a cooperative society member will likely be more food secure than its counterpart and vice-versa. As revealed by the marginal effect estimate, a household with cooperative membership has a 46.9% chance of being food secure. A plausible reason is that cooperative society members usually benefit from cooperative societies’ welfare-enhancing services. This corroborates the findings of Kehinde and Kehinde (2020), that cooperative membership increases the likelihood of food security status of rural households in Southwestern Nigeria.
Access to extension services negatively correlates with agricultural household food security status. The result suggests that having access to extension services could reduce households’ food insecurity by 5.6%. Agricultural households would likely benefit from agricultural extension services in improved access to quality production inputs, production techniques, and other incentives, all of which positively impact their output and, in turn, improve food security status (Amaza et al., 2006).
Access to credit relates significantly (p<0.01) and negatively to food insecurity, indicating that access to credit facilities reduces the likelihood of agricultural households being food insecure by 28.8%. Access to credit facilities enables farm households to contribute significantly to investing in high-quality and productivity-enhancing inputs resulting in increased farm revenue and food security. The result corroborates the findings of Kehinde and Kehinde (2020), that access to credit raises the food security of rural households in Southwestern Nigeria.
Land ownership is negatively and significantly (p<0.01) related to food insecurity, implying that land ownership by agricultural households results in a 29.3% reduced likelihood of food insecurity compared to agricultural households without land ownership. The land is an important household asset for agricultural and non-agricultural use, and owning land empowers the household to control what to cultivate and the extent of under cultivation. Also, land can be used for various non-agricultural related purposes, such as collateral when seeking a loan and a source of resilience when faced with shocks.
The coefficients of distance to private and public hospitals indicate that distances to private and public hospitals significantly positively correlated with food insecurity. The respective marginal effects indicated that households living farther from private and public hospitals are 2.7%, and 1.2% are more likely to be food insecure. This result suggests that living further from the health centre can increase the associated cost of healthcare, such as transportation costs, thereby leaving the household with the choice of rationing the available monetary resources between healthcare and food consumption.
Conclusions and Recommendations
The study examined the effect of access to basic services and productive assets on dietary diversity and food poverty among smallholder agricultural households in Ogun State, Nigeria. The result shows that over three-quarters of the surveyed agricultural households’ diet is highly diverse, with cereal, root and tuber, vegetable, oil/fat and meat being the most commonly consumed food categories. Over half of the sampled agricultural households were food poor (food insecure), with a poverty gap index and poverty severity of 0.27 and 0.19, respectively. Furthermore, adequate access to basic services and productive assets could increase household dietary diversity and reduce food insecurity. Therefore, the study recommended that stakeholders rally support for smallholder agricultural households in Ogun state by.
- Assisting households in accessing health centres in their local communities to reduce out-of-pocket health care costs, which would increase household food consumption resources.
- Implementing policies to ensure equal land redistribution among agricultural households in order to cultivate crops with economic value.
- Assisting agricultural households in obtaining affordable credit from formal and non-formal financial institutions, to enhance agricultural investment for increased productivity and income.
- Strengthening extension service delivery through institutional support to facilitate efficient agricultural resource management.
Acknowledgements
We thank the anonymous reviewers and our colleagues from the Department of Agricultural Economics and Farm Management, FUNAAB, for providing valuable comments that greatly improved the manuscript.
Novelty Statement
This research work provides the basis for formulating economic policies that improve household dietary diversity and reduce food insecurity through the provision of access to basic services and productive assets.
Author’s Contribution
All authors contributed to the conceptualisation, methodology, data collection and analysis, interpretation of results and writing of the original draft.
Conflicts of interest
The authors have declared no conflict of interest.
References
Abdullah, D., Zhou, T., Shah, S., Ali, W., Ahmad, I.U.D. and A. Ilyas. 2019. Factors affecting household food security in rural northern hinterland of Pakistan. J. Saudi Soc. Agric. Sci. 18:201–210.
Abu, G.A. and A. Soom. 2016. Analysis of factors affecting food security in rural and urban farming households of Benue State, Nigeria. Int. J. Food Agric. Econ., 4: 55–68.
Adekoya, O.A., 2014. Analysis of farm households poverty status in Ogun States, Nigeria. Asian Econ. Financ. Rev., 4: 325–340.
Agbadi, P., H.B. Urke and M.B. Mittelmark. 2017. Household food security and adequacy of child diet in the food insecure region north in Ghana. PLoS One, 12: e0177377. https://doi.org/10.1371/journal.pone.0177377
Aidoo, R., J.O. Mensah and T. Tuffour. 2015. Determinants of household food security in the Sekyere-afram plains district of Ghana. 1st Annual International Interdisciplinary Conference, AIIC 2013. Azores, Portugal. pp. 24–26
Akerele, D., S. Momoh, A.B. Aromolaran, C.R.B. Oguntona and A.M. Shittu. 2013. Food insecurity and coping strategies in South-West Nigeria. Food Secur., 5: 407–414. https://doi.org/10.1007/s12571-013-0264-x
Amaza, P.S., J.C. Umeh, J. Helsen and A.O. Adejobi. 2006. Determinants and measurement of food insecurity in Nigeria: Some empirical policy guide. Contributed Poster prepared for presentation at the International Association of Agricultural Economists Conference. International Association of Agricultural Economists, Gold Coast, Australia. pp.1–15.
Annim, S.K. and R.B. Frempong. 2018. Effects of access to credit and income on dietary diversity in Ghana. Food Secur. 10:1649–1663.
Anthony, L., O.O. Alabi, E.S. Ebukiba and V. Gamba. 2021. Factors influencing output of rice produced and choice of marketing outlets among smallholder farming households, Abuja, Nigeria. Sarhad J. Agric. 37: 262–277. https://doi.org/10.17582/journal.sja/2021/37.1.262.277
Ayinde, I.A., D. Akerele, S.A. Adewuyi and M.O. Oladapo. 2012. Can food calorie be an index for poverty in a rural economy? An extrapolation from farm households in Ogun State, Nigeria. Int. J. Consum. Stud., 36: 688–695. https://doi.org/10.1111/j.1470-6431.2011.01046.x
Bidisha, S.H., A. Khan, K. Imran, B.H. Khondker and G.M. Suhrawardy. 2017. Role of credit in food security and dietary diversity in Bangladesh. Econ. Anal. Pol., 53:33–45.
Demenge, J., R. Alba, K. Welle, K. Manjur, A. Addisu, L. Mehta and K. Woldearegay. 2015. Multifunctional roads: The potential effects of combined roads and water harvesting infrastructure on livelihoods and poverty in Ethiopia. J. Infrastruct. Dev., 7: 165–180. https://doi.org/10.1177/0974930615609482
Dereje, D., T. Degefa and S. Abrham. 2021. Household dietary diversity in rural households of Oromia Regional state, Ethiopia: A cross-sectional study. J. Dev. Agric. Econ. 13:304–313.
Emokaro, C.O. and D.E. Oyoboh. 2016. Impact of rural infrastructure on the livelihood of smallholders in agrarian communities in Edo state, Nigeria. Invited paper presented at the 5th International Conference of the African Association of Agricultural Economists. African Association of Agricultural Economists, Bahir Dar.
Ezeabasili, A.C.C., I.E. Iloghalu and A.I. Ezeabasili. 2014. Relevant Infrastructure for Improved Food Security in Flood Plains of Anambra State, Nigeria. Int. J. Sci. Technol., 3: 86–109. https://doi.org/10.4314/stech.v3i3.8
FAO, 2010. Guidelines for measuring household and individual dietary diversity. Food and Agriculture Organisation, Rome.
FAO. 2015. The state of food insecurity in the world meeting the 2015 interation hunger targets: Taking stock of uneven progress. Rome.
Fawole, W.O., B. Ozkan and F.A. Ayanrinde. 2016. Measuring food security status among households in Osun State, Nigeria. Br. Food J. 118:1554–1567.
Foster, V. and N. Pushak. 2011. Nigeria’s infrastructure: A continental perspective. The World Bank. https://doi.org/10.1596/27257
Foster, J., J. Greer and E. Thorbecke. 1984. A Class of decomposable poverty measures. Ecometric Soc., 52: 761–766.
Global Hunger Index, 2021. Global Hunger Index 2021: Nigeria.
Ibrahim, S.B., D. Akerele, F.P. Oyawole, O.J. Uthman and R.O. Aminu. 2019. Effect of non-farm income on poverty status of farm households in Ogun state, Nigeria. Niger. J. Agric. Food Environ., 15: 40–49.
Iqbal, M.A., A. Abbas, R. Ullah, U.I. Ahmed, A. Sher and S. Akhtar. 2018. Effect of non-farm income on poverty and income inequality: Farm households evidence from Punjab Province Pakistan. Sarhad J. Agric., 34: 233–239. https://doi.org/10.17582/journal.sja/2018/34.2.233.239
Jamaludheen, A., D.R. Singh, S.P. Subash and K.S. Aditya. 2022. Farmers investment on productive assets in rural India: Composition and determinants. Indian J. Agric. Econ. 77.
Kehinde, A. and M. Kehinde. 2020. Impact of credit access and cooperative membership on food security of rural households in Southwestern, Nigeria. J. Agribus. Rural Dev. 57.
Kiboi, W., J. Kimiywe and P. Chege. 2017. Determinants of dietary diversity among pregnant women in Laikipia County, Kenya: A cross-sectional study. BMC Nutr. 3:1–8.
Luckett, B.G., F.A.J. DeClerck, J. Fanzo, A.R. Mundorf and D. Rose. 2015. Application of the nutrition functional diversity indicator to assess food system contributions to dietary diversity and sustainable diets of Malawian households. Public Hlth. Nutr. 18:2479–2487.
Mango, N., B. Zamasiya, C. Makate, K. Nyikahadzoi and S. Siziba. 2014. Factors influencing household food security among smallholder farmers in the Mudzi district of Zimbabwe. Dev. South Afr., 31: 625–640. https://doi.org/10.1080/0376835X.2014.911694
Metu, A.G., K.O. Okeyika and O.D. Maduka. 2016. Achieving sustainable food security in Nigeria: Challenges and Way Forward. 3rd International Conference on African Development Issues. Covenant University Press, Ota. pp. 182–187.
Microsoft, 2021. Microsoft Excel Office 365.
Muhammad-Lawal, A., H.K. Ibrahim, W.O. Oloyede, K.Y. Belewu and T.A. Adesina. 2017. Assessment of Dietary Diversity and Food Calorie Consumption among Rural Households in Kwara State, Nigeria. Appl. Trop. Agric., 22: 134–141.
Obayelu, A.E., T. Olarewaju and N. Oyelami. 2014. Effect of rural infrastructure on profitability and productivity of cassava-based farms in Odogbolu local government area, Ogun state, Nigeria. J. Agric. Sci. Belgrade, 59: 187–200. https://doi.org/10.2298/JAS1402187O
Ogun State, 2020. Profile of Ogun State. Official Website of the Ogun State Government, Nigeria. Available at www.ogunstate.gov.ng.
Olayiwola, L.M. and O.A. Adeleye. 2005. Rural infrastructural development in Nigeria: Between 1960 and 1990 – Problems and Challenges. J. Soc. Sci., 11: 91–96. https://doi.org/10.1080/09718923.2005.11892499
Omotoso, A.B., S.A. Daud, L. Okojie and A.O. Omotayo. 2022. Rural infrastructure and production efficiency of food crop farmers: Implication for rural development in Nigeria. Afr. J. Sci. Technol. Innov. Dev., 14: 197–203. https://doi.org/10.1080/20421338.2020.1821441
Oni, O.T., 2013. Evaluation of income and employment generation from cassava value chain in the Nigerian agricultural sector. Asian J. Agric. Rural Dev., 3: 79–92.
Onyeneke, R.U., C.C. Emenekwe, N.M. Chidiebere-Mark, J.O. Munonye, J.O. Aligbe, C. Kanu, C.U. Izuogu, C.L. Njoku, U.I. Uwazie, C.O. Uwadoka and G.C. Azuamairo. 2020. Impact of poultry farmers’ participation in modern food retail markets on household dietary diversity: Lessons from southeast nigeria. Animals, 10:1-14
Pritchard, B., A. Rammohan and M. Vicol. 2019. The importance of non-farm livelihoods for household food security and dietary diversity in rural Myanmar. J. Rural Stud., 67: 89–100. https://doi.org/10.1016/j.jrurstud.2019.02.017
Rahji, M.A.Y., 2007. Rural infrastructure, farm output and productivity nexus in a multi-crop economy, the case of Oyo state, Nigeria. Proceedings of the 21st Annual national conference of Farm Management Association of Nigeria. Farm Management Association of Nigeria, Ayetoro.
Shively, G. and A. Evans. 2021. Dietary diversity in Nepal: A Latent Class Approach. Food Nutr. Bull. 42:259–273.
StataCorp, 2021. Stata statistical software: Release 17.
Taruvinga, A., V. Muchenje and A. Mushunje. 2013. Determinants of rural household dietary diversity: The case of Amatole and Nyandeni districts, South Africa. Int. J. Dev. Sustain. 2: 2233–2247.
Udoh, E.S. and E.J. Udoh. 2019. Dietary diversity of households in Akwa Ibom State, Nigeria. Int. J. Dev. Sustain. 8: 722–736.
Umoren, V., E. Ikurekong, A. Emmanuel and A. Udida. 2010. Development of road infrastructure as a tool of transforming Ibiono Ibom local government area. Glob. J. Soc. Sci., 8: 53–59. https://doi.org/10.4314/gjss.v8i2.51582
UNICEF/WHO. 2015. Progress on sanitation and drinking water 2015 update and MDG Assessment. Geneva.
World Economic Forum, 2018. The global competitiveness index report 2017-2018.
To share on other social networks, click on any share button. What are these?


