

Developing Microsatellite Multiplex PCR Panels for Topmouth Culter (Culter alburnus) and their Application in Parentage Assignment


Developing Microsatellite Multiplex PCR Panels for Topmouth Culter (Culter alburnus) and their Application in Parentage Assignment
Jianjun Fu1, Shili Liu2, 3, Wenbin Zhu1, Yongyi Jia2, 3, Lanmei Wang1, Yufen Yang4, Zhimin Gu2, 3*and Zaijie Dong1*

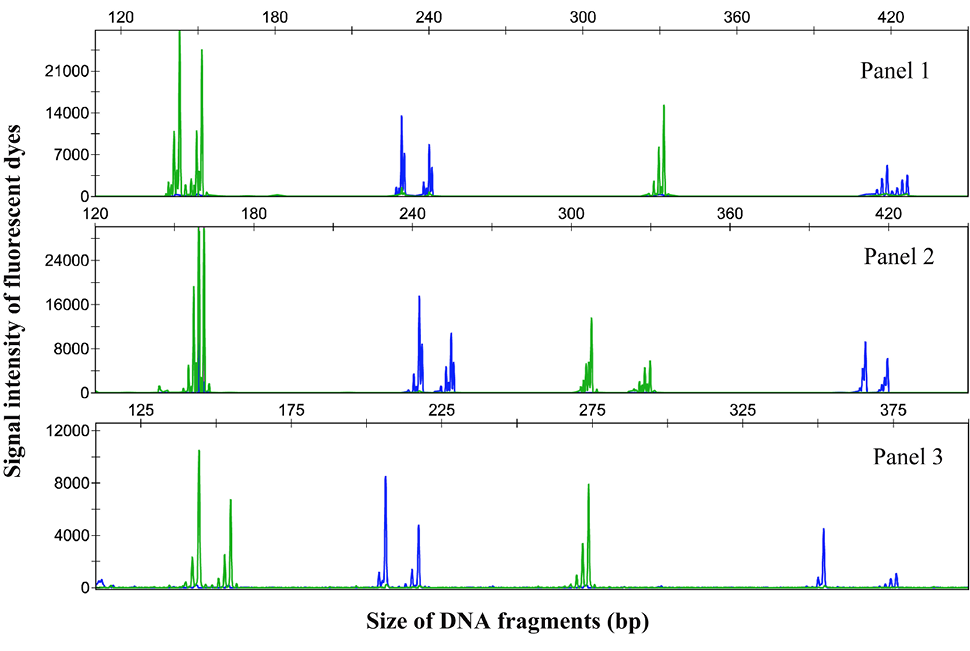
Genotyping chromatograph of microsatellite loci co-amplification of three multiplex panels in C. alburnus individuals, obtained using an Applied Biosystems 3730XL sequencer. Blue and green lines indicate FAM and HEX labels, respectively.

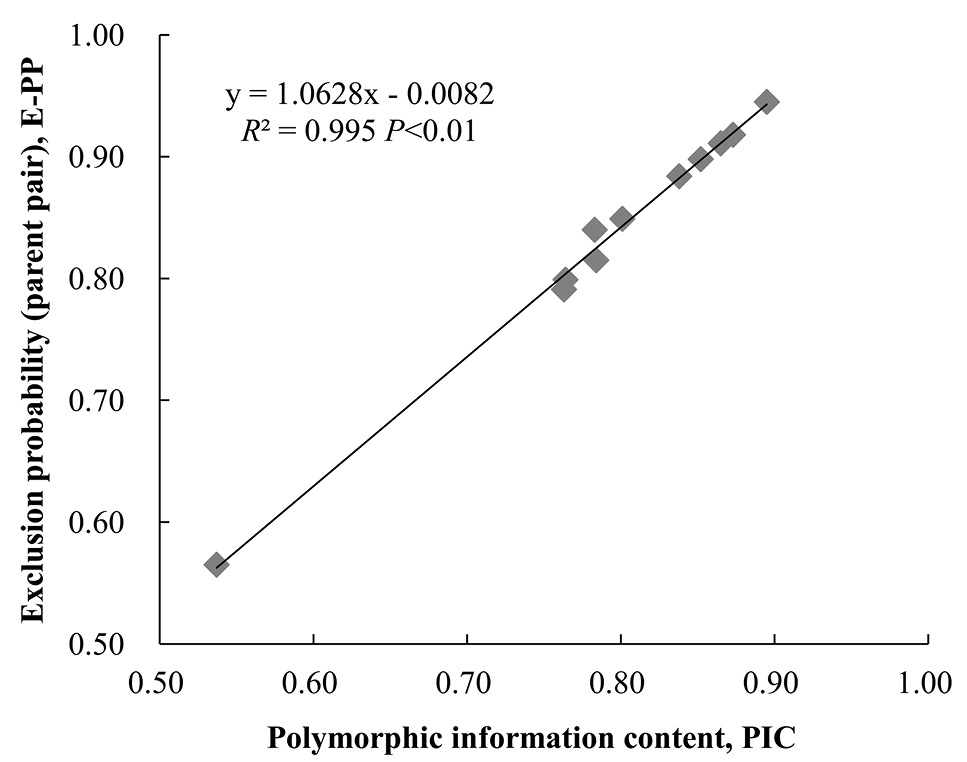
Scatter diagram of polymorphic information content (PIC) and exclusion probability for parent pair (E-PP) of microsatellites.
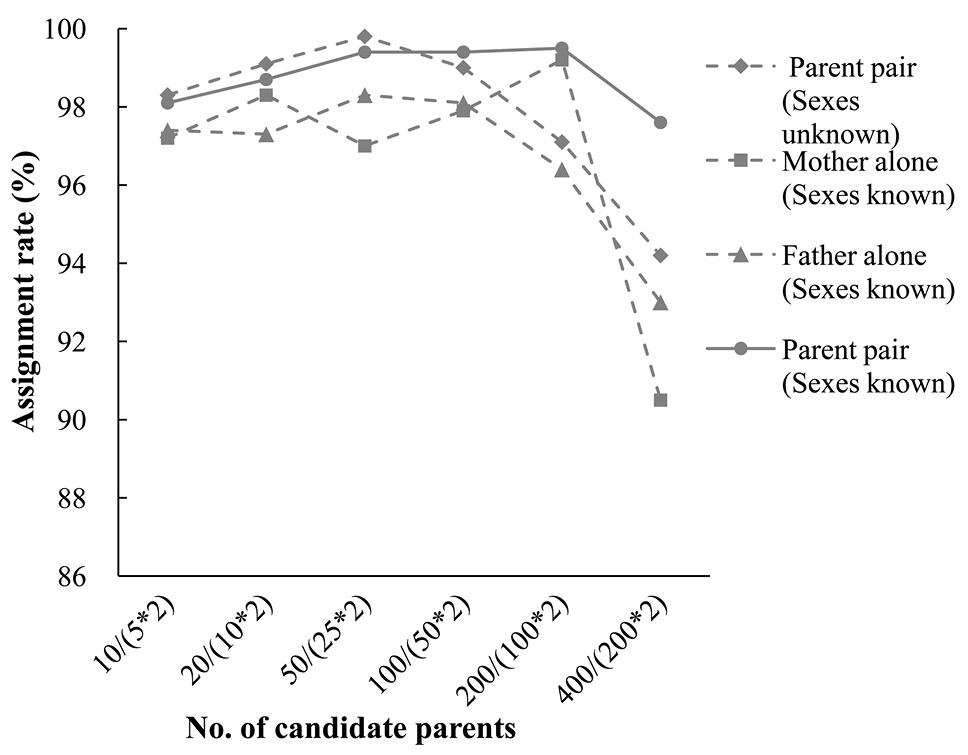
Assignment rates from simulation analysis for parents (parent pairs) based on different number of candidate parents. These range from 10 (or 5 males and 5 females) to 400 (or 200 males and 200 females) sexes unknown (or sexes known) parents (confidence in 95%).
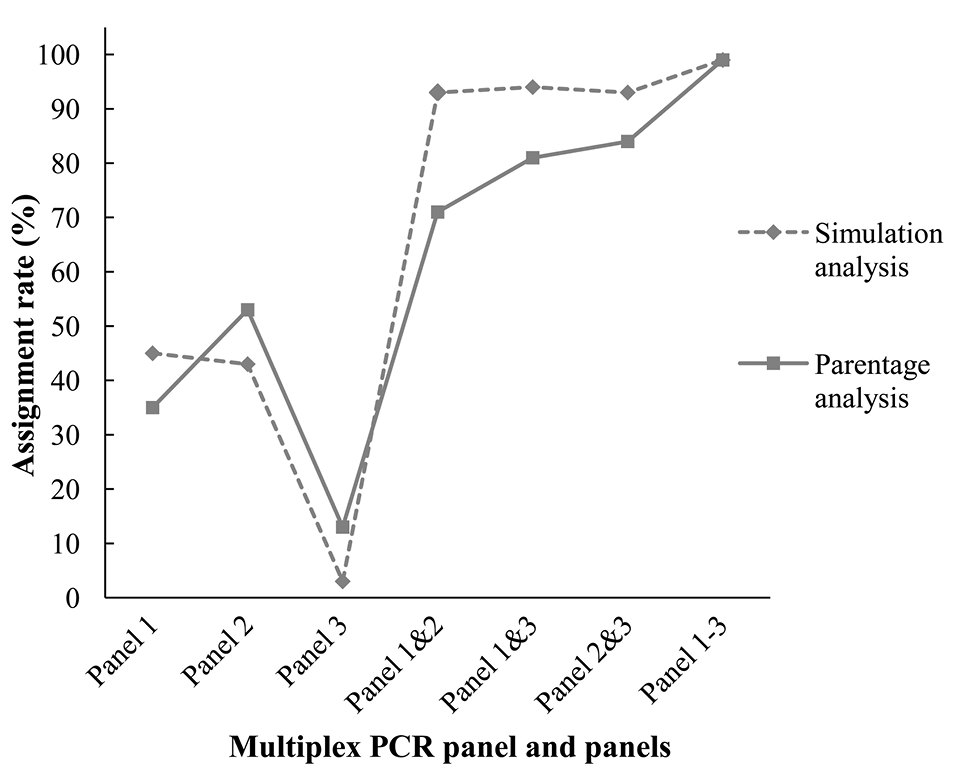
Assignment rates of simulation and parentage analyses based on 36 candidate parents (24 females and twelve males), using genotype information from different multiplex panels and panel combinations (confidence in 95%).

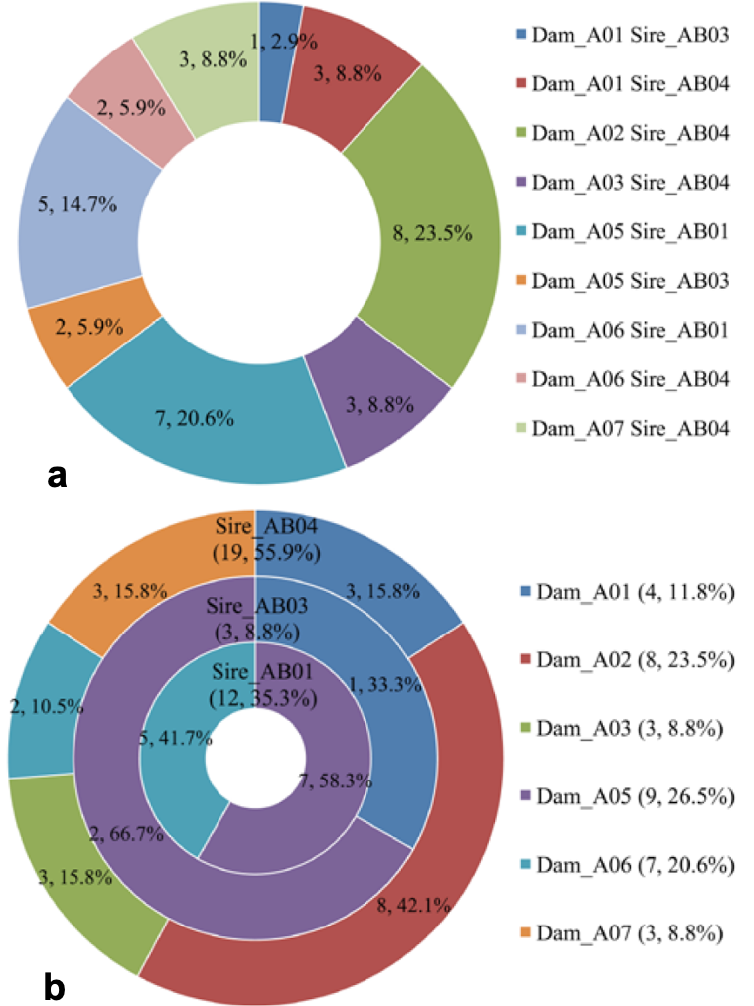
Pie charts of progeny contributions of parent pairs (a) and parents (b) in breeding Pilot A. (a): the numbers and percentages represent the progeny contributions of nine parent pairs (full-sib families). (b): the numbers and percentages within parentheses represent the progeny contributions of six females and three males, and other numbers and percentages represented the contribution of maternal progeny contribution inside three paternal half-sib families (three circles).


