
Determinants and Resource Use Efficiency of Honey Production (Apis mellifera) at Chitwan, Nepal


Research Article
Determinants and Resource Use Efficiency of Honey Production (Apis mellifera) at Chitwan, Nepal
Suman Bhattarai1*, Subodh Raj Pandey2, Jaya Prakash Dutta3, Meghnath Timalsena4 and Rajendra Bam5
1Department of Agricultural Economics, Institute of Agriculture and Animal Science, Tribhuvan University, Kathmandu, Nepal; 2Department of Plant Pathology, Institute of Agriculture and Animal Science, Tribhuvan University, Kathmandu, Nepal; 3Department of Agricultural Economics and Agribusiness Management, Agriculture and Forestry University, Rampur, Chitwan, Nepal; 4Prime-Minister Agriculture Modernization Project (PMAMP), Project Implementation Unit, Bee Zone, Chitwan, Nepal; 5Department of Agribotany and Ecology, Institute of Agriculture and Animal Science, Tribhuvan University, Kathmandu, Nepal.
Abstract | A general survey was accomplished among beekeepers in 2019 to investigate the determinants and resource use efficiency of honey production at Chitwan, Nepal. The information was primarily collected through 60 Apis mellifera beekeepers registered in bee zone, Chitwan. They were selected for interview by simple random sampling technique. Interview using semi-structured questionnaire schedule was carried out for primary data. Cobb Douglas production function, multiple regression, and paired t-test were used for the analysis of collected data. Multiple regression model revealed that family labor (p=0.68), age(p=0.007), family size (p=0.001), experience (p=0.007), harvesting (p=0.000) and maintenance of flowering plants (p=0.057) have significant effect on honeybee productivity. Labour cost and migration cost had positive coefficient and significant relation at 1% level of significance with gross return whereas expenses on baiting materials had positive coefficient and significant relation at 5% level of significance with the gross return. Thirty-six percentage of total visit for foraging of honeybees was contributed by East Chitwan. The overall productivity of honey in 2019 AD (24.06 kg/hive) was found to be 29% lower than that of 2018 AD. Labour cost and migration cost were underutilized and are required for increment by 3.51% and 71.16% respectively regarding revenue maximization and cost on sugar, drug and comb foundation was over-utilized and needed to be reduced by 30.65%. The efficient use of inputs could make it a profitable and viable commercial enterprise.
Received | September 29, 2020; Accepted | May 18, 2021; Published | June 21, 2021
*Correspondence | Suman Bhattarai, Department of Agricultural Economics, Institute of Agriculture and Animal Science, Tribhuvan University, Kathmandu, Nepal; Email: sbhattarai867@gmail.com
Citation | Bhattarai, S., S.R. Pandey, J.P. Dutta, M. Timalsena and R. Bam. 2021. Determinants and resource use efficiency of honey production (Apis mellifera) at Chitwan, Nepal. Sarhad Journal of Agriculture, 37(3): 781-790.
DOI | https://dx.doi.org/10.17582/journal.sja/2021/37.3.781.790
Keywords | Beekeepers, Chitwan, Foraging, Migration and Resource use efficiency
Introduction
The eight species among the nine species of the honeybee in the world live in Asia (Hepburn et al., 2011). In Nepal five species have been reported and are economically important (Paudel, 2003). The rearing of Apis mellifera was initiated in 1995 which was recognized as foundation of modern apiculture (GoN, 1995), Government sector started to provide the data related to honey only from 1996/97 (MOAD, 2017). The contribution of Nepalese honey is only 0.05% to the world market (GTZ, 2014). Neupane (2006) stated that the pollination service provided by honeybee ensures 40 to 140 folds more benefit than the production of honey and related products. Beekeeping is practised in Nepal primarily for the production of honey (NARC, 1996).
In Nepal, honey is the major bee product from which economic benefits are taken. However, its production is seasonal and depends upon various factors such as availability of different bee flora in between the period of November to April, the scale of production, management practices and migration of colonies to various locations (GTZ, 2014). Chitwan is regarded as one of the potential districts for beekeeping regarding bee flora and pasture availability among 30 districts of Nepal (FNBK, 2012). Chitwan possess great potential on beekeeping and more income generates than crop farming (Pokhrel, 2009).
It has been estimated that Nepal could possibly encompass one million bee colonies producing greater than 10,000 metric tons of honey annually (Pokharel et al., 2014). Hence, this study focuses on the determinants and management practices of beekeeping and recommends the probable solutions for its improvement. This study depicts: (i) socio-economic characteristics affecting honey productivity, (ii) evaluate resource-use efficiency, (iii) change in productivity in subsequent years, and (iv) estimate the major foraging areas associated with the apiculture in Chitwan, Nepal.
Materials and Methods
Study site
The command area of Bee Zone, Chitwan was taken as the study area (Figure 1). The Chitwan district covers 221,800 hectares (ha) of land with 1882 ha (8.49%) of bee pasture and flora (DADO, 2018).
This district is located in Bagmati province and its geographical coordinates extend from 20º21’- 27º46’ North latitude and 83º35’- 84º48’ East longitudes. It covers sub-tropical to the tropical climate, thus providing suitable conditions for growing diverse crop species favouring Apis mellifera.
Sample size and sampling technique
The sixty Apis mellifera beekeepers having at least 20 beehives were taken as respondents. The simple random technique was applied for the selection of the sample. It minimizes the biasness and is regarded as the finest way as it considers alike opportunity for selection between the elements from the total population under study.
Rapti and Khaireni Municipality were selected for the pretesting of questionnaire. It involves 10 respondents, which is regarded ordinary (Perneger et al., 2015). The number of beekeepers (n) surveyed was calculated as the sample size by using a simplified formula given by Yemane (1967):
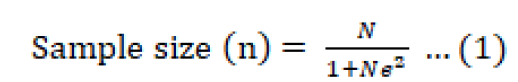
Where;
N= sampling frame (148); e= precision level (0.1)
Adding the values of ‘N’ and ‘e’ in Equation 1.
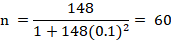
To obtain an appropriate sample size i.e. 60 from the three municipalities proportional allocation sampling technique was used (Bowley, 1926). The proportional allocation technique was also applied by Sajjad et al. (2012) and Ali et al. (2013) which is calculated as:

Where;
Ni= Total number of beekeepers in ith village/municipality; i = Number of villages in the study area; N= Total number of beekeepers in the study area; n= Total sample size from the study area.
The selected sample of beekeepers from each municipality of Chitwan is given in Table 1.
Table 1: Municipality wise distribution of sample farmers in the study area, 2019.
|
District |
Municipality/wards |
No of farmers |
Sample size |
|
Chitwan |
Kalika Municipality (9, 10 and11) |
15 |
6 |
|
Chitwan |
Khaireni Municipality (4, 10 and 11) |
19 |
8 |
|
Chitwan |
Rapti Municipality (1-6 and 10-13) |
114 |
46 |
|
Total |
148 |
60 |
Source: Prime Minister Agriculture Modernization Project (PMAMP), Project Implementation Unit (PIU), Bee zone, Chitwan.
Method of data collection
Interview using semi-structured questionnaire schedule was carried out to obtain the 1st hand data. The focus group discussions (2 FGDs), personal interview and key informants interview (KII) were taken as chief primary source. Two FGDs were conducted with a group of producers including 12 participants in 2019. The publications of topic related articles from numerous institutions were the source of secondary data.
Data analysis methods
The data were collected, tabulated and analyzed. The software involved in this process was MS-Excel and Statistical Package for Social Sciences (SPSS) version 23. Paired t-test, multiple regression analysis and resource-use efficiency were the major tools to measure the stated objectives.
Paired t-test
Paired t-test was used to determine the difference in productivity before and after (Haider et al., 2017).
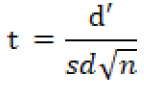
d’ = μ1-μ2
Where;
μ1: Mean of honey productivity in 2018 AD; μ2: Mean of honey productivity in 2019 AD.
Multiple regression analysis
OLS regression model as given by Hayes and Matthes (2009) was considered for examining the factors influencing productivity of honey, as expressed in Equation 2.
Y = α +β1X1+ β2X2+β3X3 +....... β11X11+µ …(2)
Where,
Y = Productivity of honey (kg/hive); Xi = Explanatory variables; µ = Error term; α = Constant (intercept); βi = regression coefficient.
The detailed explanation of variables and the types of measures are presented in Table 2.
Regression diagnostics
Multicollinearity test of the explanatory variables was carried out through the estimation of Variance Inflation Factor (VIF) in OLS model. If the VIF value is 10, then it is suggested as the highest point.
Resource use efficiency
Production function analysis: The production function is defined as a technical relationship connecting factor inputs and outputs (Koutsoyiannis, 1977). The multivariate regression model was applied to estimate the factors affecting honey production. The dependent variable involved in this research was
Table 2: Description of the variables used in the Multiple regression model, 2019.
|
Variables |
Type |
Description |
Value |
|
Dependent variable |
|||
|
Honey productivity |
Continuous |
Average honey production per hive per year |
Kg/hive |
|
Independent variable |
|||
|
Age |
Continuous |
Age of Respondent or decision-maker |
Number of years |
|
Number of hives |
Continuous |
No. of beehive per household |
Number |
|
Family Labor |
Continuous |
Number of family members effectively engaged in beekeeping |
Number |
|
Family Size |
Continuous |
Total number of family members |
Number |
|
Farming Experience |
Continuous |
Total farming experience of the respondent |
Years |
|
Training Received |
Dummy |
Whether the participant has participated in training related to GAP |
1 is attended, 0 is not attended |
|
Member of cooperatives or farmer group |
Dummy |
Membership in cooperatives or farmer group related to beekeeping |
1 if member, 0 if not a member |
|
Access to Credit |
Dummy |
If access to credit (1=yes, 0=otherwise) |
|
|
Subsidy |
Dummy |
Yes=1, Otherwise = 0 |
|
|
Harvesting |
Continuous |
Number per year |
|
|
Maintenance of flowering plants |
Dummy |
1 if farmer maintain cultivation of pollen or/and nectar-rich plants, otherwise 0 |
productivity (Kg/hive) and the independent variable considered were the cost incurred on baiting materials (sugar, drug and comb foundation), labours and migration. Inorder to estimate the impact of different inputs, non-linear production function i.e. Cobb-Douglas function was used and their efficiency on honey productivity due to its ease on comparing partial elasticity coefficient in agricultural research (Prajneshu, 2008).
The production function was established for the examination of productivity and efficiency of resources, which is given below:
Y = f (X1, X2, X3)
Y = a + b1X1 + b2X2+ b3X3 + m [Linear function]
Y= aX1b1 X2b2 X3b3em [Non-Linear (Power function)]
Where;
Y: Gross return/hive [Nepalese Rupees (NRs)] [1 NRs= 121 United States Dollar (USD)]; X1: Migration cost (NRs/hive); X2: Human Labor Cost (NRs/hive); X3: Cost of Bating Materials (i.e. sugar, drug and comb foundation) (NRs/hive); m: Random disturbance term; b1, b2, b3: Coefficients of respective variables; e: Base of natural logarithm; a: Constant term.
The ordinary least square (OLS) technique was applied for the linearization of non-linear production function which is given below:
LnY = lna+b1lnX1+b2lnX2+b3lnX3+m
The ‘ln’ stands for natural logarithm and ‘m’ stands for error term.
Efficiency ratios estimation through Cobb-Douglas production function
The efficiency ratio is defined as the ratio of the Marginal Value Product (MVP) of variable input and the Marginal Factor Cost (MFC) for the input. However, the denominator always sets its value as one, and consequently, the ratio will be equal to their respective MVP (Majumder et al., 2009).
The efficiency of resource use was calculated as:
 (
(MVP = dy/dx
MVPi = bi.Y/Xi
Where;
bi: Estimated regression coefficients; Y and Xi are the values from the geometric mean.
Decision criteria as given by Effiong (2005): If r= 1, then it indicates the efficient or optimum use of resource, if r > 1, then it indicates under-use of resource and, if r < 1, then it indicates the over-use of resource.
The relative percentage change in MVP of each resource can be calculated by:
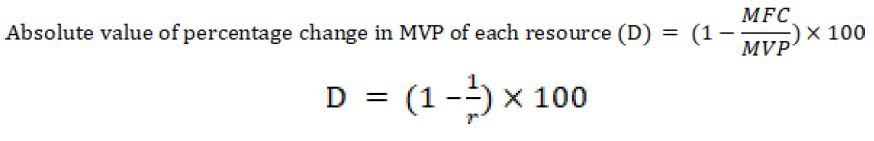
Where,
r: efficiency ratio.
Return to scale analysis (RTS)
RTS provides the technical character of production which investigates productivity changes consequent to the relative change in all inputs. It is obtained by summing up of coefficients (Bajracharya and Sapkota, 2017). For its calculation on honey productivity, coefficients from production function were taken and calculation was done using the formula:
RTS = ∑bi
RTS denotes the return to scale and bi denotes the coefficient of ith independent variables
Results and Discussion
Preferred districts for migration of honeybees
Nine districts were reported as the major foraging areas for honeybees. Among the total 9 foraging area, 36% of total visit for foraging of honey-bees was contributed by East Chitwan among the respondents of the studied area followed by Rupandehi and Sarlahi (Figure 2).
The migration of the honeybees in floral rich areas for proper supply of nectar and pollen plays a vital role for smooth bee enterprise. Selection of those plants which produce the continuous sequence of blossom all over the season are essential for better planning of bee pasture (Delaplane et al., 2010). The major migratory districts for foraging of bees by beekeepers of Chitwan were Dang, Bhairahawa, Makwanpur, Sarlahi and Mahottari in the studied area.
The mentioned plants are the major bee flora among beekeepers of studied area (Table 3). The knowledge level about conservation of biodiversity, pollination and pollinators among the farmers of Nepal are insufficient (Adhikari and Ranabhat, 2003; Thapa, 2002). In four study areas of Chitwan like Megauli, Fulbari, Jutpani and Siddhi, the 252 plant species common for honey bee foraging were identified and it was suggested that the importance must be provided to the potential plant blooming for longer period rather than occupying the huge area (Rijal et al., 2018).
Table 3: The preferred districts for bee migration along with their season and flora.
|
District |
Season |
Flora |
|
Chitwan (Siddhi, Megauli, Jutpani) |
Baishakh-Ashar (April-June) |
Saj(Terminalia elliptica), silk tree/ Padke (Albizia julibrissin), Asare (Osbeckia stellata) , Jamun (Syzgium cumini)), Kyamuna (Syzyzium operculata), Harro (Terminalia chebula), Barro (Terminalia bellerica), Sal (Shorea robusta) |
|
Chitwan |
Ashar-Ashoj (June-September) |
Artificial feed |
|
Dang |
Ashoj- Mangsir (September-November) |
Rapeseed (Brassica campestris var toria) |
|
Bhairahawa |
Poush-Magh (December-January) |
Rapeseed (Brassica campestris var toria) |
|
Chitwan (Shaktikhor), Makwanpur(Silinge) |
Mangsir- Magh (November-January) |
Chuiri/ Indian butter tree (Diploknema butyracea) |
|
Lumbini |
Poush- Falgun (December-February) |
Tora (Cassia tora), Rudilo (Pogostemon glaber) |
|
Chitwan ( Megauli) |
Magh-Falgun (January-February) |
Buckwheat (Fagopyrum esculentum) |
|
Sarlahi, Mahottari (Bardibas) |
Falgun- Baishakh (February-April) |
Rudilo (Pogostemon glaber), Sissoo (Dalbergia sissoo), Masala (Eucalyptus citriodora) |
Source: Focus Group discussion.
Most of the beekeepers having long time experiences have higher local understanding on plant types and honey quality (Ranabhat, 2010). The flowering plant species of the region possessing high values as bee foraging are essential (Baptist and Punchihewa, 1980). Jacobs et al. (2006) focused his studies on various species of bee flora along with other adaptable species for treating ruined watershed spots of Megauli, Chitwan.
Mean comparison of the productivity of honeybee
The overall productivity of honey in 2019 AD (24.06 kg/hive) was found to be 29% lower than that of the previous year (33.5 kg/hive). The previous reporting (36 kg/hive) was higher than the present estimation in Chitwan, Nepal (Dhakal et al., 2017), 34.6 kg/hive in Bardiya, Nepal (Shrestha, 2017), 33.02 kg/hive in Chitwan, Nepal (Paudel, 2003), 28.7 kg/ hive in Chitwan, Nepal (Pokhrel, 2009), 40 kg/hive in Haryana, India (Sain and Nain, 2017), 58.97 kg/hive in Alberta (Laate, 2016) and 63 kg/hive in Bhutan (Partap et al., 2017) (Table 4).
Table 4: Mean comparison of the productivity of honeybee in 2018 and 2019 in the study area.
|
Productivity in the year 2018 |
Productivity in the year 2018 |
T value |
df |
P value |
|
33.5 (9.86) kg/hive |
24.06 (9.22) kg/hive |
5.038*** |
59 |
.000 |
Figure in parentheses represent standard deviation and *** Significant at 1% level.
Socio-economic factors affecting honey productivity
To analyze the effect of various explanatory variables on total honey productivity, the multiple regression model was used. Likewise, various household characteristics and socio economic were regressed on total honey productivity. The coefficient of multiple determination, R square (R2) was found 0.659, which shows that 65.9% of the variation in the dependent variable i.e. honey productivity is explained by the independent variables. The F-statistics, F(11, 48)= 8.421, Prob>F= 0.000 shows the steadiness of the general regression equation and joint significant at 1% level. The mean Variance Inflation Factor was 1. 582, and none of the variables exceeded 2.141. It indicates that there is no such multicollinearity between the independent variables which could affect the interpretations that the model has revealed (Table 5).
The function which demonstrates the factors influencing the adoption of related technologies was shown below:
Y= 9.448+(4.850)X1+(-0.312)X2 +1.018X3 +0.444X4+(-0.075)X5 +5.090X6+(-4.220)X7+ 2.059X8+(-2.005)X9+2.943X10+( -1.857)X11+µ
Age of the apiculture farmers was significant at 1% level and the age was negatively related to the productivity. It was expected because beekeeping was practiced more by young beekeepers rather than aged farmers.
Harvesting of honey by producers shoed positive with the quantity of honey produced per hive at 1% level. It demonstrated that the higher honey production will reduce the harvesting duration by increasing harvesting number per year.
Table 5: Socio-economic factors affecting honey productivity in the study area, 2019.
|
Variables |
Coefficients |
Std. Error |
t-value |
P-value |
Collinearity statistics |
|
|
Tolerance VIF |
||||||
|
Constant (α) |
9.448 |
.786 |
.436 |
|||
|
Family Labor (X1) |
4.850* |
.180 |
1.870 |
.068 |
.765 |
1.308 |
|
Age (X2) |
-.312*** |
-.346 |
-2.829 |
.007 |
.476 |
2.100 |
|
Family size(X3) |
1.018*** |
.348 |
3.627 |
.001 |
.773 |
1.293 |
|
Experience(X4) |
.444*** |
.314 |
2.803 |
.007 |
.567 |
1.763 |
|
Number of hives(X5) |
-.075** |
-.264 |
-2.136 |
.038 |
.467 |
2.141 |
|
Harvesting(X6) |
5.090*** |
.605 |
6.250 |
.000 |
.758 |
1.319 |
|
Maintenance of flowering plants(X7) |
-4.220* |
-.190 |
-1.949 |
.057 |
.747 |
1.338 |
|
Training(X8) |
2.059 |
.072 |
.754 |
.455 |
.774 |
1.292 |
|
Member(X9) |
-2.005 |
-.107 |
-1.099 |
.277 |
.756 |
1.323 |
|
Credit(X10) |
2.943 |
.155 |
1.467 |
.149 |
.637 |
1.571 |
|
Subsidies(X11) |
-1.857 |
-.101 |
-.855 |
.397 |
.513 |
1.950 |
*** Significant at 1% level; ** Significant at 5% level; * Significant at 10% level.
Household size was significant and positively related to output at 1% probability level. It indicated that the increase in household size increases the output which is similar to the findings of Okpokiri et al. (2015). This is because the family members are utilized as a means of labour and has more hands to work in the farm as workers. Participation of family members as labourers was significant at 10% and positively associated with productivity. The productivity of agricultural commodity gets positively influenced by the quantity of active members.
Experience in beekeeping was significant at 1% and positively associated with productivity. This is similar to the finding by Mujuni et al. (2012). Similarly, Tijani et al. (2011) reported that the more increased involvement in farming, the farmer becomes more responsive to novel production techniques which increases the productivity.
|
Summary statistics |
|
|
No. of observation |
60 |
|
R square |
0.659 |
|
Adjusted R square |
0.580 |
|
Variance Inflation Factor (VIF) |
1.582 (Mean VIF) |
|
F value |
F(11, 48) =8.421, Prob > F= 0.0000 |
Beehive number was significant at 5% level; it was negatively associated with productivity. Farmers were unable to manage the large hive numbers properly as expected.
Maintenance of floral plants either rich in nectar or pollen or both was significant at the 10% probability level; it was negatively associated to the total honey production. This is not in favor of the priori expectation of positive association but the result can be accepted because the association between the cultivation of plants and their use for proper foraging was not being established as expected.
Resource productivity on beekeeping
Among the three variables, two of them were significant at 1% level and the third was significant at 5% level. It indicated that, if we increase migration cost by 100%, then it will increase the gross return by 53.6%. Similarly, with a 100% increase in expenditure on labour cost and expenditure on sugar, drug and comb foundation, then it increases the gross return by 14.8% and 11.2%, respectively.
The coefficient of multiple determination (R2) was 0.756. About 75.6% of variations in gross return have been explained by the independent variables. Similarly, the adjusted R square value being 0.743 indicating that on accounting the degree of freedom (df), 74.3% of the variation in the dependent variable explained by the independent variables. The overall significance of the anticipated regression F value was 57.816 indicating that factor variance was 57.816 times more than error variance and it was significant at 1% level entailing that all the explanatory variables included in the model were vital for clarifying the variation in the gross income per hive among the beekeepers.
The sum of the coefficients of different inputs stood at 0.836 for honey production (Table 6). This indicates that the income can be increased by 79.6% with 100% increase in all the specified inputs of the production model. This decreasing return to scale is in contrast with the findings of Laate (2016) but supported by Dhakal et al. (2017) and Shrestha (2017) who estimated returns to scale as 0.813 in honey production of Chitwan and Bardiya districts, respectively.
Table 6: Estimated values of coefficients and related statistics of the Cobb-Douglas production function of beekeeping.
|
Factors |
Coefficient |
Standard error |
t value |
P value |
|
Constant |
3.367*** |
0.499 |
6.746 |
0.000 |
|
Migration cost (NRs/hive) |
0.536*** |
0.101 |
5.313 |
0.000 |
|
Human labor cost (NRs/hive) |
0.148*** |
0.051 |
2.900 |
0.005 |
|
Expenditure on sugar, drug and comb foundation (NRs/hive) |
0.112** |
0.046 |
2.421 |
0.019 |
|
F-value |
57.816*** |
0.000 |
||
|
R square |
0.756 |
|||
|
Adjusted R-square |
0.743 |
|||
|
Return to scale |
0.796 |
Note: *** indicates significant at 1% level of confidence and ** indicates significant at 5% level of confidence.
Table 7: Estimates of measures of technical efficiency of inputs used in beekeeping.
|
Inputs |
Geometric mean |
Coefficient |
MVP |
MFC |
MVP/ MFC |
Efficiency |
Percent adjustment required |
|
Migration cost (NRs/hive) |
1438.897 |
0.536 |
3.468 |
1.00 |
3.468 |
Under-utilized |
71.16 |
|
Human labour cost (NRs/hive) |
1337.241 |
0.148 |
1.036 |
1.00 |
1.036 |
Under-utilized |
3.51 |
|
Expenditure on sugar, drug and comb foundation (NRs/hive) |
1327.898 |
0.112 |
0.765 |
1.00 |
0.765 |
Over-utilized |
-30.65 |
Resource use efficiency of inputs used in beekeeping
The proportion of MVP to MFC of the expenses on baiting materials was positive and smaller than one indicating the overuse of this resource. Here, labour used in honey production have a positive and significant relationship with the productivity which was also supported by Shrestha (2017) as well as (Dhakal et al., 2017) but Ahmad et al. (2015) reported it as negative and insignificant. Migration cost had a positive and significant effect on productivity, which is supported by Paudel (2003), Dhakal et al. (2017) as well as Shrestha (2017). Here, expenditure on sugar, drug and comb foundation used in honey production had positive and significant relation with productivity. This result is similar to the findings of Devkota et al. (2016) and Shrestha (2017), as they reported a positive and significant relation but in contrast with the findings of Laate (2016). Similarly, the proportions of MVP to MFC of the migration cost and human labour cost were positive and greater than one, which demonstrated their under-utilization. Here, expenditure on sugar, drug and comb foundation was over-utilized, so it was necessary to be reduced by 30.65% which is a contrast to the result of Dhakal et al. (2017) and Shrestha (2017). But expenditure on labour and migration cost was underutilized and are required to be increased by 3.51% and 71.16% respectively (Table 7) which is supported by Dhakal et al. (2017) and Shrestha (2017).
Conclusions and Recommendations
The resource use efficiency on apiculture enterprise depicts that all the explanatory inputs considered were inefficiently utilized. So, in order to achieve an economic advantage, the primarily outlay on drug, sugar and comb foundation needs to be reduced and increase the use of human labour and migration for foraging. Additional pollen supplement from maize and other pollen-rich crops should be used to meet their nutritional requirement by preparing and following efficient floral calendar. The proper and efficient utilization of inputs could leads to a highly profitable and viable commercial enterprise in near future.
The genetic potential of queen bee was found to be decreasing in comparison to the previous year as well as farmers who have insured their honeybees were almost nil, so further researches should be focused on estimating the strength of honeybees as well as various aspects affecting insurance of honeybee enterprise.
Acknowledgements
The Agriculture and Forestry University, Rampur, Chitwan and Prime Minister Agriculture Modernization Project (PMAMP) were the major institution responsible for financial support. Along with this, we would like to acknowledge Dr. Yubak Dhoj G.C., Assoc. Prof. Shiva Chandra Dhakal and Mr. Anish Shrestha for their encouraging words, constructive comments and facilitation with indefinite ideas throughout our research period.
Novelty Statement
This study employed Cobb-Douglas production function to approximate the determinants on gross return from honeybee enterprise at Chitwan, Nepal. Results suggested the increase in labour and migration cost with decrease in bating materials cost would boost up the gross return. Likewise, the impacts of socioeconomic variables on honeybee productivity provide an important insight for researchers and extension workers. Moreover, it provides overview of preferred districts for bee mi-gration including the seasons and flora.
Author’s Contribution
Suman Bhattarai: Involved in the major process of the research beginning from the preparation of questionnaire, data collection, analysis and interpretation. Likewise, he was involved in the preparation of manuscript to final publication.
Subodh Raj Pandey: Involved in the preparation of questionnaire, data analysis and interpretation. Along with this, he was involved in the preparation of manuscript to final publication.
Jaya Prakash Dhutta: Major supervisor, provided valuable feedback during the entire research period.
Meghnath Timilsena: Site supervisor, provided direct link with beekeepers and also provided constant guidance and support.
Rajendra Bam: He was involved in data cleaning, final editing and correction of manuscript.
Conflict of interest
The authors have declared no conflict of interest.
References
Adhikari, S. and N. Ranabhat. 2012. Bee Flora in Mid Hills of Central Nepal. Bot. Orient. J. Plant Sci., 8: 45–56. https://doi.org/10.3126/botor.v8i0.5558
Ahmad, O.S., O.O. Alabi and P.O. Daniel. 2015. Resource-use efficiency of honey production in Kachia Local Government Area, Kaduna-State, Nigeria. J. Agric. Stud., 4(1): 117-126. https://doi.org/10.5296/jas.v4i1.8790
Ali, G., S.M.A. Shah, D. Jan, M, Fayaz, I. Ullah and M.Z. Khan. 2013. Technical efficiency of sugarcane production in district Dera Ismail Khan. Sarhad J. Agric., 29(4): 585-590.
Bajracharya, M. and M. Sapkota. 2017. Profitability and Productivity of Potato (Solanum tuberosum) in Baglung District, Nepal. Agric. Food Secur., 6: 47(2017). https://doi.org/10.1186/s40066-017-0125-5
Baptist, B.A. and R.W.K. Punchihewa. 1980. A preliminary analysis of the principal factors which will affect apiary honey production in Sri Lanka. Proc. 2nd Conf. Apic. Trop. Clim., New Delhi, pp. 75-81.
Bowley, A.L., 1926. Measurements of precision attained in sampling. Amsterdam: Bull. Int. Stat. Inst.
Croppenstedt, A. and C. Muller. 2000. The impact of farmers’ health and nutritional status on their productivity and efficiency: Evidence from Ethiopia. Econ. Dev. Cult. Change, 48(3): 475-502. https://doi.org/10.1086/452607
DADO, 2018. Annual agricultural development program and statistical year book. Bharatpur, Chitwan, Nepal: District Agriculture Development Office (DADO).
Delaplane, K.S., P.A. Thomas and W.J. McLaurin. 2010. Bee Pollination of Georgia Crop Plants. University of Georgia Cooperative Extension Bulletin 1106. https://athenaeum.libs.uga.edu/bitstream/handle/10724/12165/B1106.pdf?sequence=1
Devkota, K., S.C. Dhakal and R.B. Thapa. 2016. Economics of beekeeping as pollination management practices adopted by farmers in Chitwan District of Nepal. Agric. Food Secur., 5: 6(2016). https://doi.org/10.1186/s40066-016-0053-9
Dhakal, S.C., P.P. Regmi, R.B. Thapa, S.K. Sha and D.B. Khatri-Chhetri. 2017. Allocative Efficiency of Resources Use on Beekeeping in Chitwan District of Nepal. Int. J. Environ. Agric. Biotechnol., 2(4): 1447-1451.
Effiong, E.O., 2005. Comparative analysis of large and small scale farmers resource use efficiency in food crop production in Akwa-Ibom State, Nigeria. J. Agric. Food Sci., 3(1): 75-84. https://doi.org/10.4314/jafs.v3i1.41632
FNBK, 2012. Mauripalan Directory-2012. Bharatpur, Chitwan: Federation of National Beekeepers.
GoN, 1995. Annual report, 1994-1995. Kathmandu: Ministry of Agriculture and Cooperatives, Department of Agriculture, Government of Nepal (GoN).
Goni, M., S. Mohammed and B.A. Baba. 2007. Analysis of resource-use efficiency in rice production in the lake chad area of Borno State, Nigeria. J. Sustain. Dev. Agric. Environ., 3(2): 31-37.
GTZ, 2014. Honey subsector-value chain study. Inclusive Development of the Economy (INCLUDE) Programme, Kathmandu, Nepal.
Haider, Z.I.J. and W., Azz. 2017. Effect of conflict on farmers’ income from tomato crop in Kurram Agency, Pakistan. Sharad J. Agric., 33(1): 171-176. https://doi.org/10.17582/journal.sja/2017.33.1.171.176
Hayes, A. and J. Matthes. 2009. Computational procedures for probing interactions in OLS and logistic regression: SPSS and SAS implementations. Behav. Res. Methods, 41(3): 924-936. https://doi.org/10.3758/BRM.41.3.924
Hepburn, R.H., Radloff and E. Sarah. 2011. Honeybees of Asia. Berlin: Springer publication. https://doi.org/10.1007/978-3-642-16422-4
Jacobs, F., C. Simoens, D. Graaf and J. Deckers, 2006. Scope for non-wood forest products income generation from rehabilitation areas: Focus on beekeeping. J. Drylands, 1(2): 171-185.
Koutsoyiannis, A., 1977. Theory of econometrics. London: The MacMillan Press Ltd. https://doi.org/10.1007/978-1-349-09546-9
Laate, E., 2016. Economics of beekeeping in Alberta. Alberta, Canada: Economics section, Alberta Agriculture and Forestry Economics and Competitiveness Branch.
Majumder, M.K., L. Mozumdar and P.C. Roy. 2009. Productivity and Resource Use Efficiency of Boro Rice Production. J. Bangladesh Agric. Univ., 7(2): 247-252. https://www.banglajol.info/index.php/JBAU/article/view/4730 https://doi.org/10.3329/jbau.v7i2.4730
MOAD, 2017. Statistical information on nepalese agriculture 2016/17. Kathmandu, Nepal: Ministry of Agricultural Development, Monitoring, Evaluation and Statistics Division, Agri Statistics Section.
Mujuni, A., K. Natukunda and D.R. Kugonza. 2012. Factors affecting the adoption of beekeeping and associated technologies in Bushenyi District, Western Uganda. Livest. Res. Rural Dev., 24(8).
NARC, 1996. Annual report. Khumaltar, Lalitpur, Nepal: National Agriculture Research Council.
Neupane, K.R., 2006. Beekeeping technology. Chtrawan Printers Pvt. Ltd., Pressmarg, Narayangarh, Chitwan
Okpokiri, C.I., I.N. Nwachukwu and C.N. Onwusiribe. 2015. Determinants and profitability of honey production ikwuano local government area, Abia State, Nigeria. Sci. Pap. Ser. Manage. Econ. Eng. Agric. Rural Dev., 15(3).
Partap, U., C.E. Halder, J. Rema, K.R. Gurung, N.B. Tamang, S. Wangchuk, E. Hussain and S. Hussain. 2017. Pro-poor value chain development for apis cerena honey: Potential benefits to smallholder apis cerena beekeepers in the Hindu Kush Himalaya. Kathmandu, Nepal: ICIMOD Research Report.
Paudel, L.P., 2003. Economics of honey production and marketing: A case of Chitwan, Nepal. IAAS, Rampur Campus, Chitwan, Nepal.
Perneger, T.V., D.S. Courvoisier, P.M. Hudelson and A. Gayet-Ageron. 2015. Sample size for pre-tests of questionnaires. Qual. Life Res., 24(1): 147-151. https://doi.org/10.1007/s11136-014-0752-2
Pokharel, S., J.B. Shrestha and S.R. Joshi. 2014. Suggested national apiculture policy, strategy and action plan Nepal.
Pokhrel, S., 2009. Comparative benefits of beekeeping enterprise in Chitwan, Nepal. J. Agric. Environ., 10: 46-59. https://doi.org/10.3126/aej.v10i0.2129
Prajneshu, 2008. Fitting of cobb-douglas production functions: Revisited. Agric. Econ. Res. Rev., 21(2): 289-292.
Ranabhat, N.B., 2010. Beekeeping: Indigenous Practice in the Mid-hills of Nepal. LAP LAMBERT Academic Publishing AG and Co. KG., Germany.
Rijal, S.P., R.B. Thapa, M.D. Sharma, S.K. Sah and Y.D. Gc. 2018. Bee floral calendar of cultivated and wild plants available in different agroecosytems of Chitwan, Nepal. Int. J. Res. Granthaalayah, 6(11): 222-245. https://doi.org/10.29121/granthaalayah.v6.i11.2018.1121
Sain, V. and J. Nain. 2017. Economics and importance of beekeeping. Biomed. J. Sci. Tech. Res., 1(7): 1833-1834. https://doi.org/10.26717/BJSTR.2017.01.000561
Sajjad, M., M. Khan, M. Zulfiqar, S. Ali, M. Nazir and A. Ali. 2012. Technical efficiency analysis of milk production in Khyber Pakhtunkhwa province: A stochastic frontier approach. Pak. J. Life Soc. Sci., 11(4): 36-41.
Scheaffer, R., 1979. Elementary survey sampling. Massachusetts, USA: Duxbury Press.
Shrestha, A., 2017. Study of production economics and production problems of honey in Bardiya District, Nepal. Sarhad J. Agric., 34(2): 240-245. https://doi.org/10.17582/journal.sja/2018/34.2.240.245
Thapa, R.B., 2002. Insect pollinators of some crop plants in Chitwan. NAHSON Bull., 12/13: 19-21.
Tijani, B.A., A.L. Ala, M.A. Maikasuwa and Ganaw. 2011. Economic Analysis of Beekeeping in Chibok Local Government Area of Borno State, Nigeria. Nigeria J. Basic Appl. Sci., ISS 079498. www.google.com [accessed 23/07/2014].
Yemane, T., 1967. Statistics: An introductory Analysis (2nd ed.). New York: Harper and Row.
To share on other social networks, click on any share button. What are these?


