
Correlations Between Melioidosis Seroprevalence in Livestock and Meteorological Factors in Peninsular Malaysia


Correlations Between Melioidosis Seroprevalence in Livestock and Meteorological Factors in Peninsular Malaysia
Hassan Ismail Musa1,3*, Latiffah Hassan1, Chandrawathani Panchadcharam2, Zunita Zakaria1, Saleha Abdul Aziz1

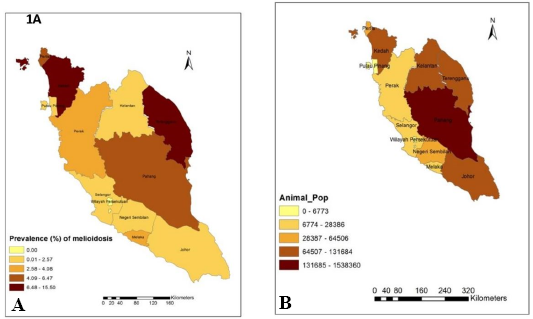
(A) Seroprevalence of melioidosis in livestock in Peninsular Malaysia from 2000- 2009 while (B) annual populations of livestock in Peninsular Malaysia from 2006-2009.
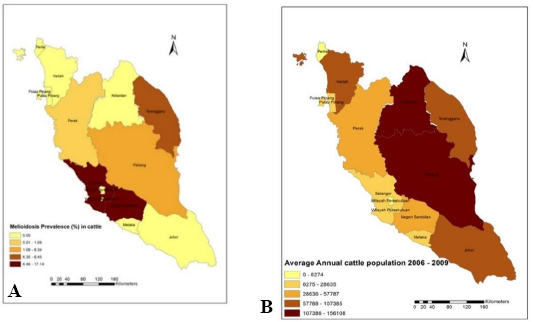
A: Choropleth map of seroprevalence of melioidosis in cattle in Peninsular Malaysia from 2000-2009 while B shows Choropleth map of average annual cattle population in Peninsular Malaysia between 2006 and 2009.
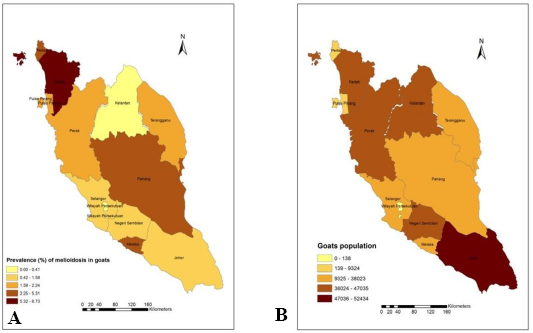
A: Choropleth map of seroprevalence melioidosis in goats in Peninsular Malaysia between 2000 and 2009. B: Choropleth map of annual average goat population in Peninsular Malaysia between 2006 and 2009.
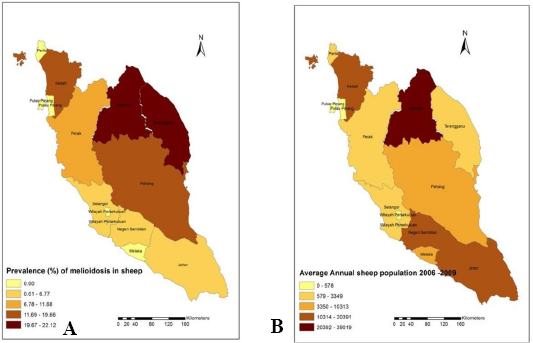
A: Choropleth map of seroprevalence of melioidosis in sheep in Peninsula Malaysia between 2000 and 2009. B: Choropleth map of average annual sheep population in Peninsular Malaysia between 2006 and 2009.
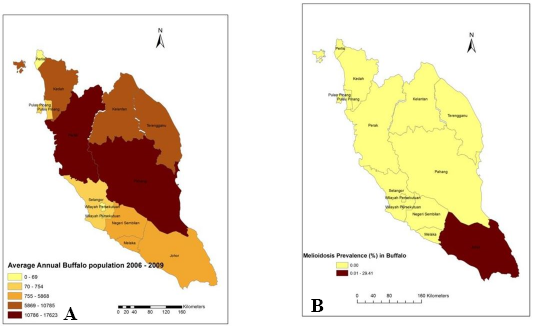
A: Average annual buffalo population in Peninsular Malaysia between 2006 and 2009. B: Choropleth map of seroprevalence of melioidosis in buffalo in Peninsula Malaysia between 2000 and 2009.
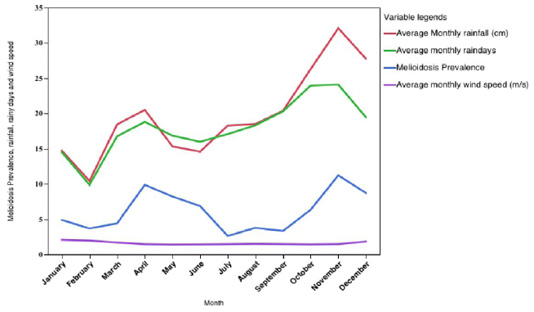
Trends of melioidosis seroprevalence, average monthly rainfall, average monthly rainy days and wind speed according to months in Peninsular Malaysia between 2000-2009.
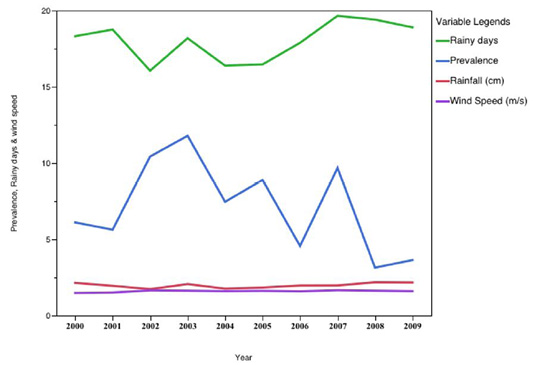
Trends of seroprevalence of melioidosis, average monthly rainfall, average number of rainy days and average monthly wind speed according the year in Peninsular Malaysia between 2000-2009.
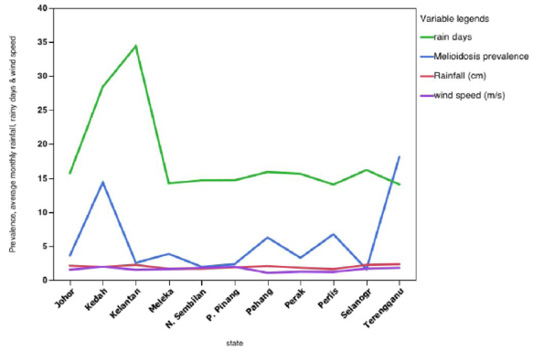
Trends of seroprevalence of melioidosis, average monthly rainfall, average number of rainy days and average monthly wind speed according the states in Peninsular Malaysia between 2000-2009.

