

Comparative Mitgenome Analysis of Anoplophora horsfieldi and Other Chrysomeloidea, Cucujiformia Insects Reveals Conserved Mitogenome Organization and Phylogeny


Comparative Mitgenome Analysis of Anoplophora horsfieldi and Other Chrysomeloidea, Cucujiformia Insects Reveals Conserved Mitogenome Organization and Phylogeny
Haifen Qin1,2, Yujia Liu1, Yujie Zhang1, Jingfeng Liu1, Zhenkun Zhao1,2 and Lichun Jiang1,2*
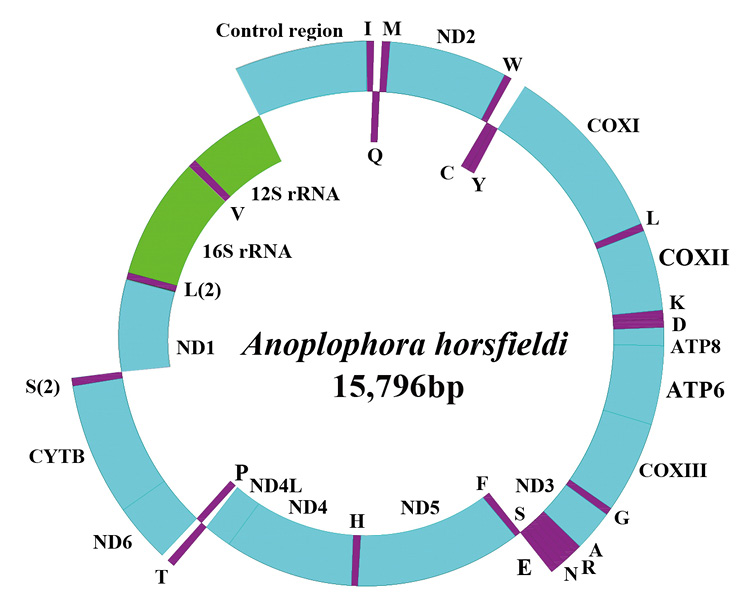
Complete mitogenome organization and gene arrangement of Anoplophora horsfieldi from China. Genes coded on the H strand are directed to the outer ring, while the genes coded on the L strand are indicated in the interior of the ring. Genes are abbreviated as follows: ATP6 and ATP8 (subunits 6 and 8 of ATPase), COXI-COXIII (cytochrome c oxidase subunits 1-3), Cytb (cytochrome b), ND1-ND6 and ND4L (NADH dehydrogenase subunits 1-6 and 4L), 12S rRNA and 16S rRNA (ribosomal RNA of 12S and 16S), CR (control region). One-letter amino acid abbreviations were used to label the corresponding tRNA genes.
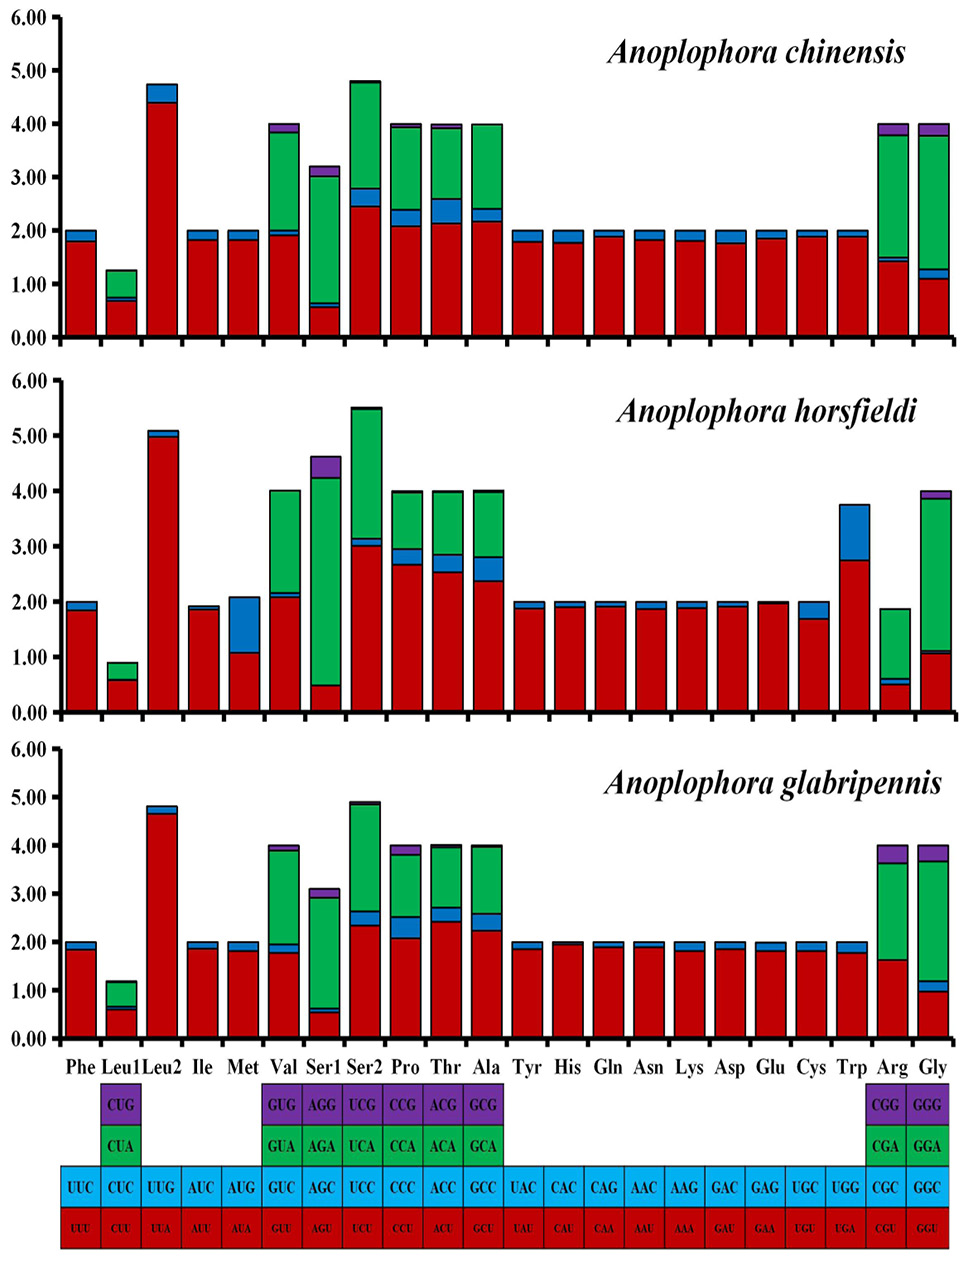
The relative synonymous codon usage (RSCU) in the mitogenomes of three Anoplophora species. Codon families are provided on the x-axis along with the different combinations of synonymous codons that code for that amino acid. RSCU are provided on the y-axis.
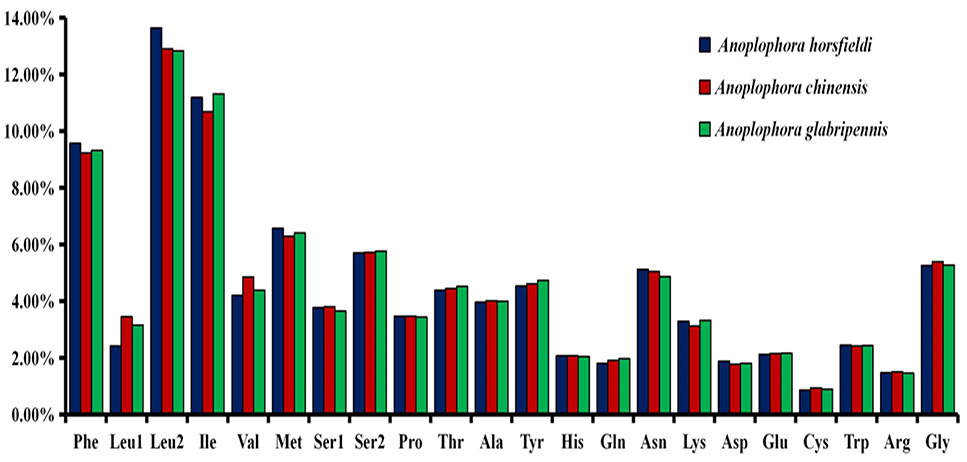
Total codons in three Anoplophora mitogenomes.
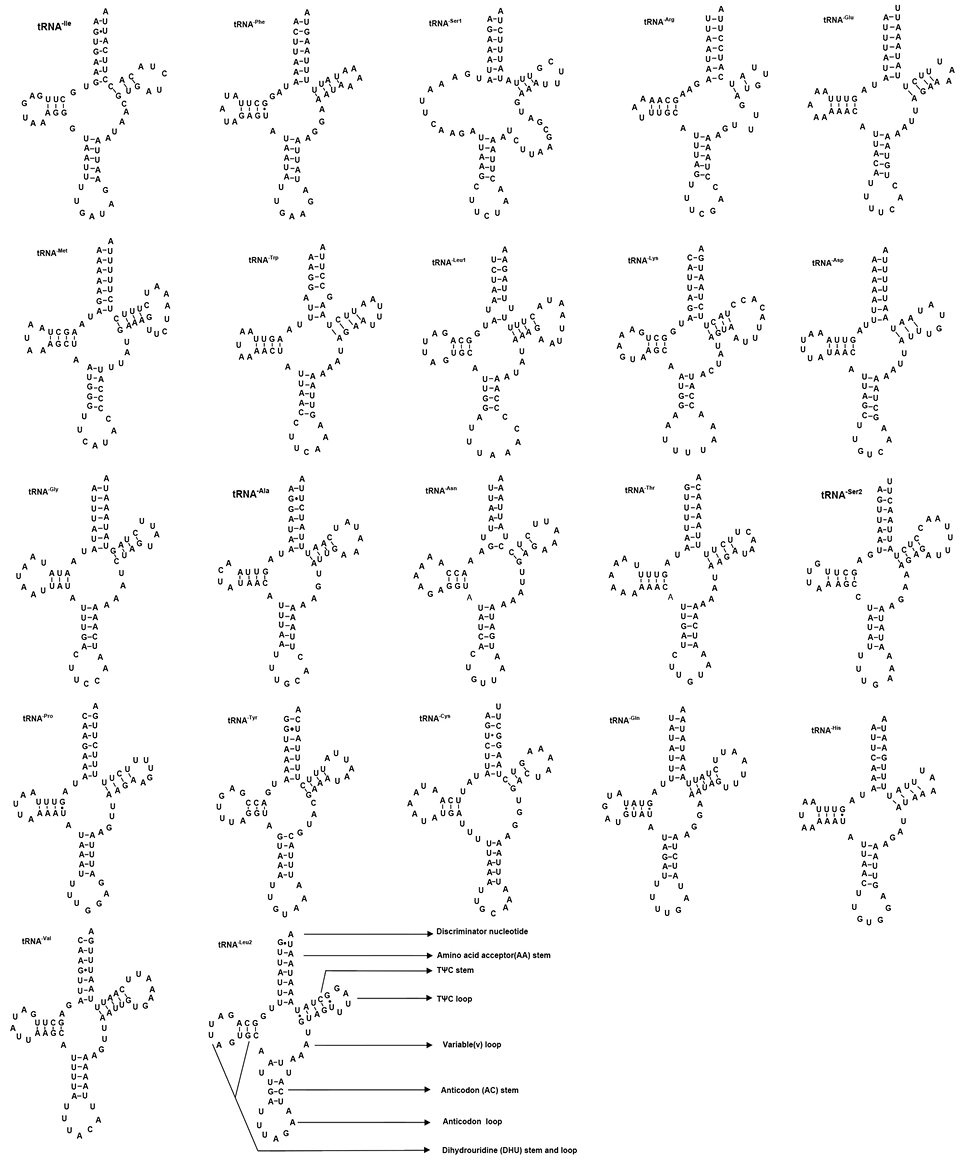
Putative tRNA secondary structures predicted from the 22 tRNA gene sequences found in the Anoplophora horsfieldi mitogenome.
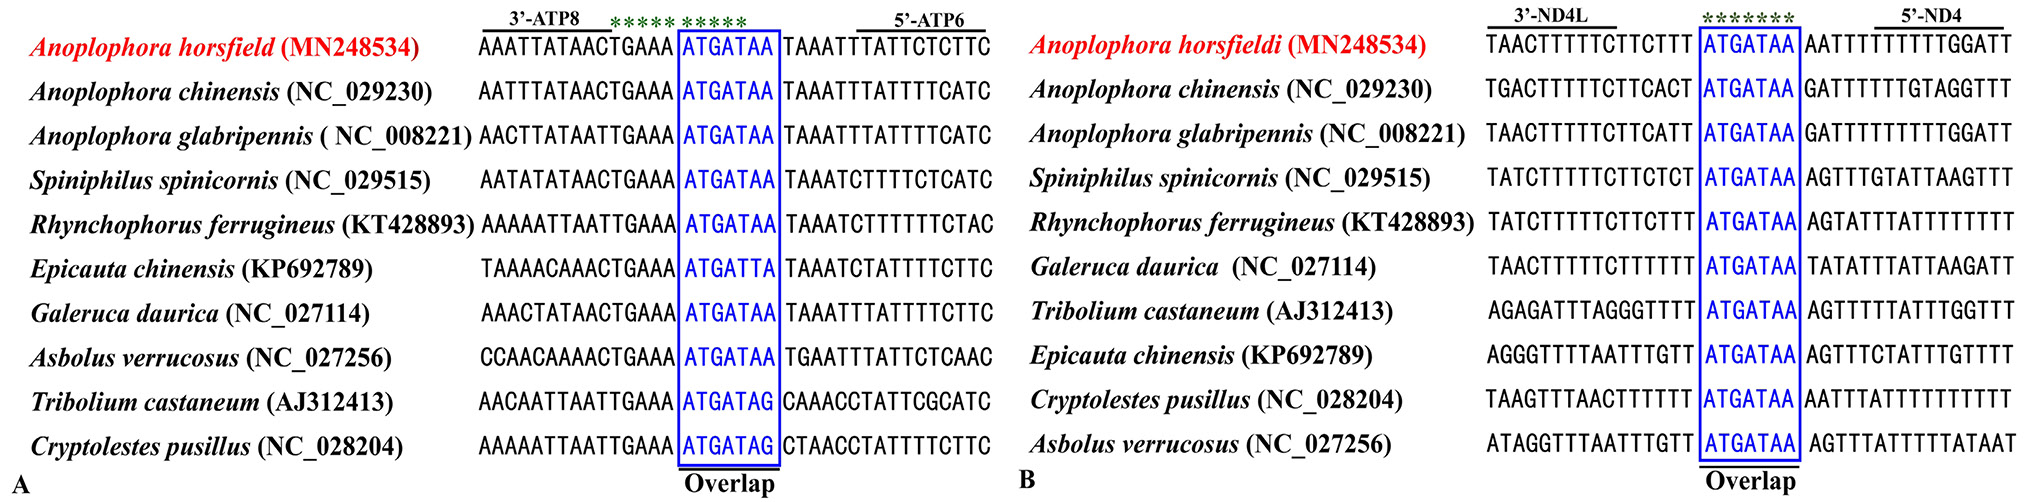
Alignment of overlapping region across Cucujiformia and other insects. (A) Atp8 and Atp6, the motifs “ATGATA/TA/G” in the box are conservative; (B) ND4L and ND4, the motifs “ATGATAA” in the box are conservative.
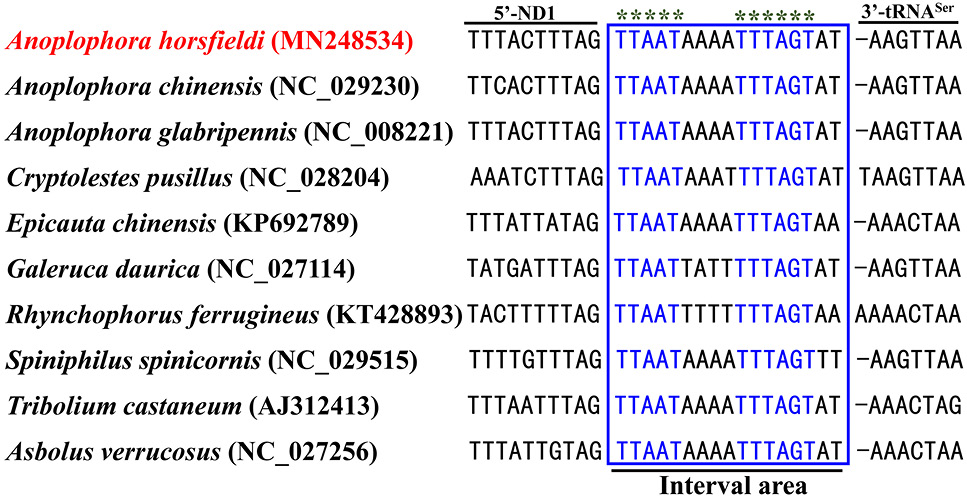
Alignment of the intergenic spacer region between trnS (UCN) and ND1 of several Cucujiformia insects. The shaded “TTAAT” and “TTTAGT” motif is conserved across the Cucujiformia species.
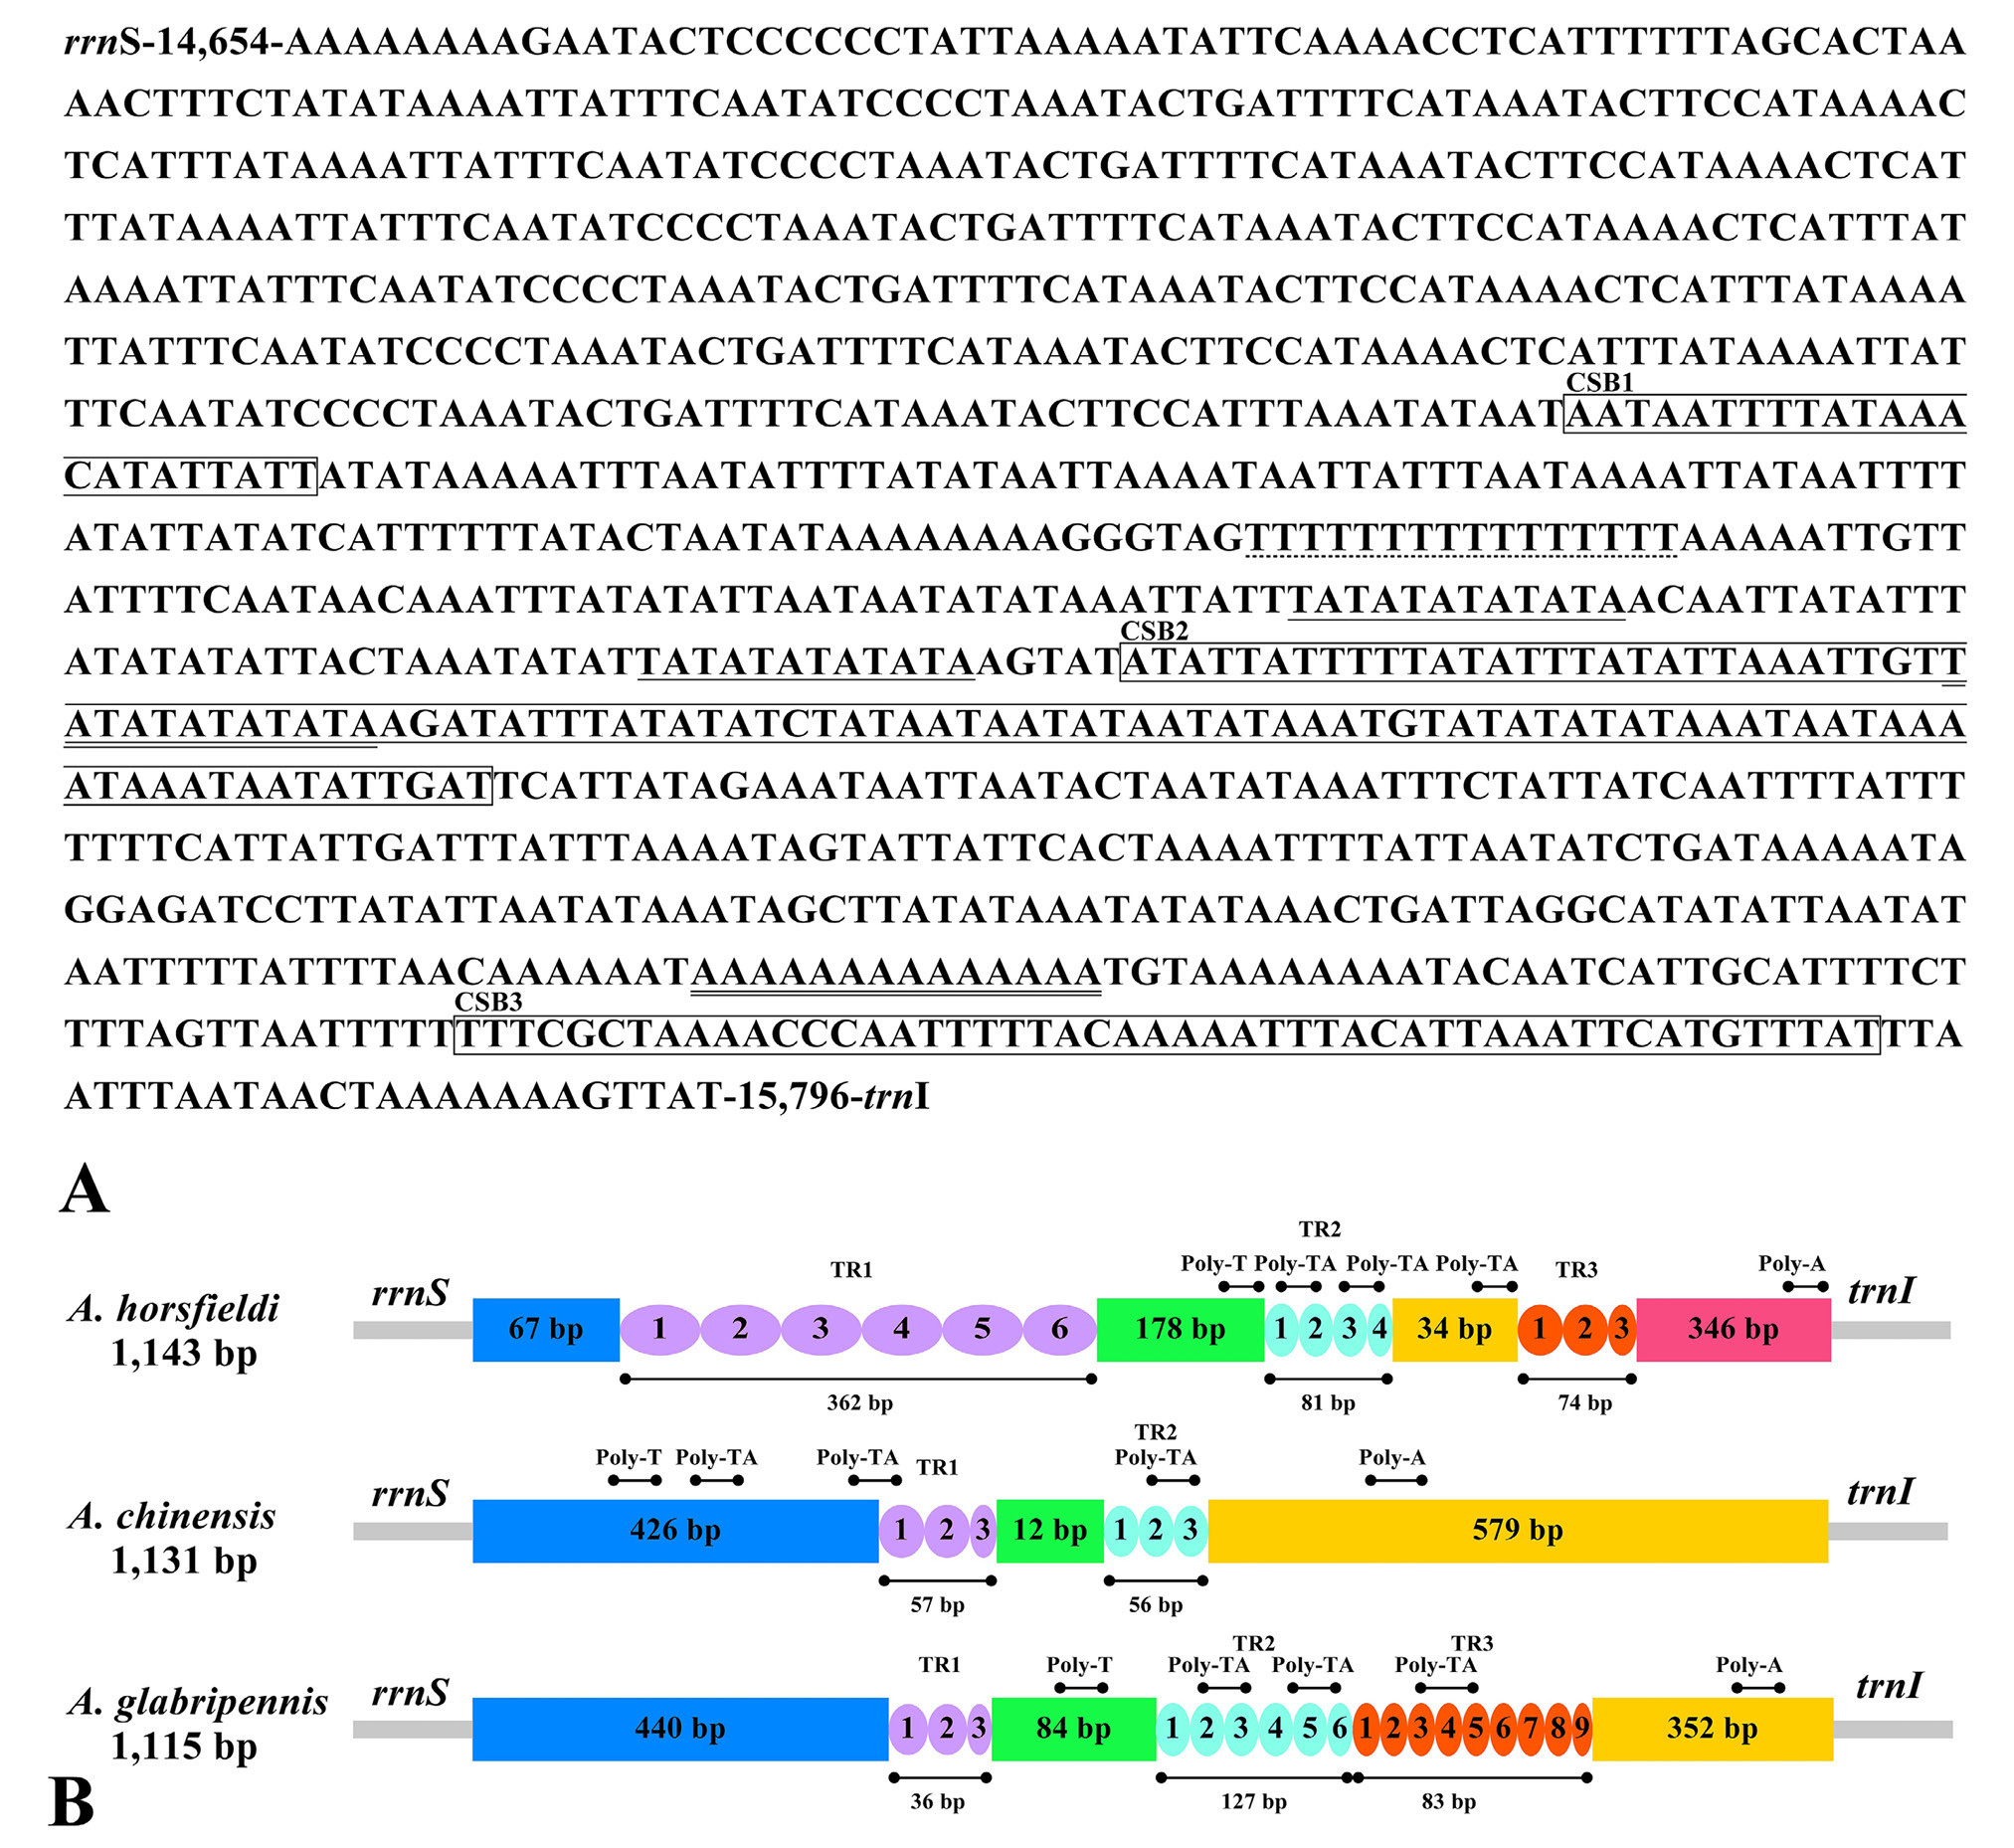
(A) Organization of the A+T-rich regions in the Anoplophora horsfieldi mitogenomes. The square box represents the feature sequence CSB1-3. The poly-T stretch is underlined while the poly-A stretch is double underlined. The single microsatellite T/A repeats sequence are indicated by single underlining. (B) The colored ovals indicate the tandem repeats; the remaining regions are shown with different color boxes. TR1-3 represents different types of repeat sequences. Horizontal lines with solid dots at both ends represent the structures of poly (A), poly (T) and poly (TA), respectively.
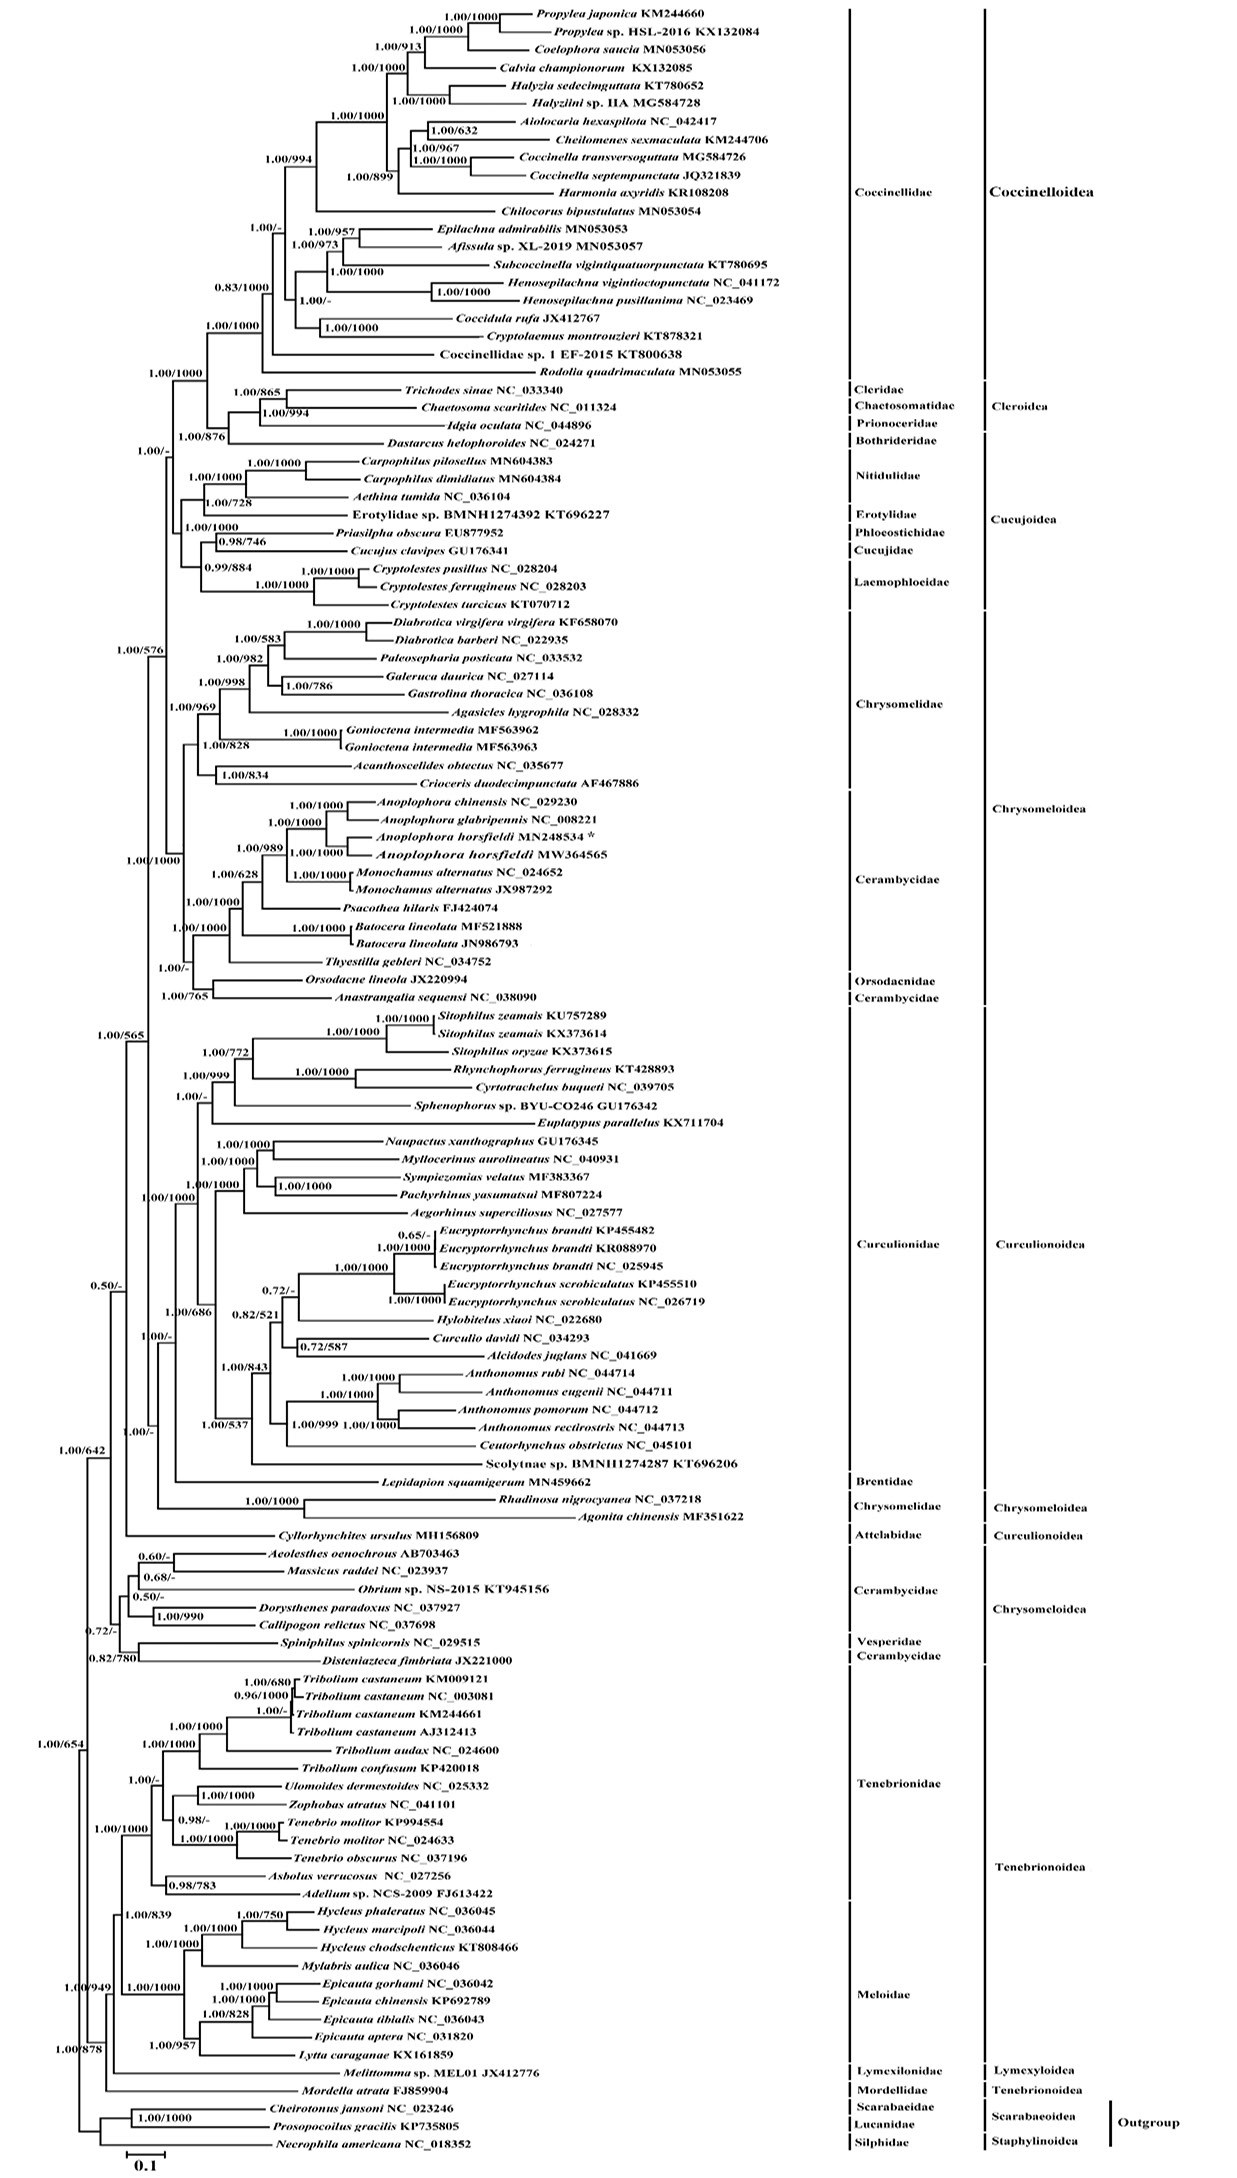
Phylogenetic tree of the relationships among 117 mitogenome sequences of Cucujiformia based on the nucleotide dataset of the 13 mitochondrial protein-coding genes of 11,154 nucleotides with Prosopocoilus gracilis (Coleoptera: Scarabaeiformia: Lucanidae: KP735805), Cheirotonus jansoni (Coleoptera: Scarabaeiformia: Scarabaeidae: NC_023246) and Necrophila americana (Coleoptera: Staphyliniformia: Silphidae: NC_018352) as outgroups. Branch lengths and topology are from the BI analysis. Numbers above branches specify posterior probabilities from Bayesian inference (BI) and bootstrap percentages from maximum likelihood (ML, 1000 replications) analyses. The GenBank numbers and scientific names of all species are shown in Supplementary Table S1. Tree topologies produced by Bayesian inferences (BI) and maximum likelihood (ML) analyses were equivalent. Bayesian posterior probability and bootstrap support values for ML analyses are shown orderly on the nodes. The asterisks indicate new sequences generated in this study.
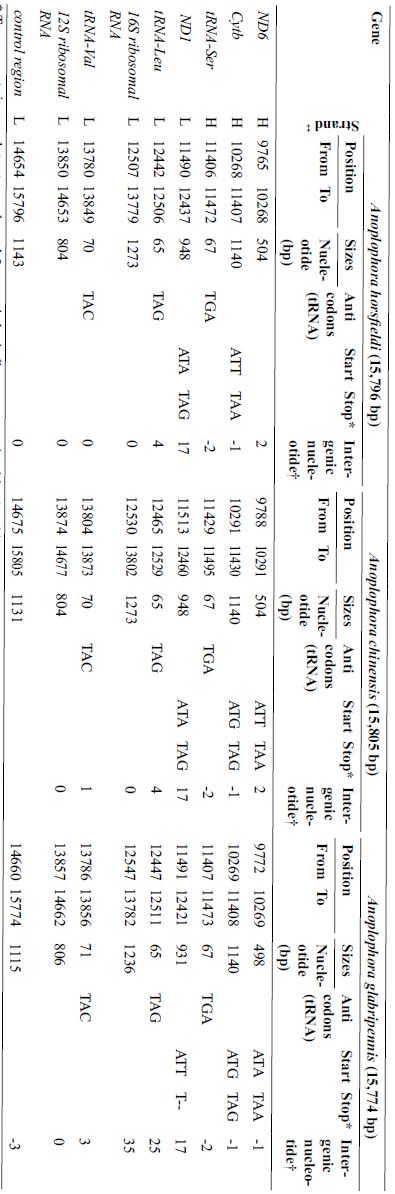
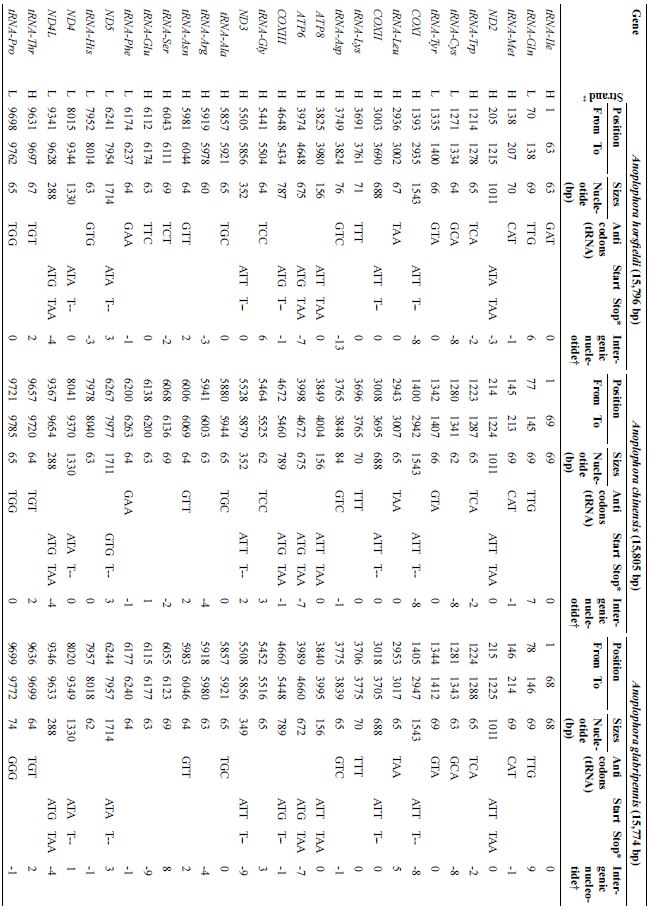
The mtDNA gene arrangement of three Anoplophora species (Anoplophora horsfieldi, Anoplophora chinensis, Anoplophora glabripennis).
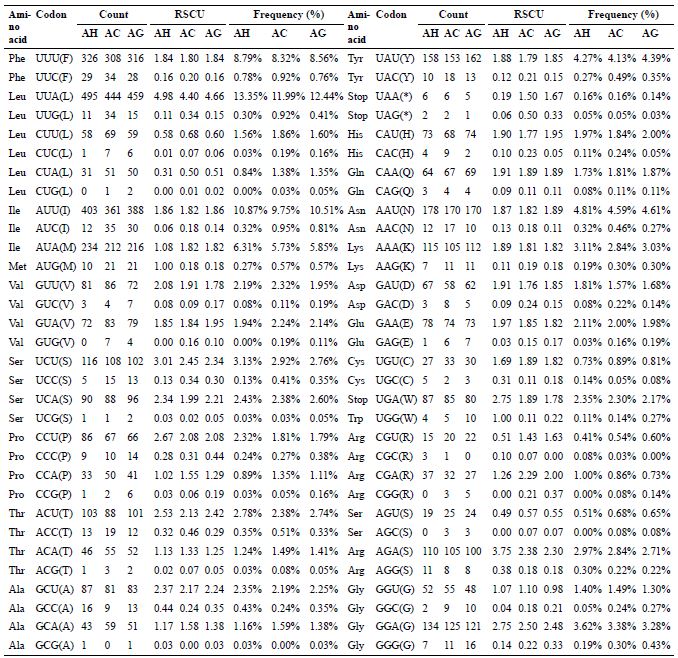
The codon number and relative synonymous codon usage in mitochondrial protein coding genes.


