

Comparative Genomic and Functional Characterization of Lactobacillus casei Group (LCG) Probiotic Strains Isolated from Traditional Yogurts by Next-Generation Sequencing


Comparative Genomic and Functional Characterization of Lactobacillus casei Group (LCG) Probiotic Strains Isolated from Traditional Yogurts by Next-Generation Sequencing
Mati Ullah1*, Muhammad Rizwan2, Ali Raza3, Xianlin Zhao4, Yanling Sun4, Sarah Gul5, Muhammad Ihtesham Waheed6, Muhammad Nadeem Khan7, Alvina Gul8, Sami Ullah Jan9* and Chao Huang4*
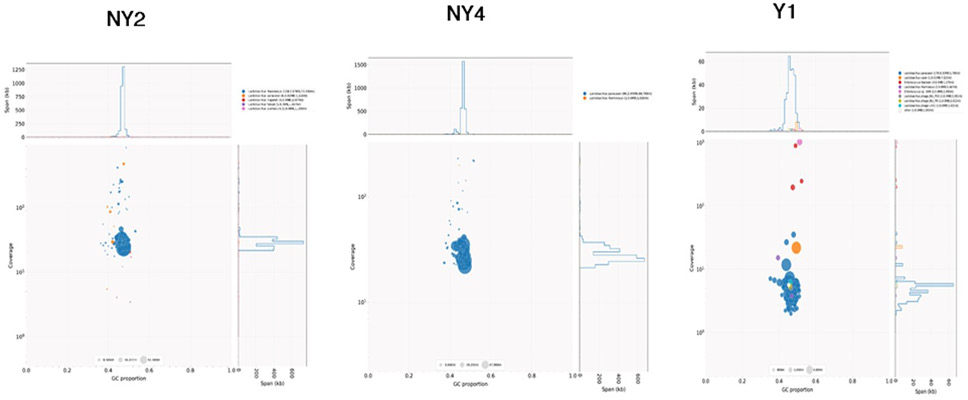
Blob plots indicate the results of BLAST matches of each of the three Lactobacillus casei Group (LCG) assembled genomes. The colors indicate BLAST matches to different species of bacteria. The proportion of GC contents in each assembled genome is also indicated.

Circular plot of Lactobacillus casei Group (LCG) genome generated by DNA plotter with NY2 as a reference. Circles indicate, from inside outwards: GC skew; GC content; NY4 Comparison results; Y1 comparison result; CDS sequence (reverse frame); CDS sequence (plus frame).
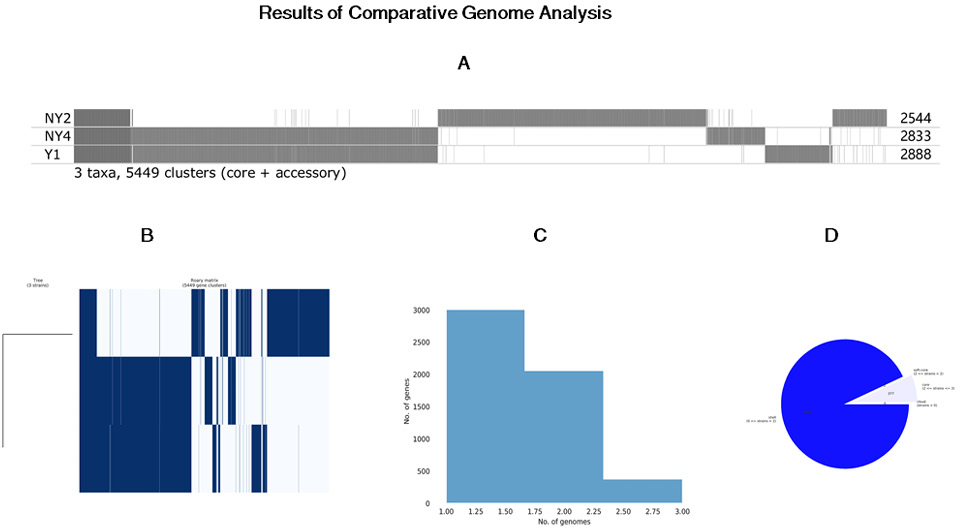
Comparative genome analysis of the three Lactobacillus casei Group (LCG) strains. (A) Roary matrix. Pan-genome analysis of three Lactobacillus casei Group (LCG) strains annotated genomes. Roary produced the gene presence/absence matrix. A total of 5449 protein-coding gene sequence clusters produced by Roary are shown in the figure. The presence of the gene is represented by grey color while the absence is shown by white color. The numbers represent clusters in each assembled annotated genome. (B) Pan-genome constructed by Roary based on the core and accessory genes showing phylogenetic relatedness of the strains by blue (present) and white (absent (C) Barplot indicating the ratio of number of genome vs the number of genes (D) The pan-genome pie chart showing gene content visualized with the use of Roary software.

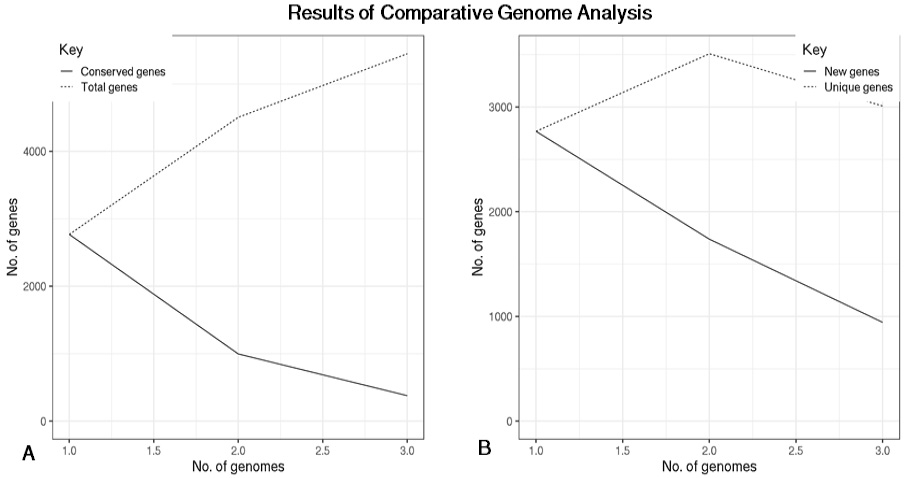
Heap’s law chart representation regarding conserved genes vs total genes in three assembled genomes (A) Diagram of conserved genes per number of genomes. (B) Diagram of new and unique genes per number of genomes.
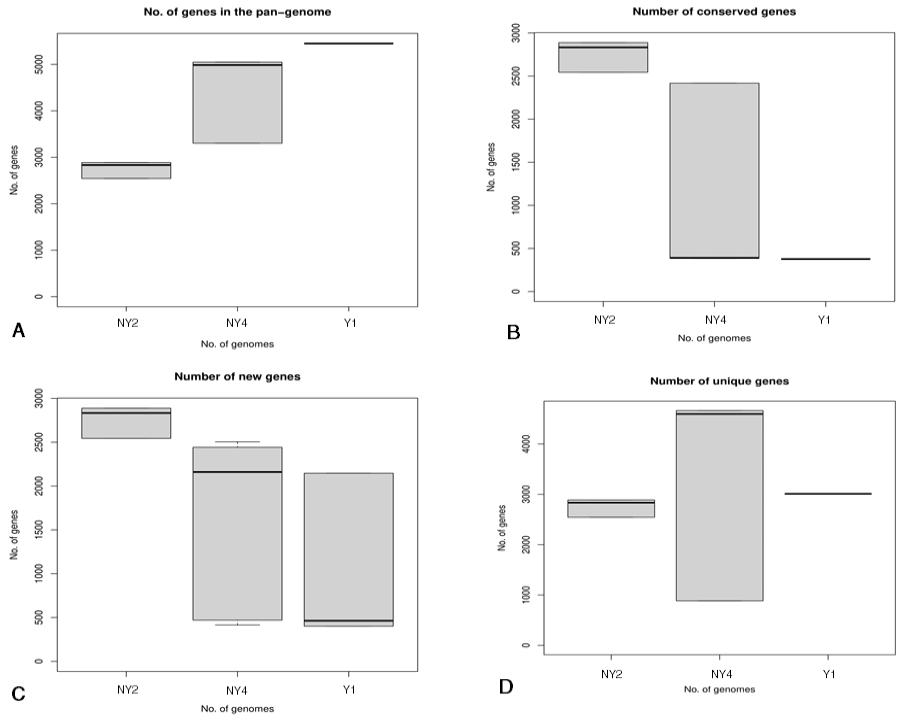
Box plots representation of pan genome analysis of the three Lactobacillus casei Group (LCG) strains. (A) Represent the number of genes in pan genome of the three assembled genome (B) Number of conserved genes identified in three assembled genome (C) Number of new genes identified in three assembled genome (D) Number of unique genes identified in three assembled genomes.

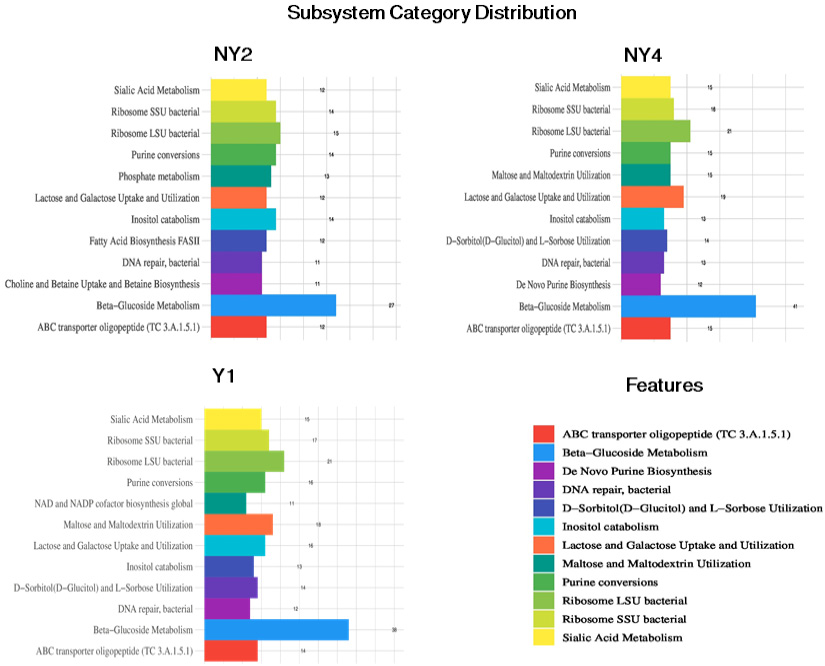
The subsystem category distribution of the probiotic bacterial genome sequences according to the Seed database. The largest subsystem feature counts belong to Carbohydrates, protein metabolism, DNA metabolism, and nucleoside and nucleotide. The description of various subsystem features are represented in a different color (below right).
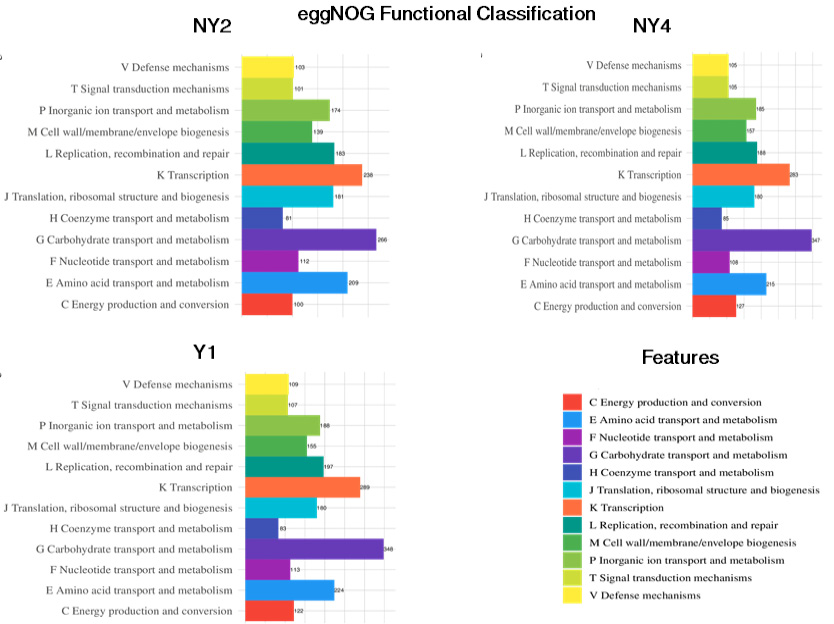
Classification of eggNOG annotations of the probiotic bacterial genome sequences using eggNOG. The numbers in the plots represent the genes assigned to eggNOG classification. The description of various annotated eggNOG features is represented by a different color (below right).

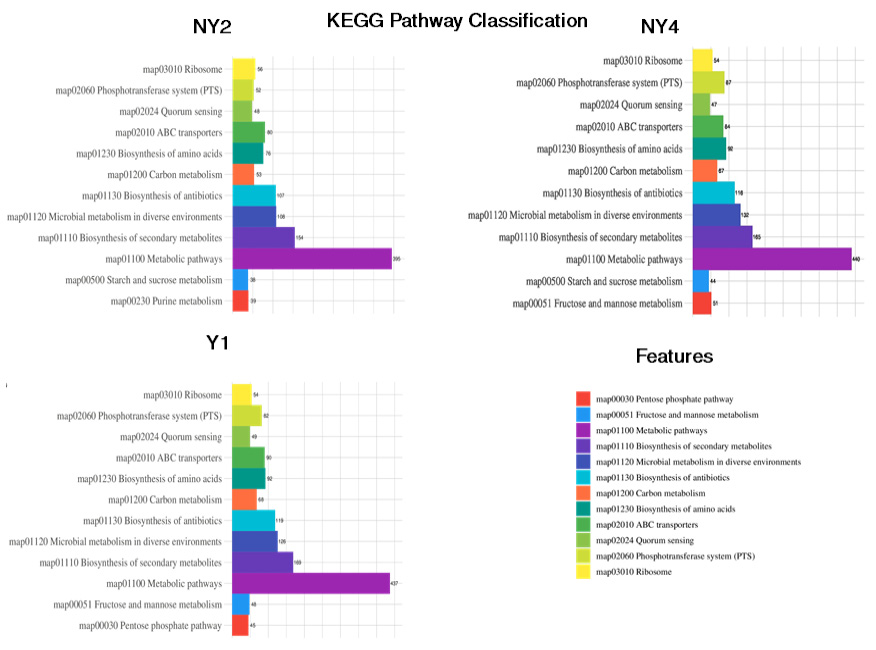
Classification of the KEGG pathways based on the assembled genome of the three probiotic bacterial strains. The different colors represent the various KEGG pathways identified in the current analysis.


