Combined Effect of Melatonin and Metformin in Mitigating Anxiety and Depression-Related Behaviors in Diabetic Mice Under Immobility Stress: Role of Oxidative Stress
Combined Effect of Melatonin and Metformin in Mitigating Anxiety and Depression-Related Behaviors in Diabetic Mice Under Immobility Stress: Role of Oxidative Stress
Idrissi Ouedrhiri Housna1, Bikri Samir1,2*, Benloughmari Douae1, Aboussaleh Youssef1
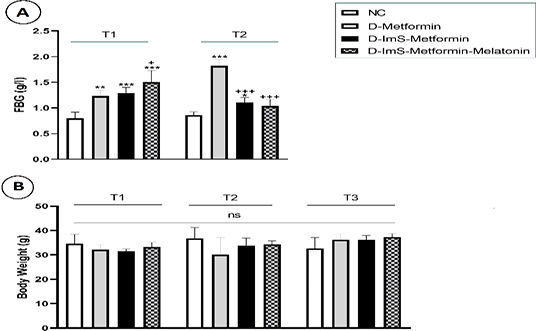
Changes in FBG (A) and body weight (BW) (B). Data are expressed to mean ± SDSD (n=7). *p<0.05, **p<0.001, ***p<0.01 versus NC group. + p<0.05 ++p<0.01 versus D-Met. @ p<0.05 @@ p<0.01 @@@ p<0.001 versus D-Ims-Met.
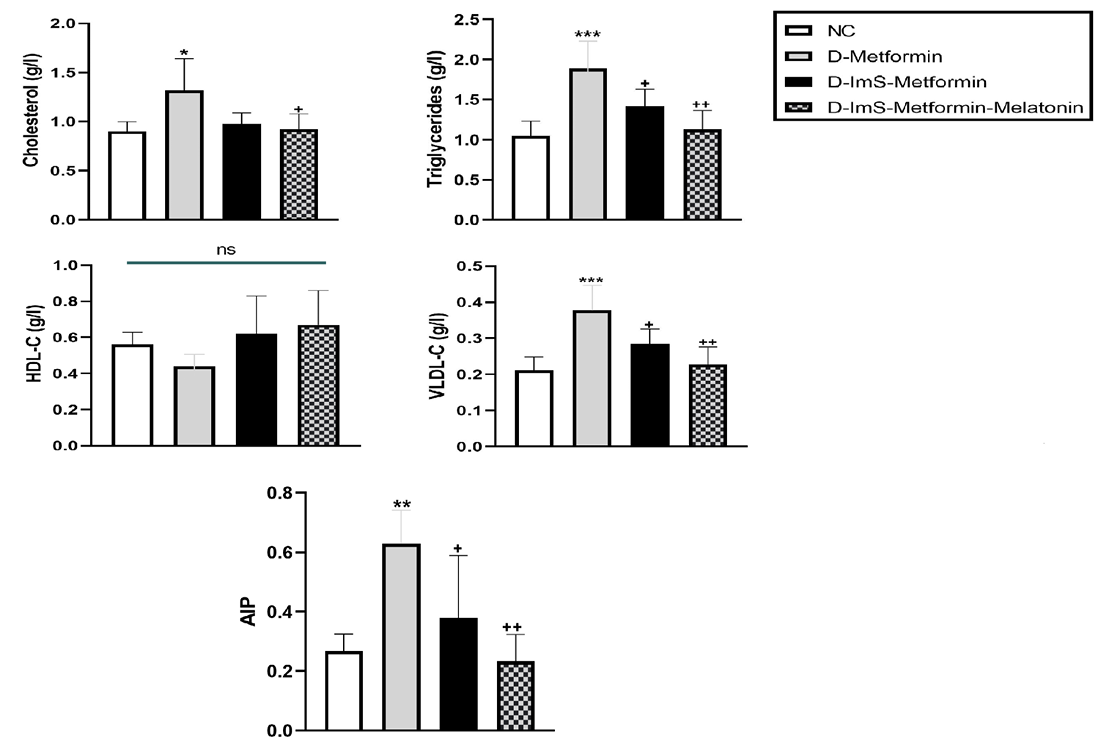
Biochemical analysis; Data are expressed to mean ± SDSD (n=7); *p<0.05, **p<0.001; ***p<0.01 versus NC group. + p<0.05 ++p<0.01 versus D-Met. @ p<0.05 @@ p<0.01 @@@ p<0.001 versus D-Ims-Met.
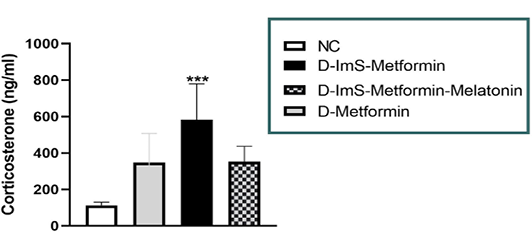
Changes in CORT. level. Data are expressed to mean ± SDSD (n=7); *p<0.05, **p<0.001; ***p<0.01 versus NC group. + p<0.05 ++p<0.01 versus D-Met. @ p<0.05 @@ p<0.01 @@@ p<0.001 versus D-Ims-Met.
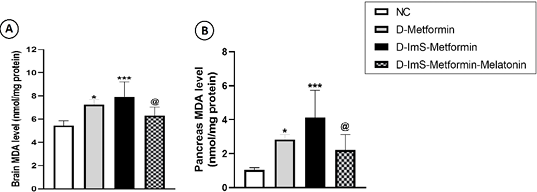
Malondialdehyde levels in brain (A) and Pancreas (B). Data are expressed to mean ± SDSD (n=7). *p<0.05, **p<0.001, ***p<0.01 versus NC groups. + p<0.05 ++p<0.01 versus D-Met. @ p<0.05 @@ p<0.01 @@@ p<0.001 versus D-Ims-Met.


