

Cloning and Bioinformatics of CTSD Gene and its Expression at the Onset of Puberty in Duolang Sheep


Cloning and Bioinformatics of CTSD Gene and its Expression at the Onset of Puberty in Duolang Sheep
Qingjin Li1,2, Zhiyuan Sui1,2, Jihu Zhang1,2, Zhishuai Zhang1,2 and Feng Xing1,2*
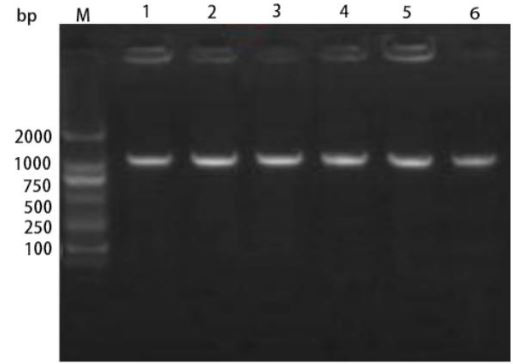
PCR products of CTSD of Duolang sheep.


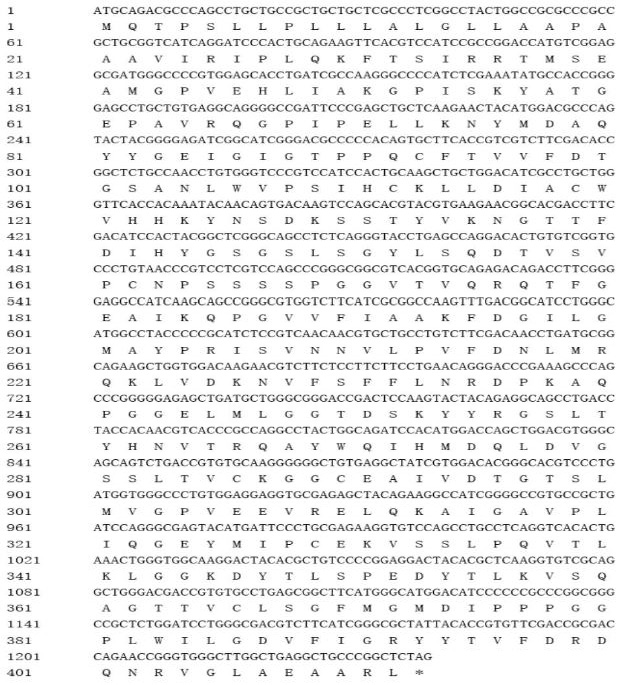
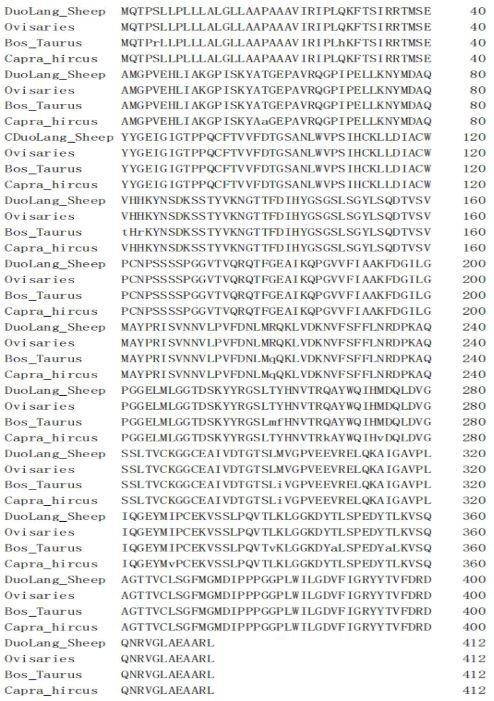
Aligment of the amino acid sequences of the predicted Duolang sheep of CTSD protein with of ovisarise (XP_027815055.1), capra hircus XP_017898833.1, bos taurus (XP_005227353.1).


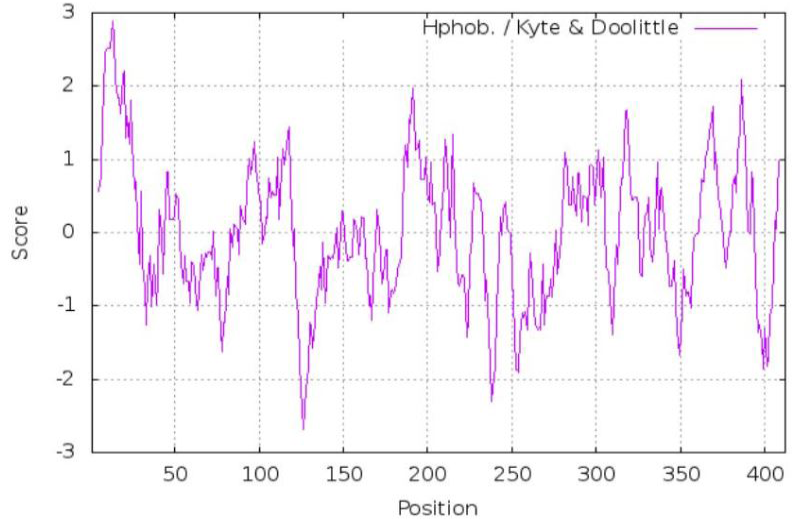
Hydrophilicity profile of the CTSD protein in Duolang sheep.
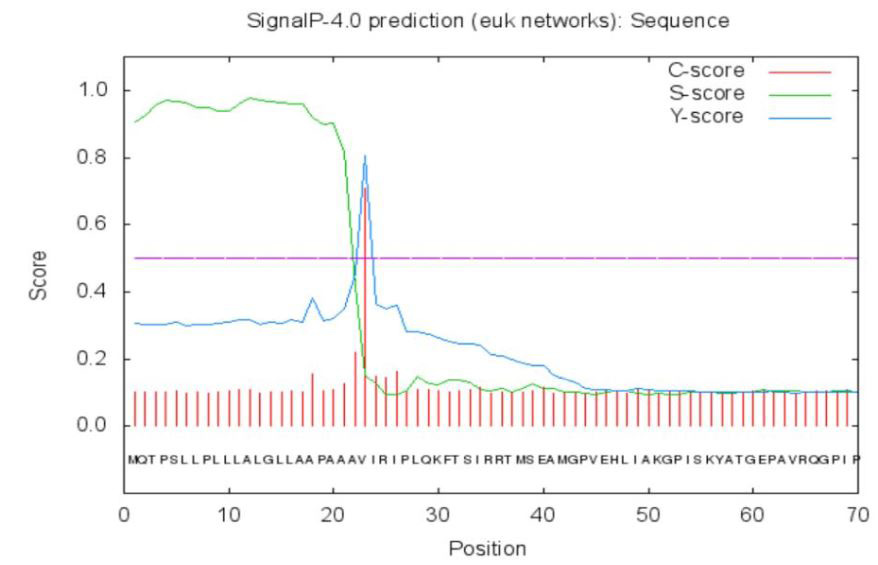
Prediction of the cleavage site of the amino acid signal peptide in the coding region of the CTSD gene in Duolang sheep.

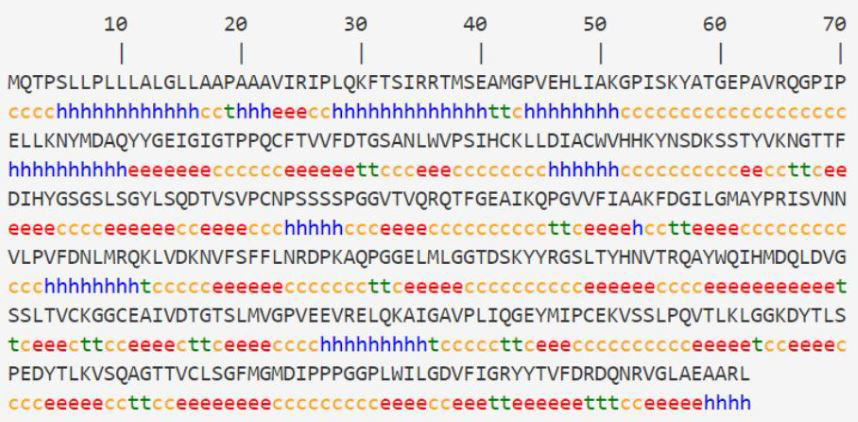
CTSD secondary structure. h, α-helix; e, extended strand; t, β-turm; c, random coil.
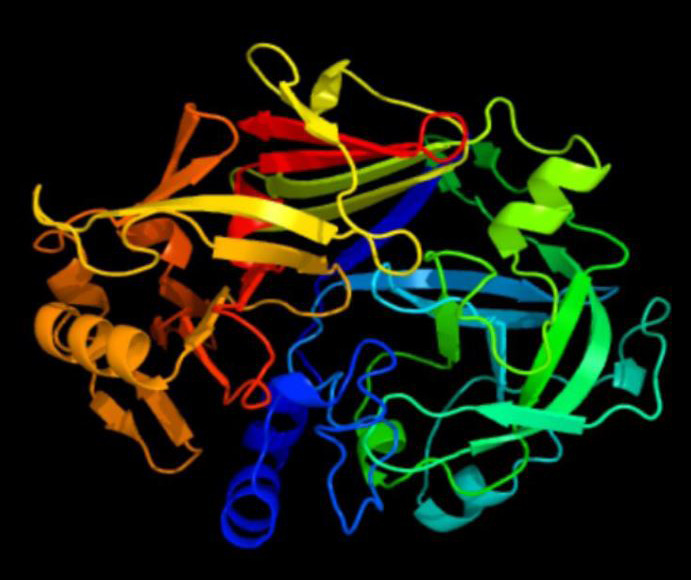
CTSD three-level structure.

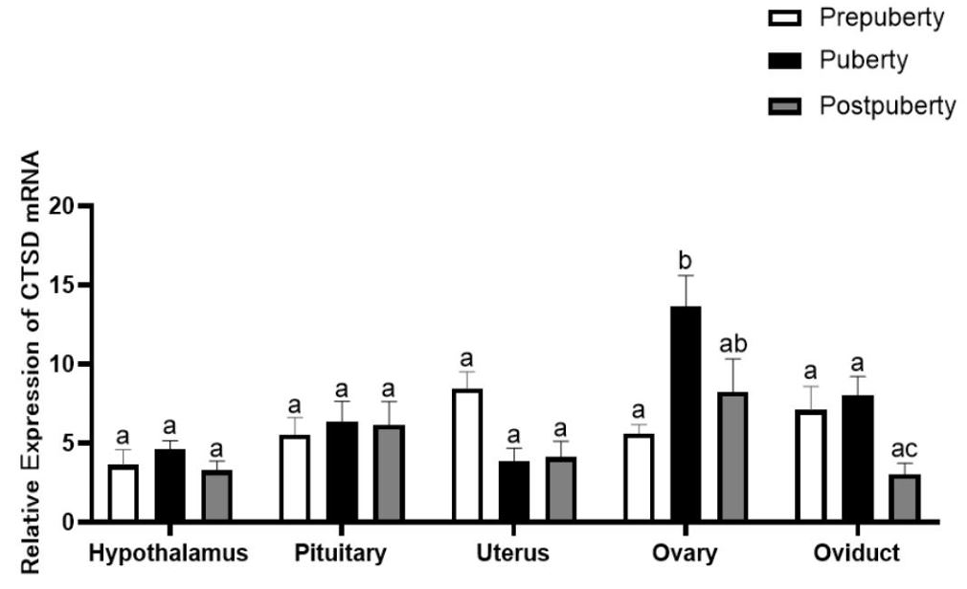
Relative expression levels of the CTSD gene in hypothalamus, pituitary, uterus ovary, and oviduct during three periods. Different letters above the bars in the same tissue indicate significant differences (P<0.05).

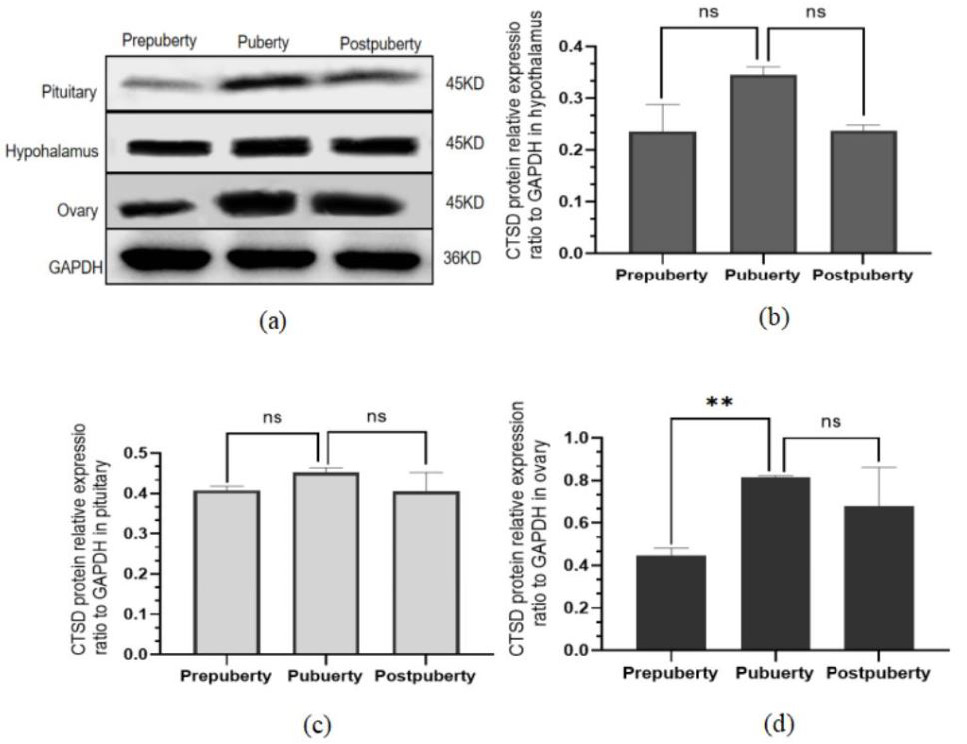
Expression of cathepsin D (CTSD) in the hypothalamus, pituitary, and ovary issues of different development stages. Wastern blotting was used to analyze CTSD expression in prepuberty, puberty, and postpuberty. (b, c, d) quantification of the CTSD expression level in different tissues and developmental stages, normalized to GAPDH expression Data are presentd as mean±standard deviation (SD). **P<0.01, nsP>0.05.


