
Clinical, Haematobiochemical, Ultrasonographical, and Ruminal Alterations in Induced Lactic Acidosis with Therapeutic Evaluation in Camels in South Sinai


Clinical, Haematobiochemical, Ultrasonographical, and Ruminal Alterations in Induced Lactic Acidosis with Therapeutic Evaluation in Camels in South Sinai
Mohamed Mohamady Ghanem1*, Yassine Mahmoud Abdelraoof1, Abdelghany Hefnawy Abdelghany2, Eman Abdelhamid El-Ebissy3, Ahmed Ragab Askar4,5, Attia Ahmed Eissa6

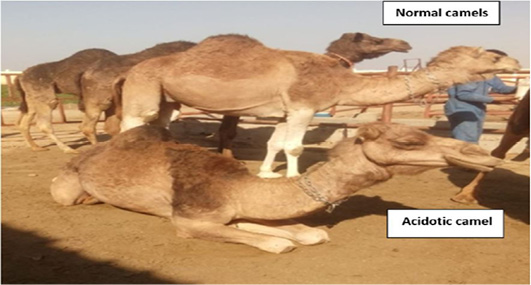
She-camel after induction of acidosis showing signs of dullness, depression and sternal recumbency compared to normal healthy standing she camels.

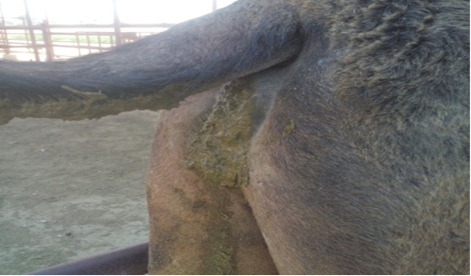
She-camel after induction of lactic acidosis showing soiling of anal area, tail and hind quarters indicating diarrhea. Notice the sticky nature of fecal martials.

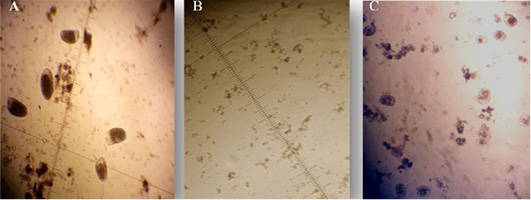
Protozoal changes of ruminal juice in camels. (A) Before induction of acidosis (normal protozoal count). (B) After induction of acidosis (decrease the number of protozoa). (C) After treatment with Rumitone (increase the protozoal count).
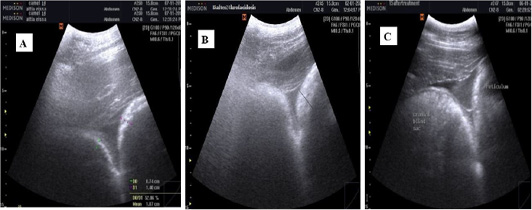
Ultrasonographic images of the camel reticulum visualized from the right paramedian region just behind the sternal pad using 3.5 MHz convex probe (transverse). (A) Before induction of acidosis: The wall of the dorsal ruminal sac wall appeared echogenic line and the reticulum appeared as a half-moon-shaped echogenic structure with an even contour and the contents of dorsal ruminal sac and reticulum appeared hypoechoic and homogenous. (B) After induction of acidosis: The reticulum wall thickness increased. (C) After treatment with Rumitone: The reticular wall thickness decreased compared to pre-acidosis.
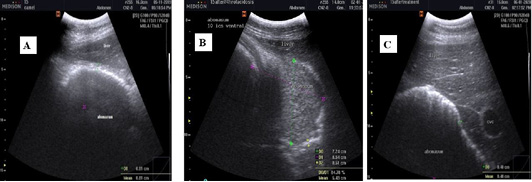
Ultrasonographic images of camel abomasum visualized from the right side from 8th-9th intercostal space using 3.5 MHz convex probe (longitudinal). (A) Before induction of acidosis, the abomasal wall appeared as distinct echogenic white line and the abomasal contents appeared hypoechoic and homogeneous. (B) After induction of acidosis, the wall appeared thicker than before induction of acidosis and the content appeared heterogenous in echogenicity and more echoic than before induction. (C) After treatment with Rumitone, the abomasal wall returned to distinct echogenic line and the content appeared hypoechoic and homogeneous.
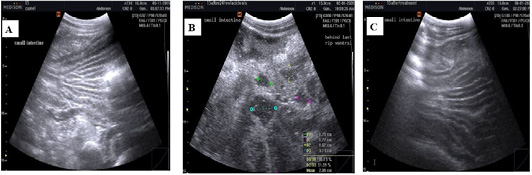
Ultrasonographic images of camel small intestine visualized low in the right paralumbar fossa using 3.5 MHz convex probe (longitudinal). (A) Before induction of acidosis: The intestinal contents were almost very hypoechoic and homogenous. (B) After induction of acidosis: Small intestine diameter is increased, the contents appeared heterogenous and more echoic compared to pre-acidosis induction. (C) After treatment with Rumitone: the intestinal contents returned to hypoechoic and homogenous.

