Characterization, Tissue-Specific and Developmental Stage Expression of Somatostatin in Coilia nasus
Characterization, Tissue-Specific and Developmental Stage Expression of Somatostatin in Coilia nasus
Siyu Yang1, Fukuan Du2 and Pao Xu1,2*
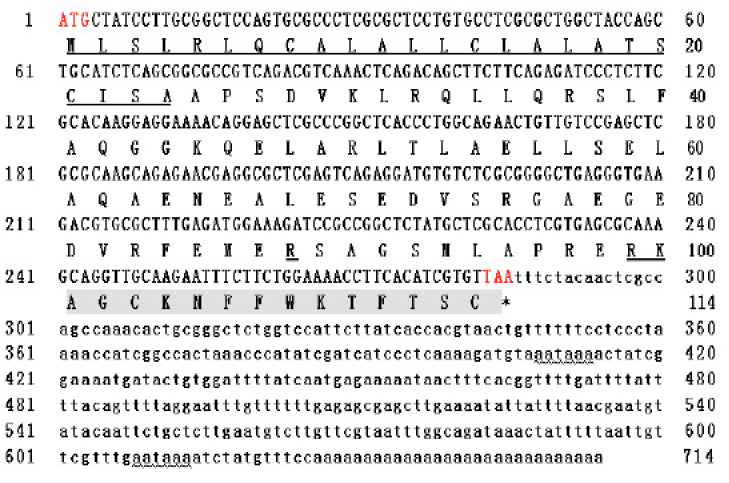
Nucleotide and predicted amino acid sequences of C. nasus SS1. Signal peptides are underlined. SS sequence is shaded in gray. Double underline indicates the potential cleavage sites (Arg87 and Arg98–Lys99). Wave underlining represents polyadenylylation signals.
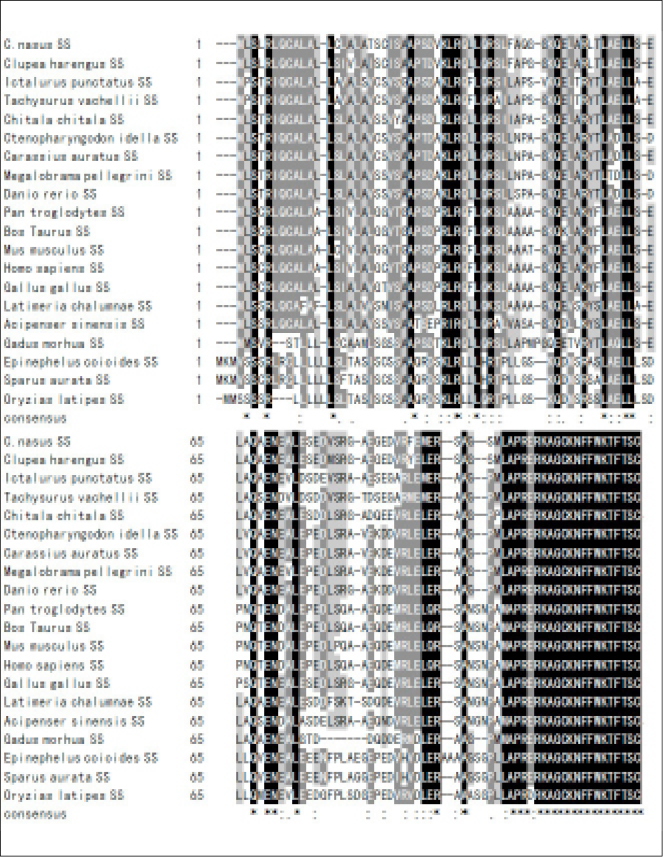
Amino acid sequence comparison of C. nasus SS1 with the sequences of SS1 precursors from several other species. Residues that are conserved in more than half of the listed peptides are shaded. Identical amino acids are indicated by an asterisk.
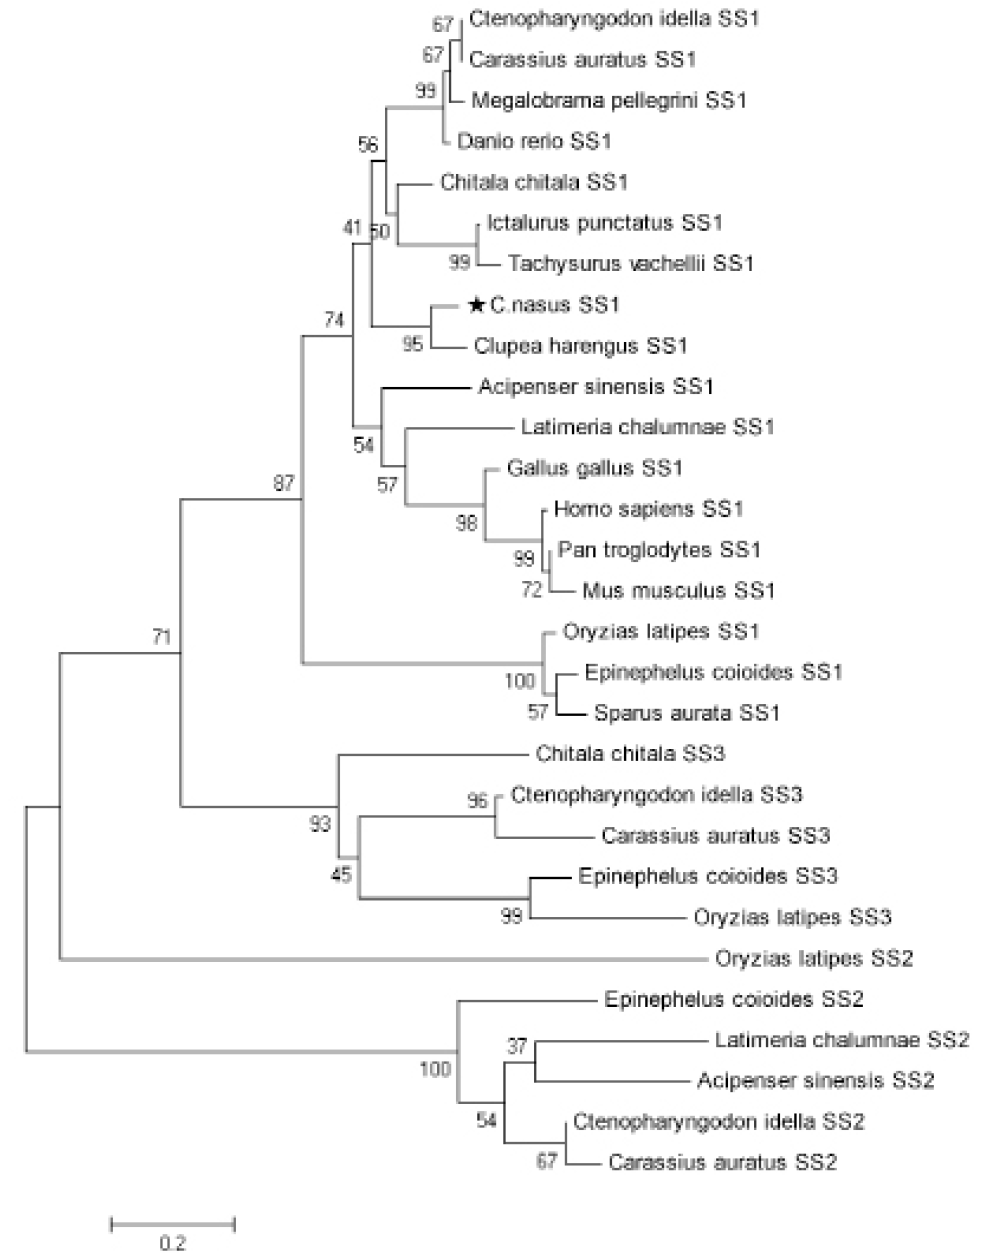
Phylogenetic analysis of C. nasus SS1 amino acid sequences. Scale bar indicates the substitution rate per residue. Numbers at nodes indicate the bootstrap value as percentages obtained for1000 replicates. GenBank accession numbers: Clupea harengus SS1 (XP_012673158.1); Ictalurus punctatus SS1 (NP_001187259.1); Tachysurus vachellii SS1 (ADX32485.1); Danio rerio SS1 (AAH76254.1); Latimeria chalumnae SS1 (XP_005992512.1); Ctenopharyngodon idella SS1 (ACB69423.1); Carassius auratus SS1 (AAD09359.1); Megalobrama pellegrini SS1 (AAO92644.1); Chitala chitala SS1 (AAK97070.2); Acipenser sinensis SS1 (ACN88148.1); Epinephelus coioides SS1 (AAU93565.1); Oryzias latipes SS1 (XP_004084505.1); Sparus aurata SS1 (AFO52507.1); Homo sapiens SS1 (AAH32625.1); Pan troglodytes SS1 (JAA20675.1); Mus musculus SS1 (EDK97673.1); Gallus gallus SS1 (CAA42747.1); Latimeria chalumnae SS2 (XP_005994064.1); Ctenopharyngodon idella SS2 (ACB69425.1); Carassius auratus SS2 (AAD09631.1); Acipenser sinensis SS2 (ACN88149.1); Epinephelus coioides SS2 (AAU93567.1); Oryzias latipes SS2 (XP_004084506.1); Ctenopharyngodon idella SS3 (ACB69424.1); Carassius auratus SS3 (AAD09626.1); Chitala chitala SS3 (AAV48555.1); Epinephelus coioides SS3 (AAU93566.1); Oryzias latipes SS3 (ALD51535.1).
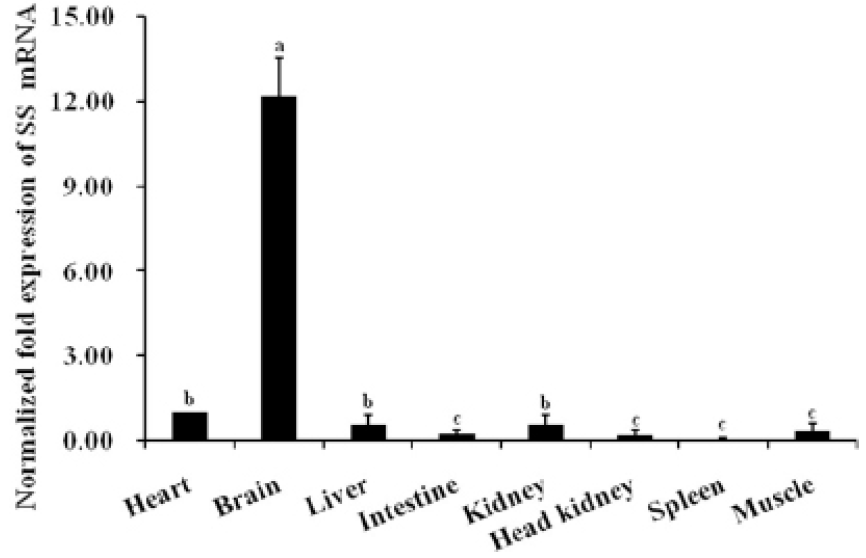
Profile of C. nasus SS1 mRNA expression determined by real-time quantitative PCR and normalized against β-actin as an internal standard. Error bars represent standard error of the mean. Different letters indicate groups that differ significantly.
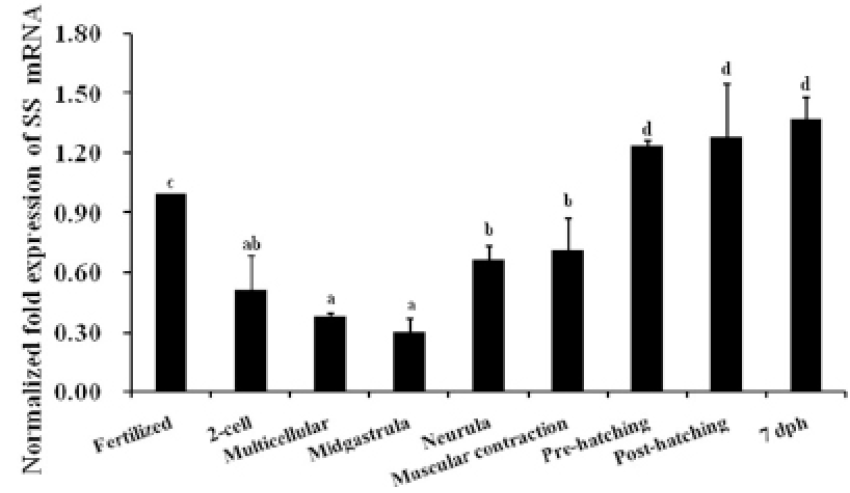
Expression of C. nasus SS1 mRNA at different developmental stages. The results are expressed as relative expression levels after standardization to β-actin gene expression. Bars represent the mean expression of three pooled samples of 30 embryos or 20–25 larvae each ±standard error. Different letters indicate groups that differ significantly. 7 dph; seven days post-hatch.


