Characterization of Aflatoxigenic and Nonaflatoxigenic Isolates of Aspergillus flavus by Cultural and Immunological Methods
Characterization of Aflatoxigenic and Nonaflatoxigenic Isolates of Aspergillus flavus by Cultural and Immunological Methods
Iftikhar Jan* and Sahib Alam
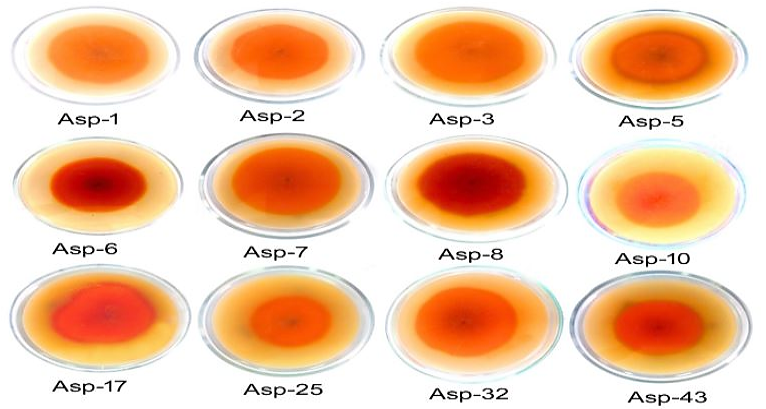
Formation of orange red color of selected Aspergillus section Flavi isolates on reverse side of AFPA medium plate.
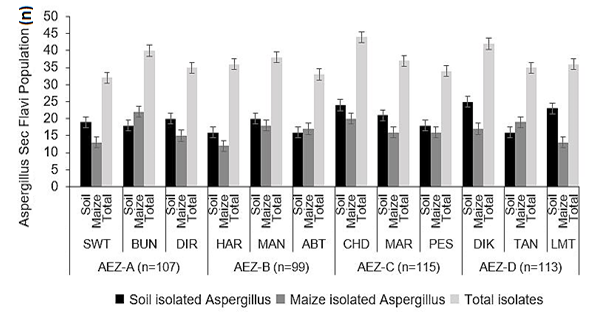
Total number of Aspergillus section Flavi population isolated from soil and stored maize grains sample taken from different agroecological zones of Khyber Pakhtunkhwa.
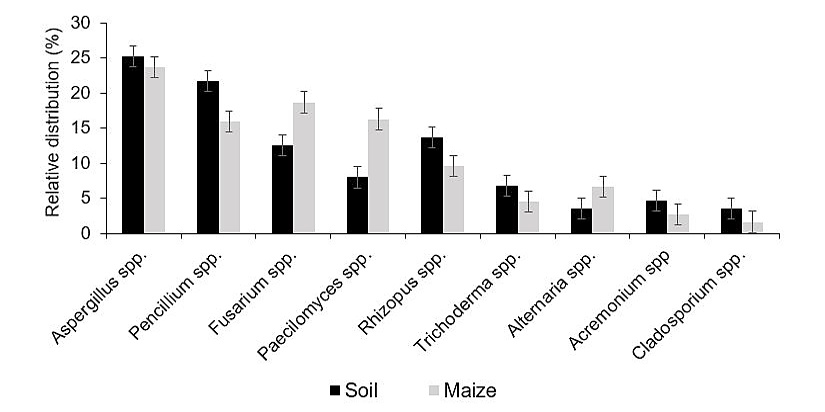
Relative distribution of common dominant fungal genera isolated from field soil and stored maize grains samples taken from different agro-ecological zones of Khyber Pakhtunkwa.
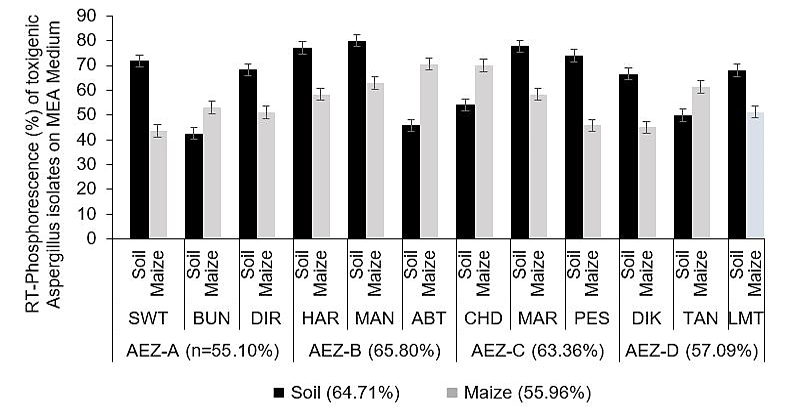
Room temperature phosphorescence (%) on malt extract agar (MEA) medium modified with β-cyclodextrin (0.3%) and sodium deoxycholate (0.6%) of Aspergillus section Flavi isolated from different agro-ecological zones of Khyber Pakhtunkwa.
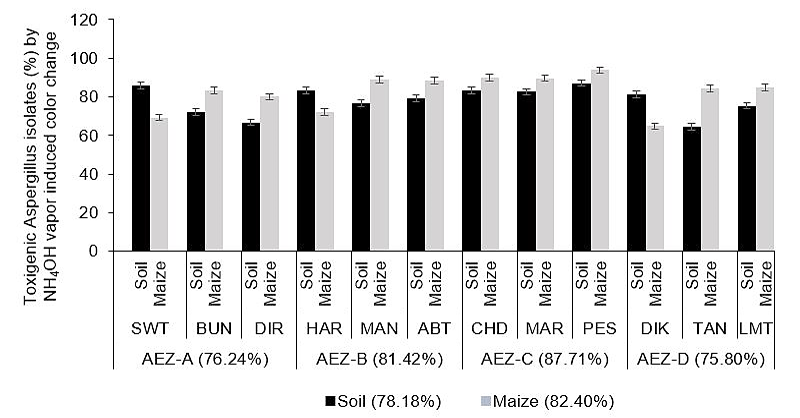
Ammonium hydroxide (NH4OH) vapor induced color change on coconut cream agar (CCA) medium of toxigenic strains (%) of Aspergillus section Flavi isolated from different agro-ecological zones of Khyber Pakhtunkwa.
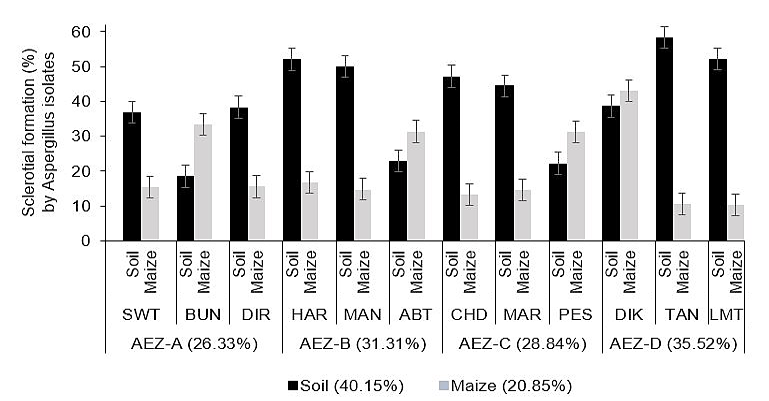
Sclerotial production (%) on czapek yeast agar (CYA) medium of aflatoxigenic isolates of Aspergillus section Flavi isolated from different agro-ecological zones of Khyber Pakhtunkwa.
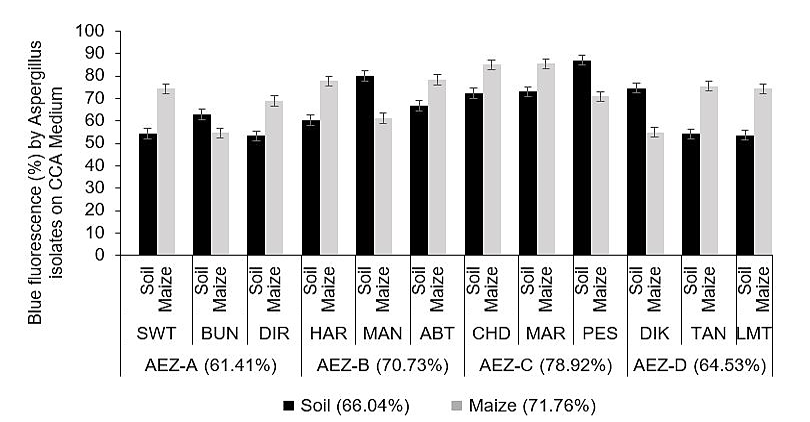
Blue flourescence (%) on coconut cream agar (CCA) medium of Aspergillus section Flavi isolated from different agro-ecological zones of Khyber Pakhtunkwa.


