Submit or Track your Manuscript LOG-IN

Changes in the Intestinal Microbes of Wild Spermophilus dauricus (Rodentia: Sciuridae) in Different Periods of Hibernation (A Model of Gut Ischemic Reperfusion Injury)

Changes in the Intestinal Microbes of Wild Spermophilus dauricus (Rodentia: Sciuridae) in Different Periods of Hibernation (A Model of Gut Ischemic Reperfusion Injury)

Chun Shi, Juanjuan Guo, Meng Li, Qi Yang and Jingang Li*

College of Life Science, Shaanxi Normal University, Xi’an 710000, China.

 
* Corresponding author: [email protected]

Fig. 1.

The rarefaction curves of all groups.

Fig. 3.

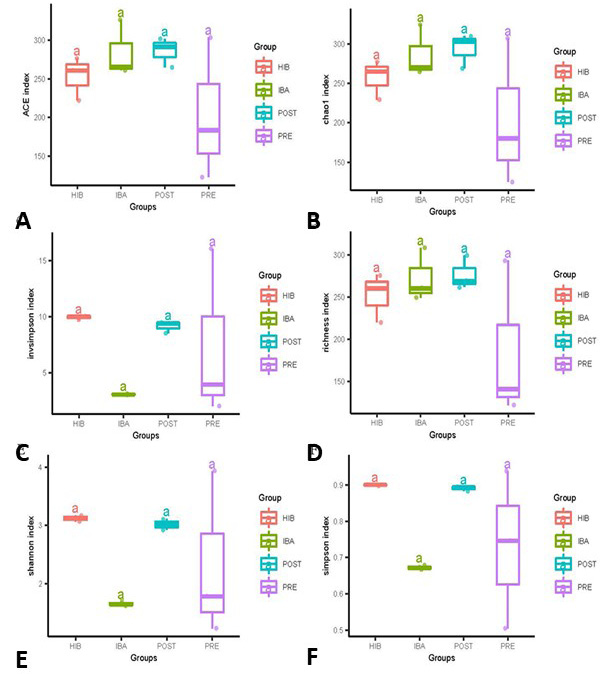
Comparison of the alpha diversities in all groups. Note: A-F depict the alpha diversity index of ACE, chao1, invsimpson, richness, Shannon, and simpson, respectively.

Fig. 4.

Beta diversity: Principal coordinate analysis (PCoA) and constrained (PCoA) analyses of Bray-Curtis distance in all groups.

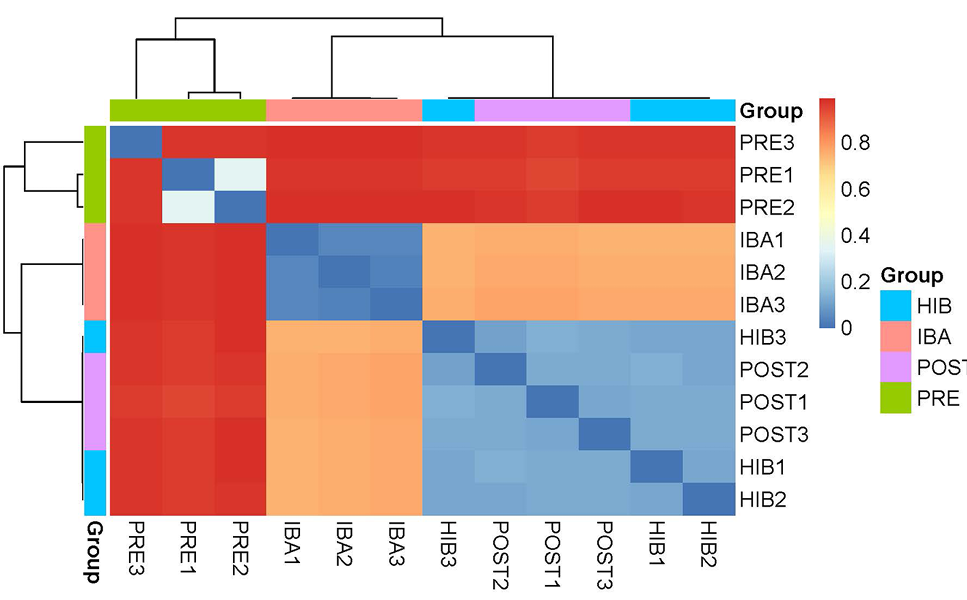
Fig. 5.

Beta diversity: Heatmap of the Bray-Curtis distance between each sample.

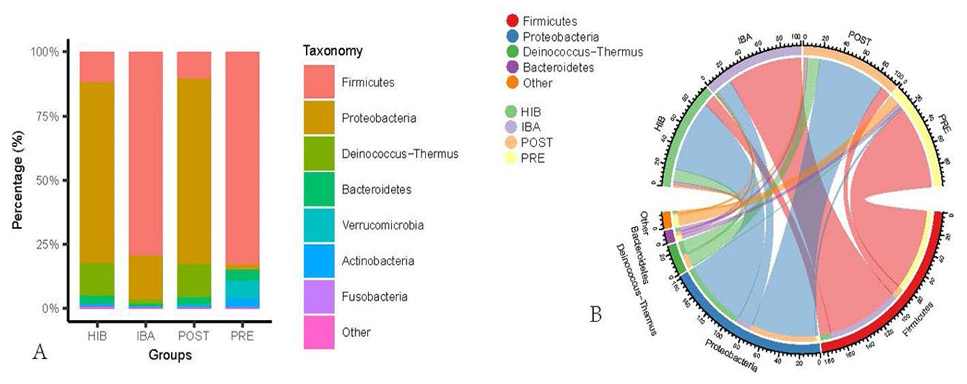
Fig. 6.

Bacterial community distribution at the phylum level. A, Stacked histogram of the intestinal bacterial abundance in each group at the phylum level (top 7). B, Chord diagram of intestinal bacterial abundance in each group at the phylum level (top 4).

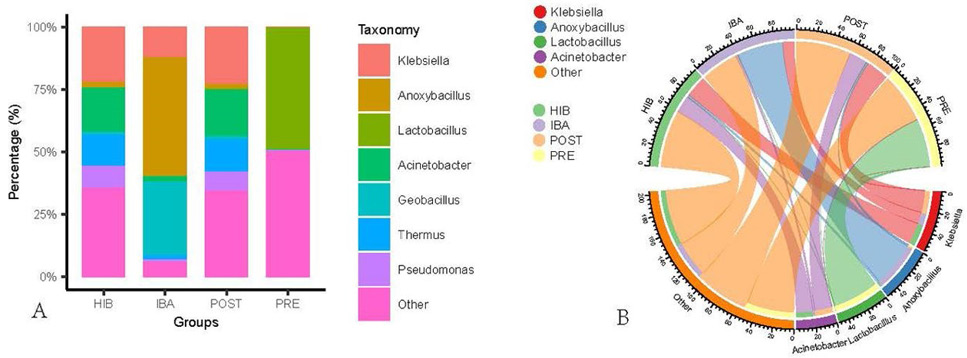
Fig. 7.
Bacterial community distribution at the genus level.
A, Stacked histogram of intestinal bacterial abundance in each group at the genus level (top 7). B, Chord diagram of intestinal bacterial abundance in each group at the genus level (top 4).
Fig. 8.
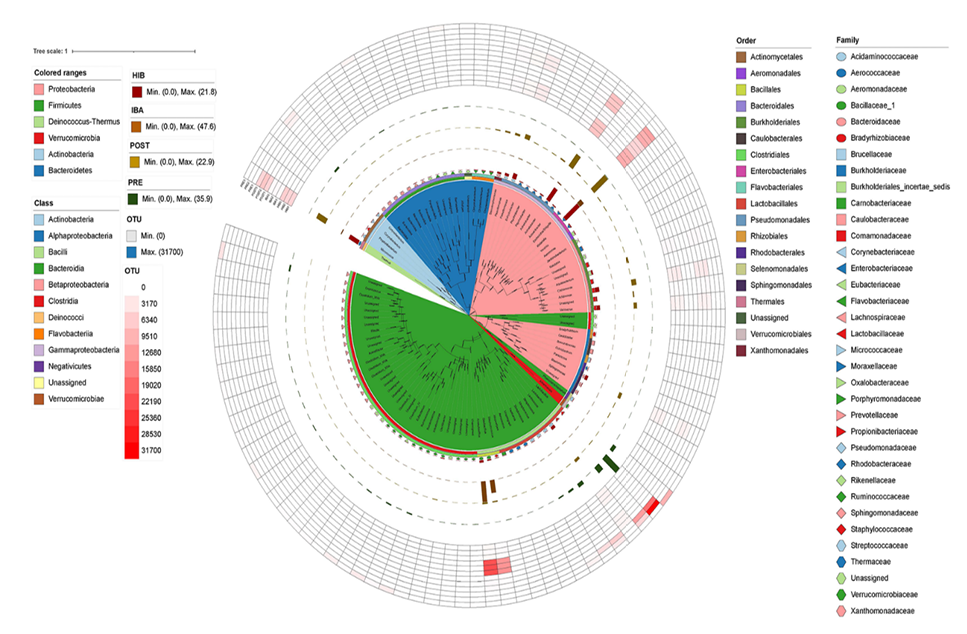
The main OTU evolutionary tree of intestinal bacteria. The OTU evolutionary tree was constructed using the Top 100 OTUs with a relative abundance greater than 0.2%. The branches of the evolutionary tree were filled with color using phylum-level bacterial classification. OTUs used the genus level to correspond to bacterial annotations. The circles of evolutionary tree from inside to outside with color bands or blocks were at the level of class, order, and family. The next level was a bar graph representing the expression level of OTUs in HIB, IBA, POST, and PRE groups. The outermost layer was a heat map of the corresponding OTU abundance in each sample.
Fig. 9.

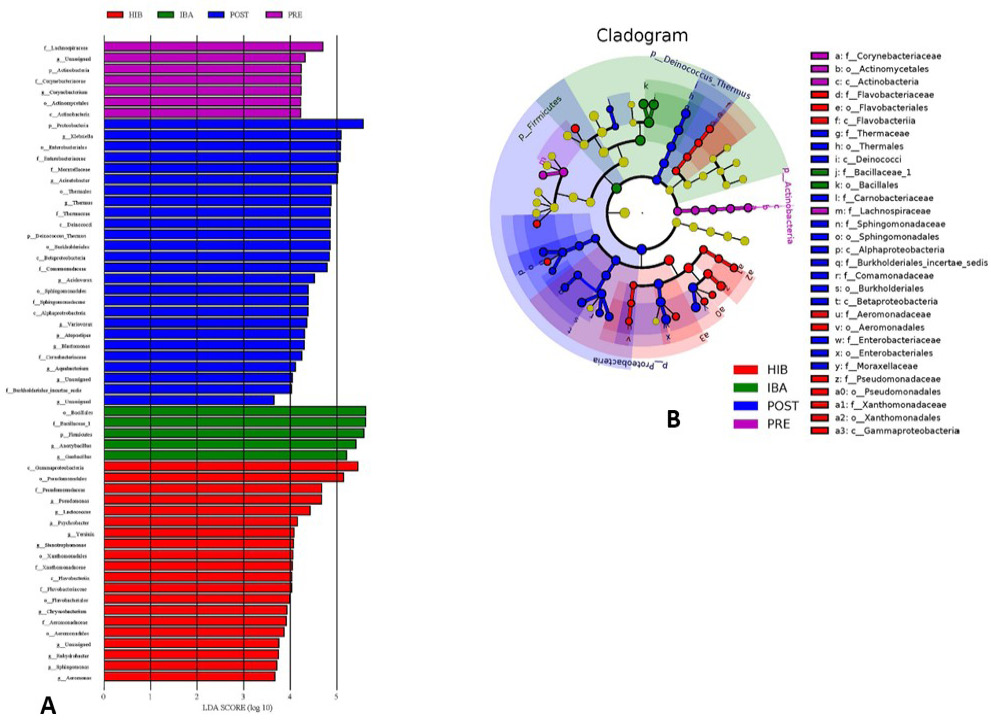
Biomarkers predicted in LEfSe. A, LEfSe result in bar; B, LEfSe result in Cladogram.

Fig. 10.
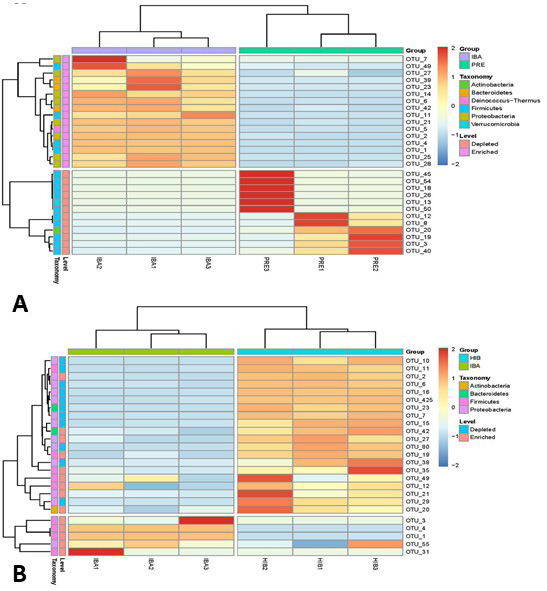
Heatmap of the OTUs with significantly different abundances in IBA, PRE, and HIB groups.
A, Significant difference in the OTU abundance between IBA and PRE groups. B, Significant difference in the OTU abundance between IBA and HIB groups.
Fig. 13.

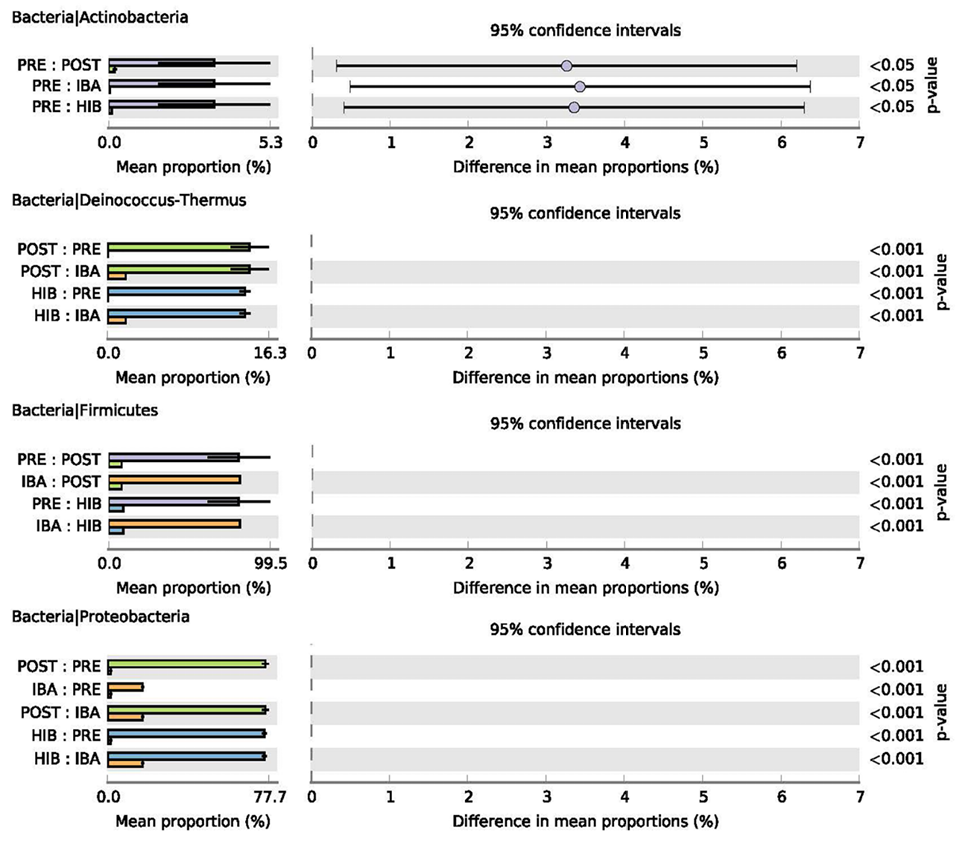
Significant differences in bacterial abundance at the phylum level.

Fig. 14.

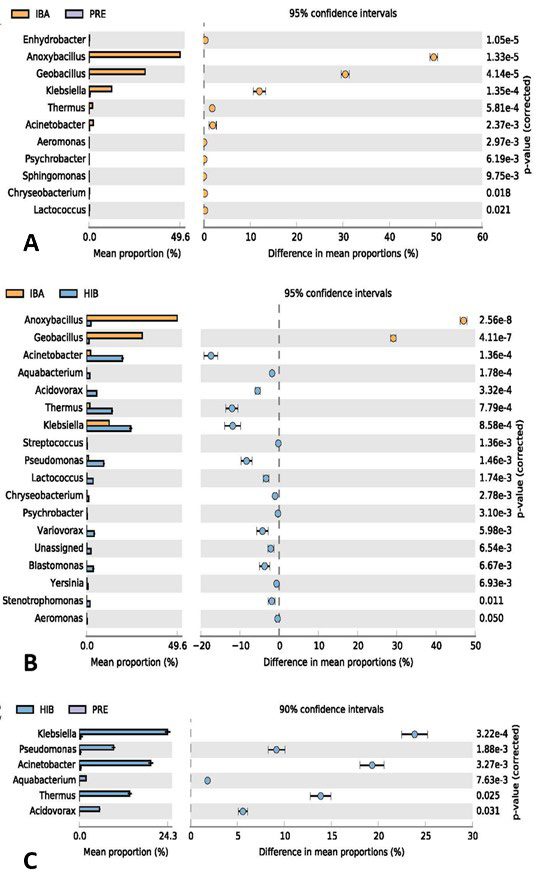
Significant differences in bacterial abundance at the genus level.

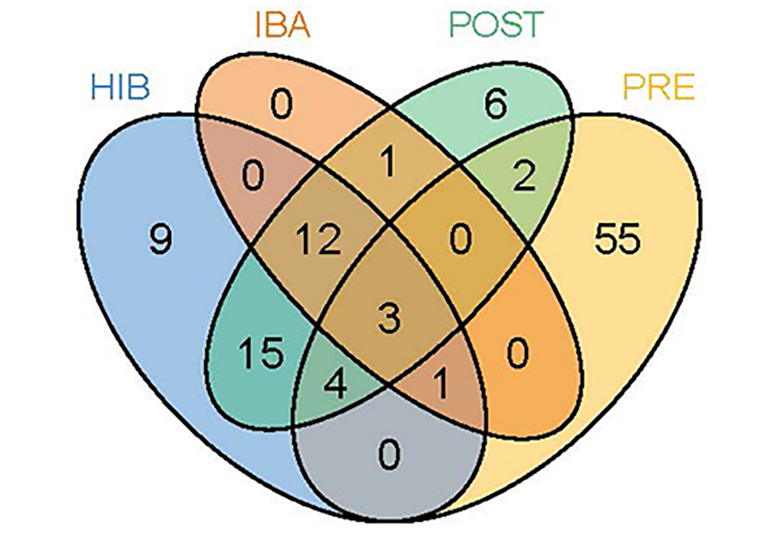
Fig. 2.

Venn figure of the OTUs in all groups.

Fig. 11.

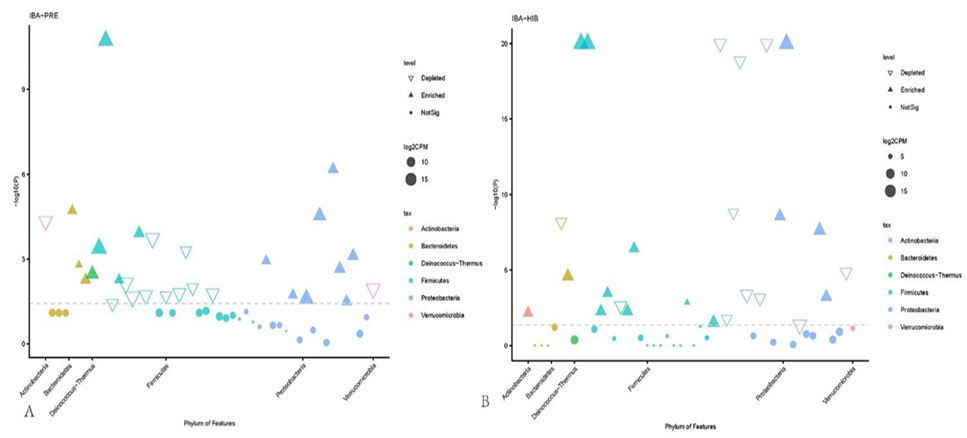
Manhattan chart of significant bacterial abundance at the phylum level in IBA, PRE, and HIB groups.

Fig. 12.

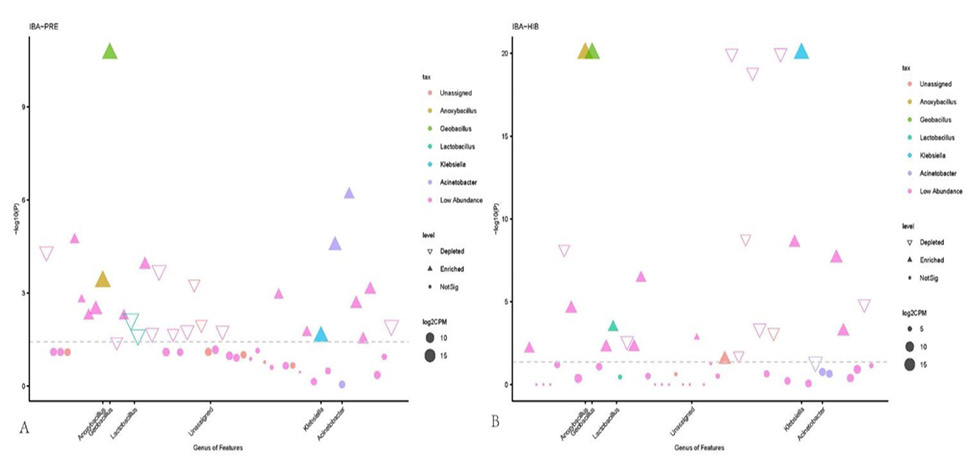
Manhattan chart of significant bacterial abundance at the genus level in IBA, PRE, and HIB groups.

Pakistan Journal of Zoology

October

Pakistan J. Zool., Vol. 56, Iss. 5, pp. 2001-2500

Featuring

Click here for more

Subscribe Today

Receive free updates on new articles, opportunities and benefits


Subscribe Unsubscribe