Submit or Track your Manuscript LOG-IN

Black Seed Oil-Alginate Nanoemulsion Characteristics Utilising an Ultrasonicator at Pilot Plant Scale

Black Seed Oil-Alginate Nanoemulsion Characteristics Utilising an Ultrasonicator at Pilot Plant Scale

Shaiqah Mohd Rus1*, Anika Z.M.R.2, Awis Sukarni Mohmad Sabere3, Mohd. Rushdi Abu Bakar4,5, Farahidah Mohamed4 and Abd Almonem Doolaanea6*


1Pharmaceutical Technology Programme, Faculty of Pharmacy and Health Sciences, Universiti Kuala Lumpur, Royal College of Medicine Perak, Jalan Greentown, 30450 Ipoh, Perak, Malaysia; 2Advanced Manufacturing and Materials Center (AMMC), Institute of Integrated Engineering, Universiti Tun Hussein Onn Malaysia, 86400 Parit Raja, Batu Pahat, Johor, Malaysia; 3Department of Pharmaceutical Chemistry, Kulliyyah of Pharmacy, International Islamic University Malaysia, Jalan Sultan Ahmad Shah, 25200 Kuantan, Pahang, Malaysia; 4Department of Pharmaceutical Technology, Kulliyyah of Pharmacy, International Islamic University Malaysia, Jalan Sultan Ahmad Shah, 25200 Kuantan, Pahang, Malaysia; 5IKOP Pharma Sdn Bhd, Jalan Sultan Ahmad Shah, 25200 Kuantan, Pahang, Malaysia; 6Senior R and D Chemist, Sabrena Experience, 1500 Dragon Street, Suite 160 Dallas, Tx 75207, USA.


*Correspondence | Shaiqah Mohd Rus and Abd Almonem Doolaanea, Pharmaceutical Technology Programme, Faculty of Pharmacy and Health Sciences, Universiti Kuala Lumpur, Royal College of Medicine Perak, Jalan Greentown, 30450 Ipoh, Perak, Malaysia; Senior R and D Chemist, Sabrena Experience, 1500 Dragon Street, Suite 160 Dallas, Tx 75207, USA; Email: [email protected], [email protected] 

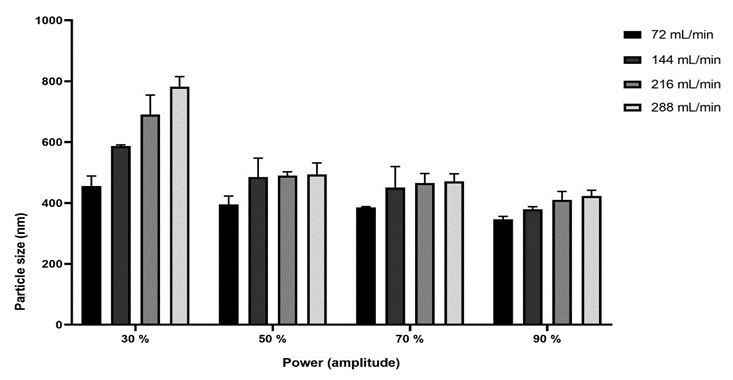
Figure 1:

The BSO alginate nanoemulsion particle size of a flow cell sonicator at various flow rates and power (amplitude). Data are shown as mean ± SD (error bar) (n=3).

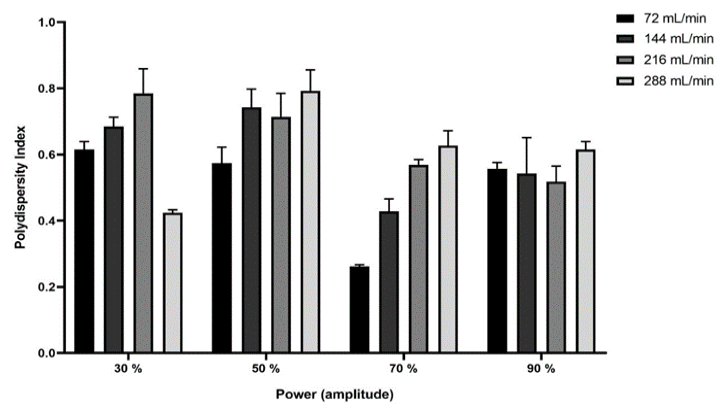
Figure 2:

The flow cell sonicator’s PdI of BSO alginate nanoemulsion at various flow rates and power (amplitude). Data are shown as mean ± SD (error bar) (n=3).

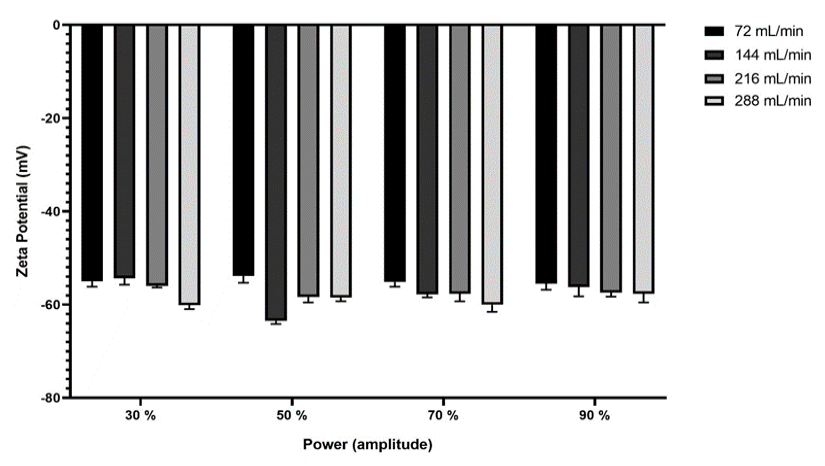
Figure 3:

The zeta potential of a flow cell sonicator’s BSO alginate nanoemulsion at various flow rates and power (amplitude). Data are shown as mean ± SD (error bar) (n=3).

Sarhad Journal of Agriculture

September

Vol.40, Iss. 3, Pages 680-1101

Featuring

Click here for more

Subscribe Today

Receive free updates on new articles, opportunities and benefits


Subscribe Unsubscribe