Invalid page request
Invalid page request
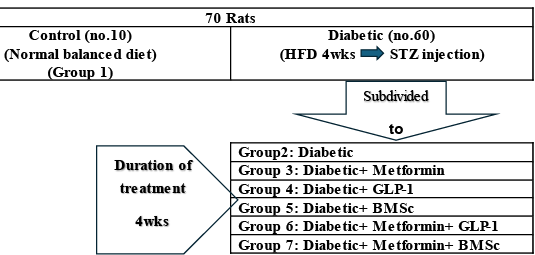
Simple illustration of experimental design.
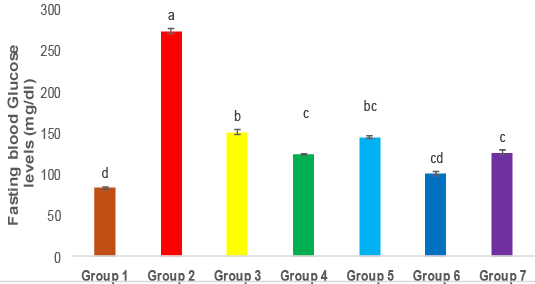
FBG levels in different treated groups, Means bars for all groups with error bars (± SE) for glucose (mg/dL), The P≤0.05 indicates that the means with varying superscripts are significantly distinct. Group 1: Control, Group 2: Diabetic, Group3: Diabetic + Metformin, Group 4: Diabetic + GLP1, Group 5: Diabetic + BMSCs, Group 6: Diabetic + Metformin + GLP1, Group 7: Diabetic + Metformin + BMSCs.
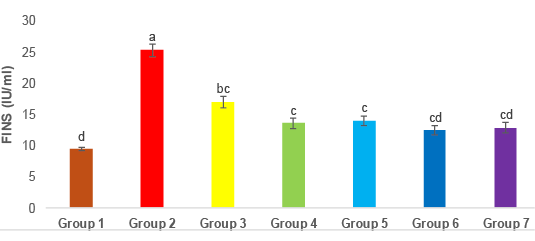
FINS levels in different treated groups. Means bars for all groups with error bars (± SE) for insulin (IU/ml) The P≤0.05 indicates that the means with varying superscripts are significantly distinct. Group 1: Control, Group 2: Diabetic, Group3: Diabetic + Metformin, Group 4: Diabetic + GLP1, Group 5: Diabetic + BMSCs, Group 6: Diabetic + Metformin + GLP1, Group 7: Diabetic + Metformin + BMSCs.
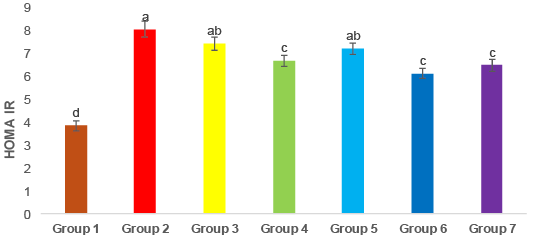
HOMA -IR in different treated groups. Means bars for all groups with error bars (± SE) for calculated HOMA-IR. The P≤0.05 indicates that the means with varying superscripts are significantly distinct. Group 1: Control, Group 2: Diabetic, Group3: Diabetic + Metformin, Group 4: Diabetic + GLP1, Group 5: Diabetic + BMSCs, Group 6: Diabetic + Metformin + GLP1, Group 7: Diabetic + Metformin + BMSCs.
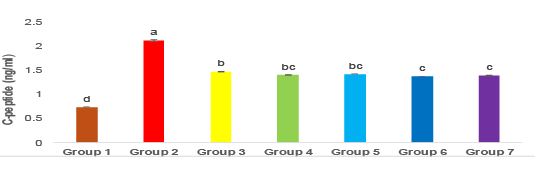
C-Peptide levels in different treated groups. Means bars for all groups with error bars (± SE) for C-Peptide (ng/ml). The P≤0.05 indicates that the means with varying superscripts are significantly distinct. Group 1: Control, Group 2: Diabetic, Group3: Diabetic + Metformin, Group 4: Diabetic + GLP1, Group 5: Diabetic + BMSCs, Group 6: Diabetic + Metformin + GLP1, Group 7: Diabetic + Metformin + BMSCs.
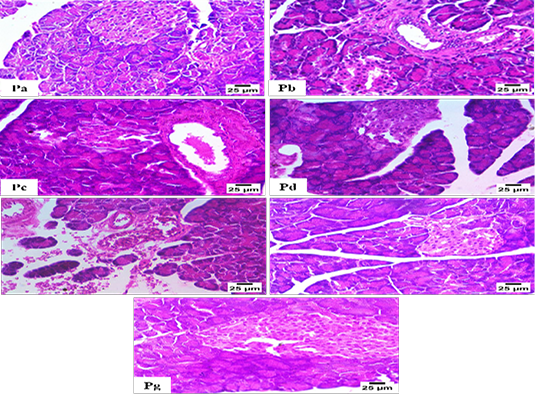
Histopathological Examination for Pancreas (H and E); Figure Pa: normal structure of pancreatic acini and few beta cells (Group 1). Figure Pb: pre-acinar fibrosis with infiltration by many mononuclear inflammatory cells, presence of nuclear pyknosis, and decreasing number of beta cells (Group 2). Figure Pc: pre-acinar fibrosis with infiltration (Group 3). Figure Pd: necrobiotic changes in some beta cells, including vacuolar degeneration and pyknotic nuclei. (Group 4). Figure Pe: pancreatic hemorrhage between acini and presence of necrobiotic changes in some acini (Group 5). Figure Pf: Some beta cells’ nuclear pyknosis and vacuolar degeneration (Group 6). Figure Pg: normal histological structure of pancreatic acini and beta cells (Group 7).
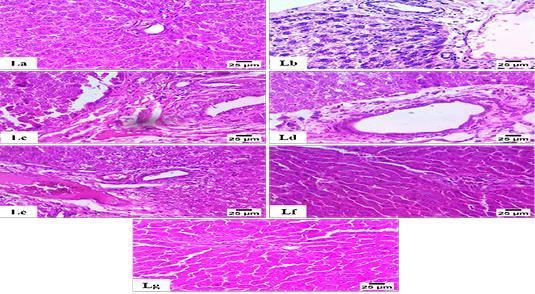
Histopathological Examination for Liver (H and E); Figure La: shows a normal histological structure of the portal area and hepatocytes (Group 1). Figure Lb: shows necrobiotic changes in hepatocytes with a few number of inflammatory cells between hepatocytes and the presence of portal fibrosis (Group 2). Figure Lc: shows portal fibrosis with newly formed bile ductules (Group 3). Figure Ld: shows portal fibrosis with infiltration by a small number of mononuclear inflammatory cells (Group 4). Figure Le: Demonstrating portal fibrosis characterized by the infiltration of a small number of mononuclear inflammatory cells and the accumulation of blood vessels in the portal region (Group 5). Figure Lf: shows mild portal fibrosis with infiltration by a small number of mononuclear inflammatory cells (Group 6). Figure Lg: show the normal histological structure of the portal area and hepatocytes (Group 7).
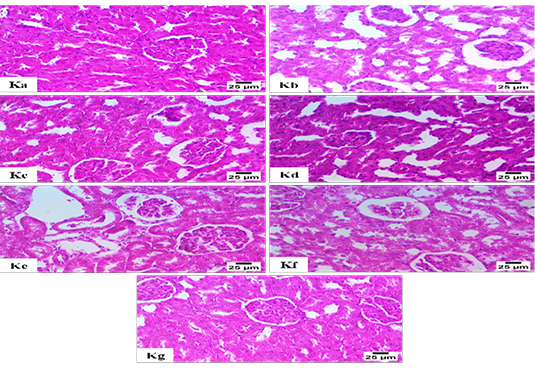
Histopathological Examination for Kidney (H and E); Figure Ka: Presents a typical histological arrangement of the glomeruli and renal tubules (Group 1), Figure Kb: shows an increased urinary space of renal glomeruli and the presence of necrobiotic changes in some renal tubules (Group 2), Figure Kc: shows some glomeruli collapsed, increase urinary space in glomeruli and presence of necrobiotic changes in some renal tubules (Group 3), Figure Kd: showing nuclear pyknosis in the epithelium of some renal tubules (Group 4). Figure Ke: shows marked degeneration in diverse glomeruli and the presence of nuclear pyknosis in the epithelium of some renal tubules (Group 5). Figure Kf: shows an increase in urinary space in renal glomeruli and necrobiotic changes in some renal tubules (Group 6). Figure Kg: shows a normal histological structure of glomeruli and renal tubules (Group 7).
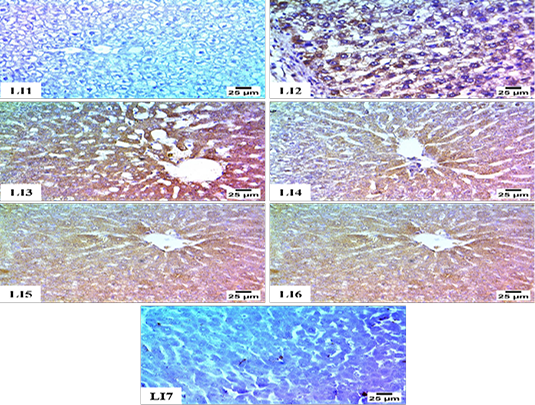
Immunohistochemistry for Hepatic Expression of TGF-β; Figure LI1. Negative expression for TGF-β in hepatocytes (Group 1). Figure LI2. Sever positive expression for TGF-β in the cytoplasm of hepatocytes (Group 2). Figure. LI3. Sever positive expression for TGF-β in the cytoplasm of hepatocytes (Group 3). Figure LI4. Moderate positive expression for TGF-β in the cytoplasm of hepatocytes (Group 4). Figure LI5. Moderate positive expression for TGF-β in the cytoplasm of hepatocytes (Group 5). Figure LI6. Moderate positive expression for TGF-β in the cytoplasm of hepatocytes (Group 6) Figure LI7.negative expression for TGF-β in hepatocytes(Group 7).
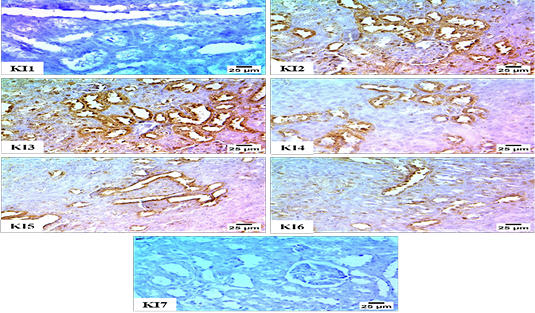
Immunohistochemistry for Renal Expression of TGF-β; Figure KI1: Negative expression for TGF-β in renal tubules (Group 1), Figure KI2: Sever +ve expression for TGF-β in cytoplasm of renal tubules (Group 2). Figure KI3. Severe +ve expression for TGF-β in the cytoplasm of renal tubules (Group 3). Figure KI4: Moderate +ve expression for TGF-β in renal tubular cytoplasm (Group 4). Figure KI5: Moderate +ve expression for TGF-β in renal tubular cytoplasm (Group 5). Figure KI6L: Moderate +ve expression for TGF-β in renal tubular cytoplasm (Group 6). Figure KI7: -ve expression for TGF-β in renal tubules (Group 7).
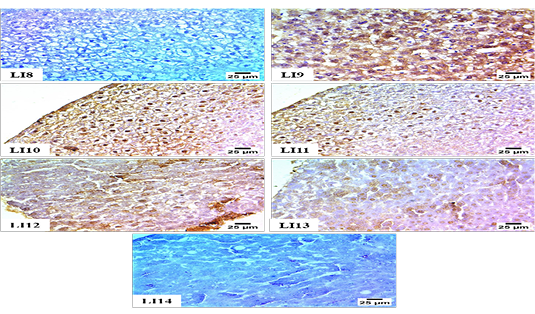
Immunohistochemistry for hepatic expression of NF-Kβ; Figure lI8: Negative expression for NF-Kβ in hepatocytes (Group 1), Figure lI9: sever +ve expression for NF-Kβ in nuclei and cytoplasm of hepatocytes (Group 2), Figure LI10: Sever +ve expression for NF-Kβ in nuclei and cytoplasm of hepatocytes (Group 3), Figure LI11: Sever +ve expression for NF-Kβ in nuclei of hepatocytes (Group 4). Figure LI12: Moderate +ve expression for NF-Kβ in nuclei of hepatocytes (Group 5). Figure LI13: Moderate +ve expression for NF-Kβ in nuclei of hepatocytes (Group 6), Figure I14: -ve expression for NF-Kβ in hepatocytes (Group 7).
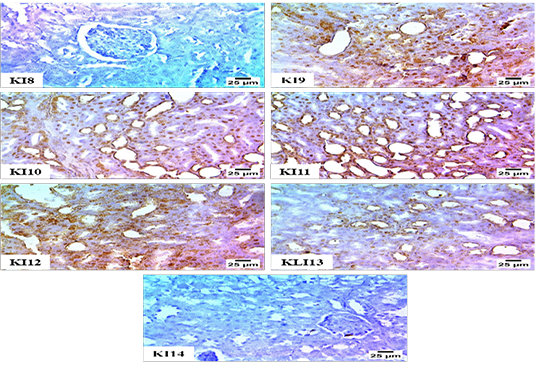
Immunohistochemistry for renal expression of NF-Kβ; Figure KI8: Negative expression for NF-Kβ in renal tubules (Group1). Figure KI9: Sever +ve expression for NF-Kβ in nuclei of the renal tubular epithelium (Group2). Figure KI10: Sever +ve expression for NF-Kβ in nuclei of the renal tubular epithelium (Group 3). Figure KI11: +ve expression for NF-Kβ in the renal tubular epithelium (Group 4). Figure KI12: Moderate +ve expression for NF-Kβ in the renal tubular epithelium (Group 5). Fig: KI13: moderate +ve expression for NF-Kβ in nuclei of the renal tubular epithelium (Group 6). Figure KI14: -ve expression for NF-Kβ in renal tubules (Group 7).


