Avian Coronaviruses in Wild Birds along Brazilian Segment of Atlantic Flyway
Avian Coronaviruses in Wild Birds along Brazilian Segment of Atlantic Flyway
Barbosa Carla1*, Gregori Fabio2, Thomazelli Luciano1, Oliveira Amanda1, Araújo Jansen1, Ometto Tatiana1, Marcatti Roberta3, Nardi Marcelo3, Paludo Danielle4, Utecht Nathalia1 and Edison Durigon1
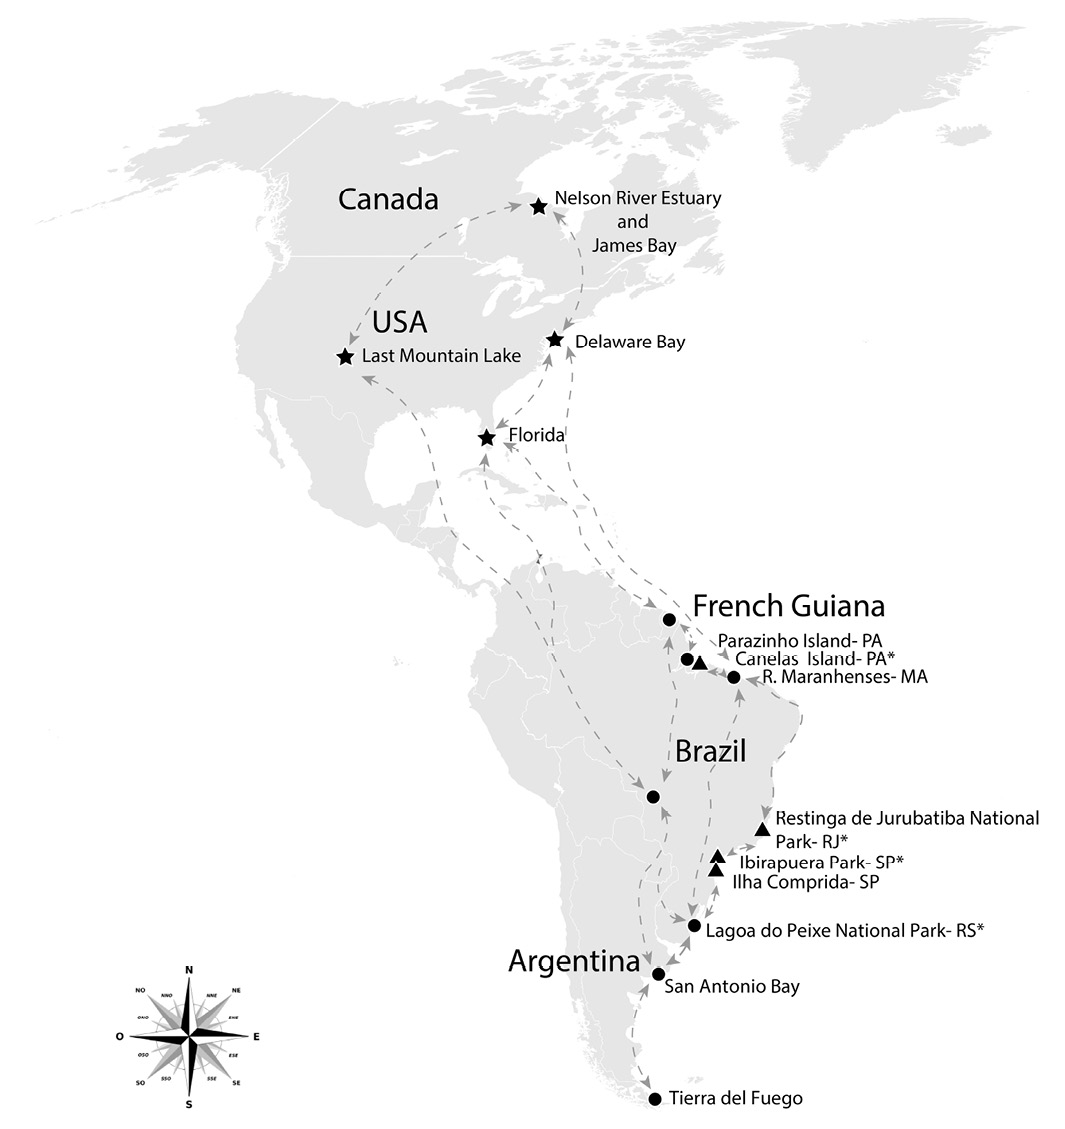
Map showing major migratory routes in the Americas. Reproduction sites are represented with stars, wintering areas are depicted as circles and sample collection sites are represented as triangles. Names depicted with asterisks refer to sites that presented positive samples.
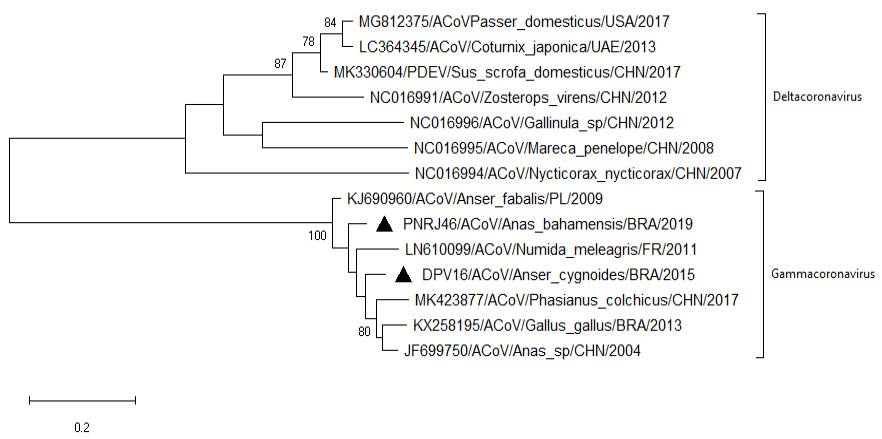
Phylogenetic tree showing sequences of the coding region of Gamma coronaviruses and Delta coronavirus N protein. Nucleotide neighbor-joining distance tree (Tamura 3-parameter substitution model) for partial N gene sequence (407 bp). Strains detected in the present study are preceded by black triangles. The numbers at each node are bootstrap values greater than 70 from 500 replicates. The bar represents the number of substitutions per site.
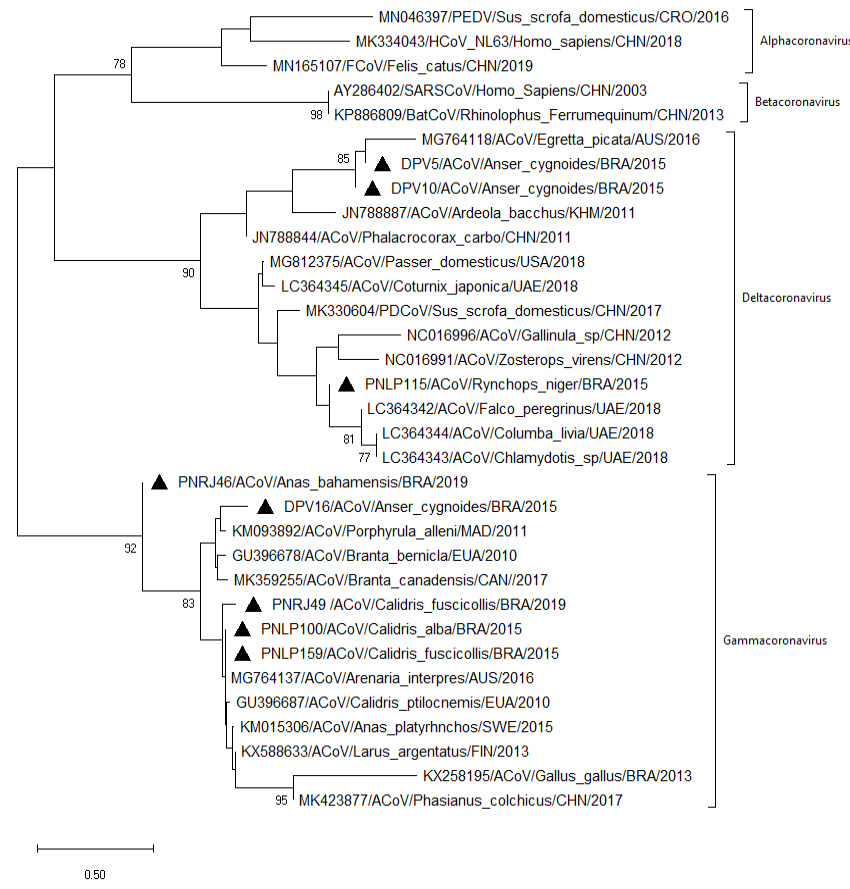
Nucleotide neighbor-joining distance tree (Tamura 3-parameter substitution model) for the partial RdRp (440 bp) showing the known groups. Strains detected in the present study are preceded by black triangles. The numbers at each node are bootstrap values greater than 70 from 500 replicates. The bar represents the number of substitutions per site.
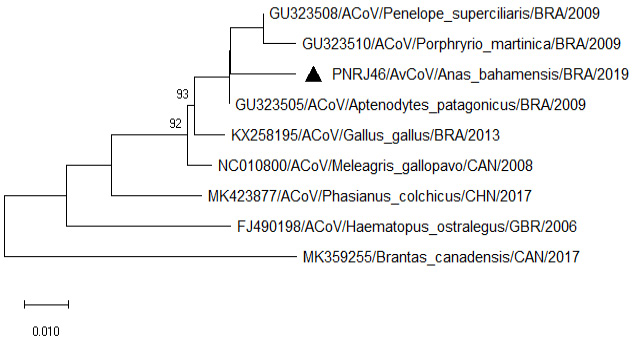
Phylogenetic tree showing sequences of the coding region of Gamma coronaviruses close related to chicken AvCoVs. Nucleotide neighbor-joining distance tree (Tamura 3-parameter substitution model) for the partial 3’ UTR (397 bp). Strains detected in the present study are preceded by black triangles. The numbers at each node are bootstrap values greater than 70 from 500 replicates. The bar represents the number of substitutions per site.


