
Analysis of Livelihood Asset of Agricultural Households Influencing Livelihood Strategies in Khyber Pakhtunkhwa Pakistan


Research Article
Analysis of Livelihood Asset of Agricultural Households Influencing Livelihood Strategies in Khyber Pakhtunkhwa Pakistan
Abdul Hassan1*, Shahnaz Akhtar1 and Muhammad Ishaq2
1Institute of Development Studies, The University of Agriculture, Peshawar, Khyber Pakhtunkhwa, Pakistan; 2Social Sciences Division, Pakistan Agricultural Research Council, Islamabad, Pakistan.
Abstract | This article attempts to analyze livelihood asset that influence the livelihood strategies of agricultural households in Khyber Pakhtunkhwa, Pakistan. The study used multinomial logit model for determining the connection amongst livelihood asset and livelihood strategies. Average index value of livelihood asset was 0.297 in the area, that indicates the disadvantageous nature in livelihood asset of agricultural households, uncovering the subtle living standard of agricultural households and lacking prospects of economic development. The research findings reveal that human capital, financial and social capital of livelihood asset has positive significant effect on the choice of agricultural households’ livelihood strategies in the models of rural households type II and rural households type III. The empirical findings depicted that the more human capital, financial capital and social capital that are owned by agricultural households, probably more they have to select strategies of livelihood involving to be engaged in rural households type II and rural households type III. Similarly, the effect of physical capital has positive significant effect on the choice of strategy of livelihood in rural households type III model, in other words, the more physical capital owned by agricultural households, probably more they have to select strategies of livelihood involving to be engaged in rural households type III model. The empirical findings orate for high demand of up-gradation of livelihood asset in all capitals of agricultural households.
Received | July 28, 2023; Accepted | November 11, 2023; Published | January 25, 2024
*Correspondence | Abdul Hassan, Institute of Development Studies, The University of Agriculture, Peshawar, Khyber Pakhtunkhwa, Pakistan; Email: ahassan7796@gmail.com
Citation |Hassan, A., S. Akhtar and M. Ishaq. 2024. Analysis of livelihood asset of agricultural households influencing livelihood strategies in Khyber Pakhtunkhwa Pakistan. Sarhad Journal of Agriculture, 40(1): 54-63.
DOI | https://dx.doi.org/10.17582/journal.sja/2024/40.1.54.63
Keywords | Pakistan, Livelihood, Asset, Strategies, Small, Farmers
Copyright: 2024 by the authors. Licensee ResearchersLinks Ltd, England, UK.
This article is an open access article distributed under the terms and conditions of the Creative Commons Attribution (CC BY) license (https://creativecommons.org/licenses/by/4.0/).
Introduction
Livelihood strategies are choices and activities that are adopted for attaining household livelihood goals together with strategies of investment, activities of production and arrangements of maternity (Liu et al., 2018). People with wider choices have better livelihood than those with fewer choices (Chambers and Conway, 1992). Change in livelihood strategies of farm household is key in respect to sustainable development, livelihood sustainability, ecological security and land use change of rural areas (Liu et al., 2018). Agricultural households might adopt diverse strategies like migration, intensification or extensification of agriculture and diversification of livelihood for risk management and improving economic position (Scoones, 1998; Lingam, 2015).
Agriculture is utmost vital for the livelihood of Pakistani inhabitants. Though, its potential for advancing the wellbeing of population was neglected by the international community for meeting the security challenges in the country. That resulted in bringing down the momentum in the growth of rural economy, leaving rural population for facing unending poverty, and security of food, added with limited market access and public services that are essential for advance economy. The structural transformation of Pakistan’s economy is slow and steady that transformed the role of rural development in the country’s economy (Spielman et al., 2016). The notion of rural development until 1970s was one and the same with the development of agriculture. Though, currently, the development of rural is not only comprised of growth in output and physical income but also includes the improvement in life quality (Maqbool and Bashir, 2009). The situation leads to a sector of non-agriculture (Malik, 2008) that changed the livelihood strategies of rural people. These changes in strategies have substantial effect on the use of land, livelihood sustainability and ecological safety (Liu et al., 2018). Agricultural production being an essential source of mass population of rural livelihood, needs substantial asset engagement for its sustainability and continuation (Udoh et al., 2017). Severe changes in environment take along drastic changes in the livelihood assets leading to change the strategies of livelihood of agricultural households (Liu et al., 2018). The rural population today is involved in non-farm sector like casual laborers, daily wagers, businesses, services in private and government sector, and remittances within and abroad of the country (Urrehman et al., 2008).
The Department for International Development (DFID) of UK developed Sustainable Livelihood Framework (SLF). The aim of SLF was to improve the functioning and quality of development activities that were focusing poverty. The core of SLF is strengths of people that are applied to different social groups and geographical areas, multiple actors, a number of effects of recognition of people’s varying and numerous livelihood strategies, implemented by inhabitants to secure the people’s livelihoods, manifold outcomes of livelihood and manifold sustainable aspects. The assumption in Sustainable Livelihood Framework is the dependence of inhabitants on various combinations of asset that are affected by variability in vulnerabilities for output of livelihood made by their own priorities and choices. Principally, DFID (1999) identified five capitals of livelihood asset such as Human Capital (HC), Physical Capital (PC), Natural Capital (NC), Social Capital (SC) and Financial Capital (FC), representing the building blocks of livelihood. The dependency and holding on asset for livelihood differs within households, subject to form of resource endowment, demography, and more characteristics of economic together with external factors such as technologies, prices, policies and markets (Su and Shang, 2012).
The owned assets of livelihood by agricultural households are the basis to know the opportunities of choices, livelihood strategies and environmental risk of these households (Liu et al., 2018). The existing literature from Khyber Pakhtunkhwa, Pakistan is insufficient regarding rural people about the significance of livelihood asset and to understand the livelihood strategies (Israr and Khan, 2010; Kanwal et al., 2016; Ping et al., 2016; Shahbaz et al., 2017). The contributions of these studies undertaken were imperative; but livelihood strategies influenced by livelihood asset were hardly studied. The studies on livelihood asset and livelihood strategies are limited (Liu et al., 2018) along with no studies of livelihood asset and livelihood strategies of small farmers in the province of Khyber Pakhtunkhwa of Pakistan has been carried out. The empirical findings of the asset of livelihood and strategies of livelihood of agricultural households facilitate in knowing the condition of livelihood of rural people and in framing reasonable policies of poverty reduction (Liu et al., 2018). The empirical findings of this research will add knowledge to the present literature and assist the policy makers in rural development during initiating future programs.
Materials and Methods
Area selection and data sources
The subject paper was executed in Khyber Pakhtunkhwa province of Pakistan. The province is presumably susceptible to the effect of climate change. The cultivatable land of the province is one-fifth, mostly possessed by small farmers. Based on temperature, rainfall, climate, topography and altitude, Khyber Pakhtunkhwa province has four agro-ecological zones (Government of Khyber Pakhtunkhwa, 2016). Central Valley Plain (CVP) is one of the agro-ecological zone selected for this study where the livelihood of the people with more than four-fifth are depending on agricultural income (Government of Khyber Pakhtunkhwa, 2016).
Multistage sampling technique was used for selection of respondents. Two districts, Peshawar and Nowshera out of seven districts (Mardan, Peshawar, Nowshera, Charsadda, Swabi, Hangu and Kohat) of CVP were randomly selected tailed with selection of one tehsil from each district and followed by random selection of two union councils from each tehsil and from each union council selected randomly two villages. These eight villages selected during sampling constituted the sample frame for formulating the sample size. Small agricultural households were the sample unit of this study. Solwin Sampling Procedure was utilized for the selection of agricultural households in the selected eight villages. To avoid un-biasedness, that might be due to, according to Saunders et al. (2016): respondent ineligibility, respondent locality, respondent refusal and respondent positioned but not able to contact (2016), and to select representative sample from the total population, Saunders et al. (2016) procedure was used. Moreover, requisite sample by village was obtained by applying proportional allocation technique. The data has been cleaned by removing influential outliers and nonsensical responses. The sample size obtained in this study was 349 agricultural households. The data were cleaned thru removing the influential outliers and nonsensical responses, the sample size used for furthest data analysis in this study were 307 (Hassan et al., 2021).
A questionnaire that was well-structured and pre-tested was utilized for collection of primary data from agricultural households. At convenient places, the respondents were interviewed to collect data during April 2019 to June 2019. Rapport was developed with the randomly selected sampled farmers to disclose their real income after promising them that the collected data would only be for research work and be strictly confidential.
Variables selection
Livelihood asset have an important role in nourishing the process of rural development and agricultural production thru resolving the inherited issues of the agricultural household’s livelihood and enhance their ability for self-development (Peter, 1999; Su and Shang, 2012). The nature and conditions of the livelihood asset that was possessed by household or individual are the foundation for knowing the strategies of livelihood, opportunities choice and the environmental hazards of the household or individual (Liu et al., 2018). Poor farmers are usually categorized with severe scarcity of asset; maximum importance is normally given to the benefit of short-term (Ellis-Jones and Mason, 1999). The concentration on asset might support for defining the distinctive roles of public and non-public sectors in strengthening and building of asset bases (Siegel, 2005). Quantifying the asset of agricultural households characteristics, the coming development trends that are mainly important to expect the strategy, understanding current living situations and vulnerability of agricultural households (Zhifei et al., 2018). The choice of variables in livelihood studies plays principal role as combining different variables along with different definitions can influence the study results because of disparity in their development level and their livelihood dimension. The study in hand adopted the classification of livelihood asset of The Department for International Development (1999) adding with reference to the literature: Bazezew et al. (2013), Xu et al. (2015), Arias (2017), Udoh et al. (2017), Ma et al. (2018), Liu et al. (2018), Zhifei et al. (2018) and others.
Household size and composition, education, knowledge, age, skills, good health, earning members, labor capacity and ability to work of household are the variables of Human Capital (HC) (The Department for International Development, 1999). The ability of farmers’ for using other capitals within sustainable livelihood framework was determined by the quantity and quality of HC. Decision taking is mainly affected by absence of HC (Su and Shang, 2010). In the rural areas the stimulation of farm and non-farm activities requires access to and investment in health and education sectors for influencing the opportunities of livelihood of households and benefits on other asset in rural areas (Siegel, 2005). Labor capacity, health status and education of labor were selected to represent HC. NC in rural research is frequently used (Moser and Felton, 2007). Soil, soil fertility, land, trees, biodiversity, water, forests, fuel wood, wild life, agro-ecological potential, environmental resources, atmosphere, wetlands and access to these are considered as NC. The highly significant NC is the land resources of the rural families (Bazezew et al., 2013; Belay and Bewket, 2013). Land represents the major base of wealth (Ellis-Jones and Mason, 1999). People were empowered with access to land that build productive and stable lives (Meinzen-Dick et al., 2011). Household land, the land ownership and soil quality were selected to represent the NC. Housing condition and public services were selected to represent the PC. People are empowered with access to financial capital for generating lives that were productive and stable (Meinzen-Dick et al., 2011). Credit supply, credit access, income, savings (liquidity), expenditures, inflows, indebtedness, liquid assets (jewellery, livestock), insurance, grains stock, pension and property are considered as FC. Access to formal financial source and livestock were used to represent the FC. People are supported with access to social capital for building lives as stable and productive (Meinzen-Dick et al., 2011). Networks, associations in groups, participation in community activities, relative and friend relation net, neighbourhood communication relationship of trust, decision making process, intra-household violence, access to institutions, labor assistance, labor exchange group, funds assistance, rural public services, non-governmental organizations, access to market, member of political party and satisfaction at village are considered as SC. Institutional membership and service providers were considered for representing SC. Institutional membership is assumed for the quality of public institution that are employed for the welfare of farmers while service providers is assumed for existing the private services accessed by farmers in the area (Table 1).
Table 1: Definition and description of variables.
|
Capitals |
Variables |
Definition |
Unit |
Expected relation |
|
Human |
Labor capacity |
Household labor |
Per cent of household members |
Household with less active labour members are likely to have less livelihood output |
|
Status of health |
Household with chronic patient |
Number |
Household having more chronic patients are likely to have less livelihood output |
|
|
Labor education* |
Average education of household labor force |
Years |
Household members with education are more likely to have more livelihood outputs |
|
|
Natural |
Land of household |
Owned land by household (community land is not included) |
Acres |
Household having no own land is likely to have less livelihood output |
|
Quality of soil |
Quality and fertility of soil as perceived by farmers |
Non-satisfactory = 0, Satisfactory = 1 |
High level of soil quality are supposed to higher the agricultural production, hence higher livelihood output |
|
|
Physical |
Housing condition |
Per capita space of house |
Marla (1 marla =0.00625 acre) |
Household having more per capita space are likely to have happy and good health and expected to have more livelihood output |
|
Public services |
Distance to public services |
Kilometer |
Households located closer to public services are more likely to have good livelihood output |
|
|
Financial |
Livestock** |
Equivalent units of livestock |
Number |
Household with more number of livestock are supposed to have more livelihood output |
|
Access to formal financial credit |
Household get into formal institutes for obtaining loan |
Yes = 1, No = 0 |
Household with /or have access to formal financial credit are more likely to have provision of timely inputs, hence more livelihood output. |
|
|
Social |
Institutional membership |
Member of the model farm services center (MFSC) |
Yes = 1, No = 0 |
Household having membership in MFSC are expected to have more livelihood output |
|
Service providers |
Access to service providers as perceived by farmers |
Yes = 1, No = 0 |
Household with access to service providers are expected to have more livelihood output |
*Education of labor force was formulated following UNESCO Institute for Statistics (UIS, 2013). In this study, illiterate were those with no schooling is 0, 4 schooling years is primary, 8 years is secondary, 10 years is matric, 12 years is F.A./F.Sc. and 16 years of schooling is degree. ** The coefficient unit, of all animals except for donkeys, hold by sampled agricultural households used in this study were the South Asia’s coefficients of Food and Agriculture Organization (2011). The donkey value is assumed through conversation with the experts of livestock. Buffalo and cattle = 0.05, Goat and sheep = 0.10, Donkey and horses = 0.65 and Chickens = 0.01.
Source: Authors’ selection based on personal observations, existing review of literature and consultation with the professional from agriculture.
Estimation strategy
As the measuring scale of asset indicators in this study were in different scale, that needs normalization. The normalization of Index of each indicator was calculated by utilizing the equation used by United Nations Development Program in Human Development Indices. After normalizing the indices of each variable, the value of each capital was calculated by averaging the value of each variable of capitals followed by averaging the value of capitals for livelihood index (Hassan et al., 2021).
Asset condition of the agricultural households influenced the strategies of livelihood of rural people. The coping capacity of agricultural households with shocks and risks due to different portfolios were consisting of asset types. Therefore, studying livelihood asset and its relationship with the strategy of livelihood of agricultural households assist for understanding the conditions of livelihood along with framing suitable policies for the reduction of poverty (Liu et al., 2018). The strategies of livelihood of the households were classified by different authors into different types; e.g., households classified by Hua et al. (2017) into four types, Liu et al. (2018) classified into three types based of total household income and Xu et al. (2018) classified livelihood strategies into four types based on agricultural income proportion relative to total household income.
The livelihood strategies are classified into three types in this study. Data on average household income from integrated economic survey (2018-19) by year of rural Khyber Pakhtunkhwa (GoP, 2020) were utilized for computing strategies of livelihood. The classification is:
- Rural households type I: Household average income ≤ PKR 4, 04,688 per year.
- Rural households type II: Household average income from PKR 4, 04,689 per year to PKR 7, 25,460 per year.
- Rural households type III: Household average income ≥ PKR 7, 25,461 per year.
According to livelihood strategies classification in this study, it is assumed that agricultural households were having three options of rural households type I, rural households type II and rural households type III. The expression of latent variable function, according to Liu et al., that the ith agricultural households select the strategy livelihood of j(j=1, 2, 3)is given below (2018):
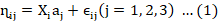
Where, ɳij denotes latent variable that is the benefit of selected strategy of livelihood (assuming that agricultural households select the strategies livelihood which maximize their own benefits within bearable risks); aj is the ith farmer households q×1 characteristic variable, i.e., the factor affecting the ith agricultural households choice of strategy of livelihood (livelihood asset of agricultural households in this article); aj is the number of q×1 coefficient vectors is j. The farmer will select k if their choice of k makes that they might get the maximum benefit. That is,

Where;
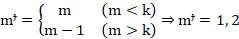
Multinomial logit model was selected and estimated in this study, assuming that ϵij the random error was mutually independent and obeys the logical distribution. For ensuring the model identifiable, a_m=0, m is the base category (the base category was rural households type I) therefore, the probability of the kth livelihood strategy selected by the ith agricultural household is as follows:

Results and Discussion
Livelihood asset in the surveyed region
The index of livelihood capital ranged from 1 to 0, that indicated high to low score. In the present study the empirical findings depicted that on average the overall value of livelihood asset of households was 0.297. Natural Capital (0.429) had the maximum value, tailed by (0.383) SC, (0.271) HC, (0.202) FC and the lowest value (0.201) of PC (Table 2).
Social capital has an imperative provision to sense of people’s well-being by honor, belonging and identity. It has directly influenced other types of capitals via efficient economic relations (FC), enabling views and experience sharing with other participants of the associations and institutes together with knowledge sharing (HC). Human capital of sampled respondents is not sufficient for the efficient utilization of other capitals. Sampled household members would be forced to work on low wages in the absence of human
Table 2: Livelihood asset by different livelihood strategies adopted in the study area.
|
Asset/Capitals |
Rural households type I (n=175) |
Rural households type II (n=67) |
Rural households type III (n=65) |
All (n=307) |
||||
|
Mean |
SD |
Mean |
SD |
Mean |
SD |
Mean |
SD |
|
|
Livelihood asset |
0.255 |
0.122 |
0.336 |
0.116 |
0.370 |
0.105 |
0.297 |
0.127 |
|
Natural |
0.403 |
0.240 |
0.451 |
0.239 |
0.478 |
0.259 |
0.429 |
0.245 |
|
Human |
0.229 |
0.140 |
0.298 |
0.186 |
0.356 |
0.175 |
0.271 |
0.166 |
|
Physical |
0.180 |
0.115 |
0.202 |
0.113 |
0.256 |
0.141 |
0.201 |
0.124 |
|
Financial |
0.161 |
0.227 |
0.232 |
0.255 |
0.282 |
0.234 |
0.202 |
0.239 |
|
Social |
0.303 |
0.334 |
0.500 |
0.348 |
0.477 |
0.347 |
0.383 |
0.351 |
Source: Survey data 2019.
capital that would push them towards conventional production system of agriculture. Adaptation of new technologies, involvement in non-agriculture sector and innovations requires financial capital. The ownership of financial capital is low in the study area. Agricultural households faced difficulties in accessing to formal institutions owing to meet the procedures essential for taking loan. The overall low financial conditions of the households in the area make hard for relatives and friends to help each other by giving loan to one another. In this scenario of non-availability of financial capital, the agricultural households faced poverty and have ample force of labor in agriculture sector. The magnitude of physical capital and their control by the agricultural households is low. Physical capitals are applied during production process. Its absence resulted in low produce that needs the development of capital according to geographical characteristics and socioeconomic conditions of the agricultural households in their cultural circumstances and global situations of the area.
Moreover, the livelihood asset among sampled agricultural households also differs with different livelihood strategies. Rural households type I had less livelihood asset (0.255) followed by rural households type II (0.336) and rural households type III (0.370). Rural households type I had scarcity in all the capitals of asset, restraining the households of this group to be advantaged from new and modern agricultural techniques. The reason behind could be the presence of tenants, having no own land but have shared-in or lease-in land. The tenants had no share in trees that were rooted on field banks by land-owners. The rural households type II had more SC that might let them to be engaged or developed new opportunities in other sectors than agriculture. The rural households type III has more capitals excluding SC that might let them to be engaged in livelihood diversification. The study findings are in line with Liu et al. (2018) with different variables, that uneven strategies of livelihood adopted by various agricultural households that have different amount and types of livelihood capitals. Therefore, structures of livelihood asset significantly influence the strategies of livelihood that were adopted by agricultural households.
Livelihood strategies influenced by livelihood asset of agricultural households
Multinomial logistic model was estimated for households’ strategies that were influenced by livelihood asset of agricultural households in the study area. The model was estimated with rural households type I as reference. Overall multinomial logistic model was significant and good fit to the data (Chi- Square 138.223, P-value 0.000) (Table 3).
Table 3: Multinomial logit model estimates for livelihood strategies influenced by livelihood asset of agricultural household.
|
Household strategy |
Asset |
Coefficient |
S.E. |
P>z |
Odds ratio |
Margins |
|
Rural households type II |
Human |
1.652 |
1.000 |
0.098 |
5.219 |
0.134 |
|
Natural |
0.475 |
0.634 |
0.453 |
1.608 |
0.058 |
|
|
Financial |
1.152 |
0.638 |
0.071 |
3.164 |
0.130 |
|
|
Physical |
0.946 |
1.323 |
0.475 |
2.575 |
0.013 |
|
|
Social |
1.380 |
0.456 |
0.002 |
3.973 |
0.204 |
|
|
Constant |
-2.549 |
0.464 |
0.000 |
0.078 |
||
|
Rural households type III |
Human |
3.655 |
0.995 |
0.000 |
38.657 |
0.487 |
|
Natural |
0.601 |
0.673 |
0.371 |
1.825 |
0.071 |
|
|
Financial |
1.700 |
0.659 |
0.010 |
5.472 |
0.210 |
|
|
Physical |
3.584 |
1.257 |
0.004 |
36.008 |
0.506 |
|
|
Social |
0.900 |
0.477 |
0.059 |
2.460 |
0.078 |
|
|
Constant |
-3.793 |
0.523 |
0.000 |
0.023 |
||
|
Observation: 307 LR chi2(10): 62.240 Prob > Chi2: 0.000 Log-likelihood: -270.137 Pseudo R2: 0.1033 Reference Category: Rural Households Type I |
||||||
Source: Survey data 2019.
Livelihood strategies influenced by human capital
The study results depicted that the HC had significant and positive influence on choice of strategy of livelihood of agricultural households’ in rural households type II’ model and rural households type III’ model, taking rural households type I as the reference. HC index coefficient revealed that a one unit rise have a positive change of 1.652 and 3.655 in the log odds of rural households type II and rural households type III, respectively versus rural households type I. Odd ratios suggested that for a one-unit increase in HC index, the odds of being rural households type II and rural households type III relative to rural households type I model is predicted to increase by 5.219 and 38.657 respectively of the respective parameter estimate given the variables in the model are held constant. Margins findings depicted that the predicted probabilities of households are likely to move from rural households type I is 0.134 times to rural households type II and 0.487 times to rural households type III, holding all other variables in the model at their means (Table 3).
In general, enhancing human capital will help the agricultural households to adopt more satisfying strategy of livelihood. The quality and opportunity of HC has vital importance on the choices of agricultural households. Additional human capital might take agricultural households towards diversification of livelihood and engaging in non-agricultural activities. This can owe towards maximization of livelihood output such as households that avails opportunities of off-farm will enhance income, subject to the facilities of off-farm opportunity, quality education to the household members. Risks bearing and maximization enabling quality labor force having skills and quality education in rural agricultural households to quit agriculture sector and involve in off-farm activities while comparatively low-quality labor will be involved in agricultural activities (Liu et al., 2018).
Livelihood strategies influenced by natural capital
The prerequisite of livelihood diversity for agricultural households is natural capital (Guangdong et al., 2014). Households with large agricultural land have worthy economic condition that might be more sustainable livelihood owing to appropriate arrangement of agricultural activities (Nagesha et al., 2006; Udoh et al., 2017) but households with small agricultural land along with presence of tenants might have less sustainable livelihood.
Theoretically, possessing different NC has influence on the allocation of the livelihood asset of agricultural households. The findings depicted that NC have insignificant effect on agricultural households’ choice of strategies of livelihood in both rural households type II model and rural households type III model, taking rural households type I as the reference. This might be due to poverty status of the area’s small farmers and presence of tenants that cannot invest in land for getting higher productivity and were trapped in vicious cycle. The variables like land specification, water with different features, fuel wood, rental, trees and others should be taken into consideration in future.
Livelihood strategies influenced by physical capital
The result of the study showed that PC had insignificant impact on the choices of strategy of livelihood in rural households type II model with rural households type I as the reference, significant and positive impact on the choices of livelihood strategy in the rural households type III model with Rural Households Type I as the reference. The PC index coefficient showed that a unit rise conveys a positive change of 3.584 in the log odds of rural households type III model versus rural households type I. Odd ratios showed that for a one-unit increase in PC, the odds of being Rural Households Type III relative to Rural Households Type I is expected to increase by 36.0081 of the respective parameter estimate given the variables in the model are held constant. Data on margins revealed that the projected possibilities of households are likely to move from rural households type I is 0.506 times to rural households type III, holding all other variables in the model at their means (Table 3). Liu et al. (2018) stated that additional different material assets had negative and significant effect on the choices of agricultural household. Therefore, addition of more variables added with quality and services of PC need to be taken into consideration in future.
Livelihood strategies influenced by financial capital
FC had significant and positive impact on choice of livelihood strategy of agricultural households in both rural households type II model and rural households type III model, taking rural households type I as the reference. The coefficient of FC index shows that a unit increase takes a positive change of 1.152 and 1.70 in the log odds of rural households type II and rural households type III, respectively versus rural households type I. Odd ratios showed that for a one-unit increase in FC, the odds of being rural households type II and rural households type III comparative to rural households type I is likely to increase by 3.164 and 5.472 times respectively of the respective parameter estimate given the variables in the model are held constant. Margins showed that the projected possibilities of households are likely to move from rural households type I is 0.130 and 0.210 times to rural households type II and rural households type III respectively, holding all other variables in the model at their means (Table 3). The findings of Liu et al. (2018) was also positive and significant effect on livelihood strategy choices of agricultural households’ in part-time household model and the non-farming household model. It might be said that improving FC assist households for adopting more satisfying livelihood strategy.
Livelihood strategies influenced by social capital
The results in Table 3 reveals that social capital had significant and positive affect on agricultural household choices of livelihood strategy in both rural households type II model and rural households type III model, taking reference rural households type I in the model. SC index coefficient depicted that a unit rise takes a positive change of 1.380 and 0.90 in the log odds of rural households type II and rural households type III respectively versus rural households type I. Odd ratios showed that for a one-unit increase in SC, the odds of being rural households type II and rural households type III relative to rural households type I is likely to increase by 3.97 and 2.60 times of the respective parameter estimate given the variables in the model are held constant. Margins depicted that holding all other variables in the model at their means, the expected possibilities of households are likely to move from rural households type I is 0.204 and 0.078 times to rural households type II and rural households type III.
Conclusions and Recommendations
The study in hand has the objective to analyze the rural livelihood strategies influenced by livelihood asset of agricultural households in the province of Khyber Pakhtunkhwa, Pakistan. The results revealed that the rural small agricultural households were short in livelihood asset, in general and differs’ among different agricultural households having different livelihood strategies. The agricultural households had primarily low livelihood along with low exploitation of those scarce assets. Natural Capital have the maximum value followed by social capital, human capital, financial capital and the lowest of physical capital. Rural households type I have less livelihood asset followed by rural households type II and rural households type III . HC, FC and SC have significant positive influence on the choice of livelihood strategy in rural households type II model and rural households type III model. PC has significant and positive impact on the choices of livelihood strategy in the rural households type III model. Thus, it is recommended that:
- Efforts are needed by provincial Agricultural Departments and other allied stakeholders to revise the cropping pattern followed in the area by introducing high value crops and their marketing to enhance households’ food security and earnings.
- Keeping in view the labor markets requirements the manpower especially the youth should be given quality of education and technical training.
- Social protection and financial support, that are applicable, should be provided to the agricultural households according to their socio-psycho-economic situations.
Novelty Statement
This research is adding new knowledge of livelihood asset of farm households influencing livelihood strategies. This will facilitate in knowing the condition of livelihood of rural people and assist the policy makers framing reasonable policies in poverty reduction and rural development during initiating future programs.
Author’s Contribution
Abdul Hassan: Conducted research, review, data collection and analysis, and wrote the manuscript. Shahnaz Akhtar: Technical guidelines during whole research study.
Muhammad Ishaq: Helped in data analysis and reviewed the manuscript.
Conflict of interest
The authors have declared no conflict of interest.
References
Arias, C.C., 2017. The assets of the poor: rural indigenous livelihoods and their exemplar strategy to overcome scarcity - Pos, nomás con lo poco que tenemos, todo lo que hemos logrado¨. Dissertation no. 4652. Doctor of Philosophy in Organizational Studies and Cultural Theory. School of Management, Economics, Law, Social Sciences and International Affairs, University of St. Gallen, Difo-Druck GmbH, Bamberg.
Bazezew, A., W. Bewket and M. Nicolau. 2013. Rural households’ livelihood assets, strategies and outcomes in drought-prone areas of the Amhara Region, Ethiopia: Case Study in Lay Gaint District. Afr. J. Agric. Res., 8(46): 5716-5727.
Belay, M., and W. Bewket. 2013. Farmers livelihood assets and adoption of sustainable land management practices in north-western highlands of Ethiopia. Int. J. Environ. Stud., 70(2): 284-301. https://doi.org/10.1080/00207233.2013.774773
Chambers, R., and G.R. Conway. 1992. Sustainable rural livelihoods: Practical concepts for the 21st century. Discussion paper 296. Institute of Development Studies. Brighton, England.
DFID. 1999. Sustainable Livelihoods Guidance Sheets. Department for International Development, Natural Resources Policy and Advisory Department, Overseas Development Institute, London, UK.
Ellis-Jones, J. and T. Mason. 1999. Livelihood strategies and assets of small farmers in the evaluation of soil and water management practices in the temperate Inter-Andean valleys of Bolivia. Mountain research and development. Poverty, Rural Livelihoods, Land Husband. Hillside Environ., Part 1: 19(3): 221-234.
Food and Agriculture Organization. 2011. Guidelines for the preparation of livestock sector reviews. Animal Production and Health Guidelines. No. 5. Rome.
Government of Khyber Pakhtunkhwa, 2016. Khyber Pakhtunkhwa climate change policy. Final draft. Environmental Protection Agency. Forestry, Environment and Wildlife Department. Government of Khyber Pakhtunkhwa.
Government of Pakistan, 2020. Household Integrated Economic Survey (HIES) (2018-19). Ministry of Planning Development and Special Initiatives. Pakistan Bureau of Statistics. Islamabad, Pakistan. www.pbs.gov.pk
Guangdong, L., F. Chuanglin, Q. Daochi and W. Liping. 2014. Impact of farmer households’ livelihood assets on their options of economic compensation patterns for cultivated land protection. J. Geogr. Sci., 24(2): 331-348. https://doi.org/10.1007/s11442-014-1091-5
Hassan, A., S. Akhtar and M. Ishaq. 2021. Livelihood assets and outcomes of rural farm households in central Khyber Pakhtunkhwa of Pakistan. J. Appl. Econ. Bus. Stud., 5(3): 19-42. https://doi.org/10.34260/jaebs.532
Hua, X., J. Yan and Y. Zhang. 2017. Evaluating the role of livelihood assets in suitable livelihood strategies: Protocol for anti-poverty policy in the Eastern Tibetan Plateau, China. Ecol. Indicat., 78: 62-74. https://doi.org/10.1016/j.ecolind.2017.03.009
Israr, M. and H. Khan. 2010. An analysis of livelihood sources in hilly areas northern Pakistan. Sarhad J. Agric., 26(4): 665-672.
Kanwal, N., M.A. Khan and Z. Zheng. 2016. Analyzing the determinants of non-farm income diversification of farm households in Peshawar district of Pakistan. Timisoara J. Econ. Bus., 9(1): 33-48. https://doi.org/10.1515/tjeb-2016-0003
Lingam, L., 2015. Household livelihood strategies. Chapter in book: The Wiley Blackwell Encyclopedia of Gender and Sexuality Studies. pp. 1322-1326. https://doi.org/10.1002/9781118663219.wbegss141
Liu, Z., Q. Chen and H. Xie. 2018. Influence of the farmer’s livelihood assets on livelihood strategies in the western mountainous area, China. Sustainability, 10: 875. https://doi.org/10.3390/su10030875
Ma, J., J. Zhang, L. Li, Z. Zeng, J. Sun, Q. Zhou and Y. Zhang. 2018. Study on livelihood assets-based spatial differentiation of the income of natural tourism communities. Sustainability, 10: 353. https://doi.org/10.3390/su10020353
Malik, S.J., 2008. Rethinking development strategy, the importance of the rural non-farm economy in growth and poverty reduction in Pakistan. Lahore J. Econ. Spec. Ed., pp. 189-204. https://doi.org/10.35536/lje.2008.v13.isp.a11
Maqbool, A. and M.K. Bashir. 2009. Rural development in Pakistan: Issues and future strategies. Conference paper: Agriculture: Challenges, Opportunities and Option under Free Trade Regime.
Meinzen-Dick, R., N. Johnson, A. Quisumbing, J. Njuki, J. Behrman, D. Rubin, A. Peterman and E. Waitanji. 2011. Gender, assets, and agricultural development programs: A conceptual framework. CAPRi working paper No. 99. International Food Policy Research Institute: Washington, DC.
Moser, C. and A. Felton. 2007. The construction of an asset index measuring asset accumulation in Ecuador. Working paper 87. Chronic poverty research center. Global Economy and Development. The Brookings Institution 1775 Massachusetts Avenue, NW Washington DC, 20036, USA.
Nagesha, G., and N.B. Gangadharappa. 2006. Adoption of agroforestry systems in north eastern districts of Karna-taka. My Forest, 42(4): 337-347. In: (eds. Udoh, E.J., S.B. Akpan and E.F. Uko. 2017. Assessment of Sustainable Livelihood Assets of Farming Households in Akwa Ibom State, Nigeria. J. Sustain. Dev., 10(4): 83-96. https://doi.org/10.5539/jsd.v10n4p83
Peter, C.A., 1999. Sustainable livelihoods analysis: An introduction. Maxwell school of citizenship and public affairs Syracuse, New York. In: (eds. Su, F., and Shang, H.Y.). Relationship analysis between livelihood assets and livelihood strategies: A Heihe river basin example. Sci. Cold Arid Regions, 4(3): 0265–0274.
Ping, Q., M.A. Iqbal, M. Abid, U.I. Ahmed, A. Nazir and A. Rehman. 2016. Adoption of off-farm diversification income sources in managing agricultural risks among cotton farmers in Punjab Pakistan. J. Appl. Environ. Biol. Sci., 6(8): 47-53.
Saunders, M., P. Lewis and A. Thornhill. 2016. Research methods for business students. Seventh edition. Pearson Education Limited.
Scoones, I., 1998. Sustainable livelihoods: A framework for analysis. IDS working paper 72. Institute of development studies.
Shahbaz P., I. Boz and S.U. Haq. 2017. Determinants of crop diversification in mixed cropping zone of Punjab Pakistan. Direct Res. J. Agric. Food Sci., 5(11): 360-366.
Siegel, P.B., 2005. Using an asset-based approach to identify drivers of sustainable rural growth and poverty reduction in Central America: A conceptual framework. World Bank Policy Research Working Paper 3475. https://doi.org/10.1596/1813-9450-3475
Spielman, D.J., S.J. Malik, P. Dorosh and N. Ahmad. 2016. Food, agriculture and rural development in Pakistan. Chapter.1: 1-39. In: (eds. Spielman, D.J., Malik, S.J., Dorosh, P. and Ahmad, N.) agriculture and the rural economy in Pakistan. Issues, outlooks and policy priorities. An IFPRI book. University of Pennsylvania press, Philadelphia. https://doi.org/10.9783/9780812294217-004
Su, F., and H.Y. Shang. 2012. Relationship analysis between livelihood assets and livelihood strategies: A Heihe river basin example. Sci. Cold Arid Reg., 4(3): 0265–0274. https://doi.org/10.3724/SP.J.1226.2012.00265
The Department for International Development, 1999. Sustainable livelihoods guidance sheet. Department for International Development, Natural Resources Policy and Advisory Department, Overseas Development Institute. DFID 94 Victoria Street London SW1E 5JL UK.
Udoh, E.J., S.B. Akpan and E.F. Uko. 2017. Assessment of sustainable livelihood assets of farming households in Akwa Ibom State, Nigeria. J. Sustain. Dev., 10(4): 83-96. https://doi.org/10.5539/jsd.v10n4p83
UIS, 2013. UIS methodology for estimation of mean years of schooling. UNESCO institute for statistics. United Nations Educational, Scientific and Cultural Organization
Urrehman, M., Jehanzeb and M.F. Rana. 2008. Livelihood strategies of different categories of households in rural areas of Abbottabad, Pakistan. Sarhad J. Agric., 24(4): 685-692.
Xu, D., J. Zhang, G. Rasul, S. Liu, F. Xie, M. Cao and E. Liu. 2015. Household livelihood strategies and dependence on agriculture in the mountainous settlements in the three gorges reservoir area, China. Sustainability, 7: 4850-4869. https://doi.org/10.3390/su7054850
Xu, D., X. Deng, S. Guo and S. Liu. 2018. Sensitivity of livelihood strategy to livelihood capital: An empirical investigation using nationally representative survey data from rural China. Soc. Indic. Res., https://doi.org/10.1007/s11205-018-2037-6
Zhifei L., C. Qianru and X. Hualin. 2018. Comprehensive evaluation of farm household livelihood assets in a western mountainous area of China: A case study in Zunyi city. J. Resour. Ecol., 9(2): 154-163. https://doi.org/10.5814/j.issn.1674-764x.2018.02.005
To share on other social networks, click on any share button. What are these?


