
Analysis of Diversity and Distribution of Antibiotic Resistance Genes in Holstein Friesian Dairy Cattle Feces by Shotgun Metagenomic Approach


Analysis of Diversity and Distribution of Antibiotic Resistance Genes in Holstein Friesian Dairy Cattle Feces by Shotgun Metagenomic Approach
Azhar Ali1, Faheem Ahmed Khan2, Wu Di3, Huang Chunjie3, Muhammad Rizwan Yousaf1, Bilal Ahmed1, Farwa Shakeel1, Nuruliarizki Shinta Pandupuspitasari1, Windu Negara2, Bambang Waluyo Hadi Eko Prasetiyono1*
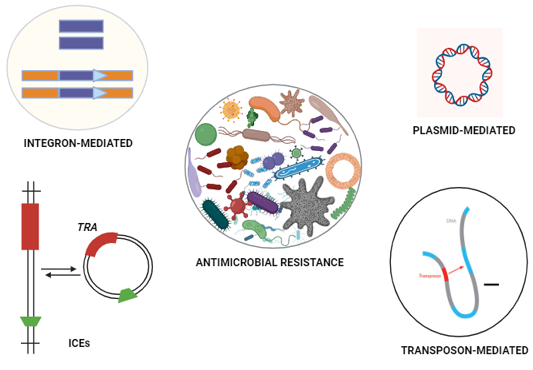
Heritable antimicrobial resistance.
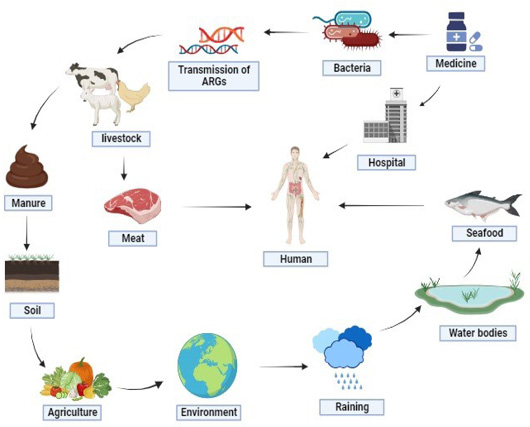
Illustrates the propagation of antibiotic resistance genes (ARGs). ARGs can be disseminated through diverse mediums, such as soil, water bodies, animals, and medications. This presents a substantial hazard to the health of both animals and humans.
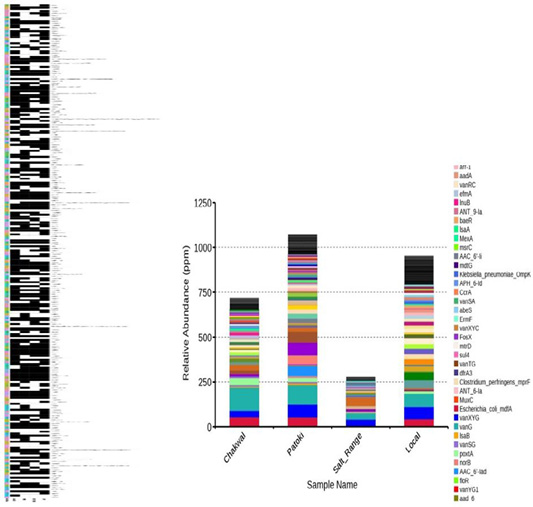
(A) Prevalence of ARGs. The presence of a specific ARG is represented by black box corresponding to each of the samples, while the white boxes for each sample indicate the absence of corresponding ARGs. (B) The Relative abundance of ARG. The distribution of ARGs within the samples.
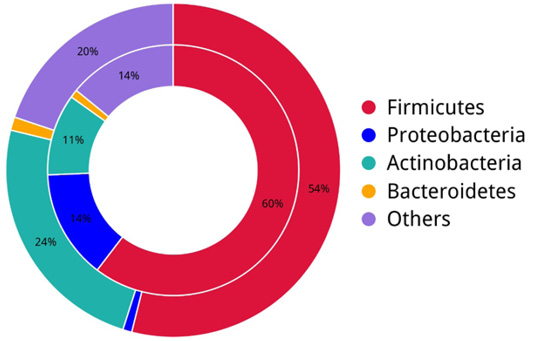
The figure presents a collective representation and diversity of bacterial phylum across all samples by Donut chart.
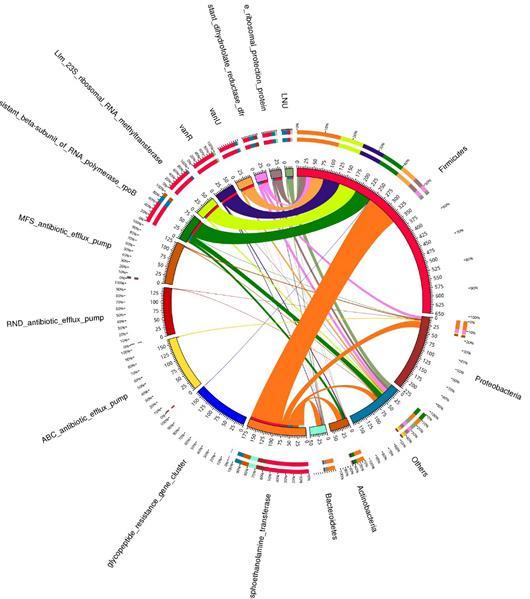
A circular diagram shows antibiotic resistance genes and metabolic processes at the bacterial phylum level in different sample of fecal gut microbiota of dairy cows. The left side focuses on metabolic activities while the right side of the representation highlights bacterial phyla. The widths of the inner and outer circles signify relative abundances, where inner circle colors indicate cumulative abundances by bacterial phylum at right and metabolic process at left side. Outer circle colors represent the relative abundances of processes of bacterial phylum at right side and metabolic process phyla at left side.


