Analysis of Correlation between Nutrient Content, Digestibility, and Gas Production of Forages in Indonesia
Slamet Widodo1*, Mohammad Ikhsan Shiddieqy1, Teguh Wahyono2, Yeni Widiawati1, Zultinur Muttaqin1
1Research Center for Animal Husbandry, National Research and Innovation Agency, Bogor 16915, Indonesia; 2Research Center for Food Technology and Processing, National Research and Innovation Agency, Gunung Kidul 55861, Indonesia.
*Correspondence | Slamet Widodo, Research Center for Animal Husbandry, National Research and Innovation Agency, Bogor 16915, Indonesia; Email:
[email protected]
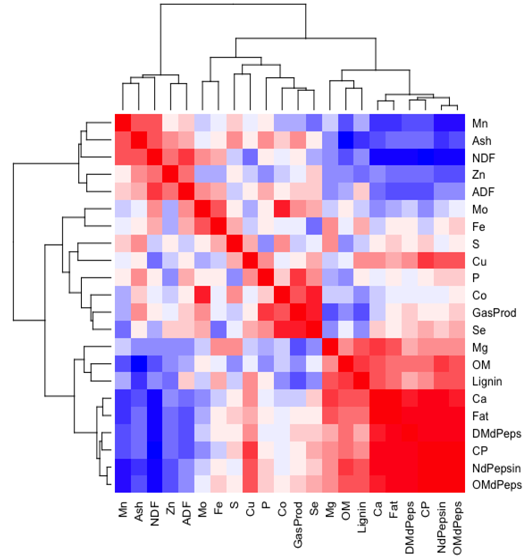
Figure 1:
Heatmap matrix of Pearson’s correlation analysis shows the correlation coefficients among parameters.
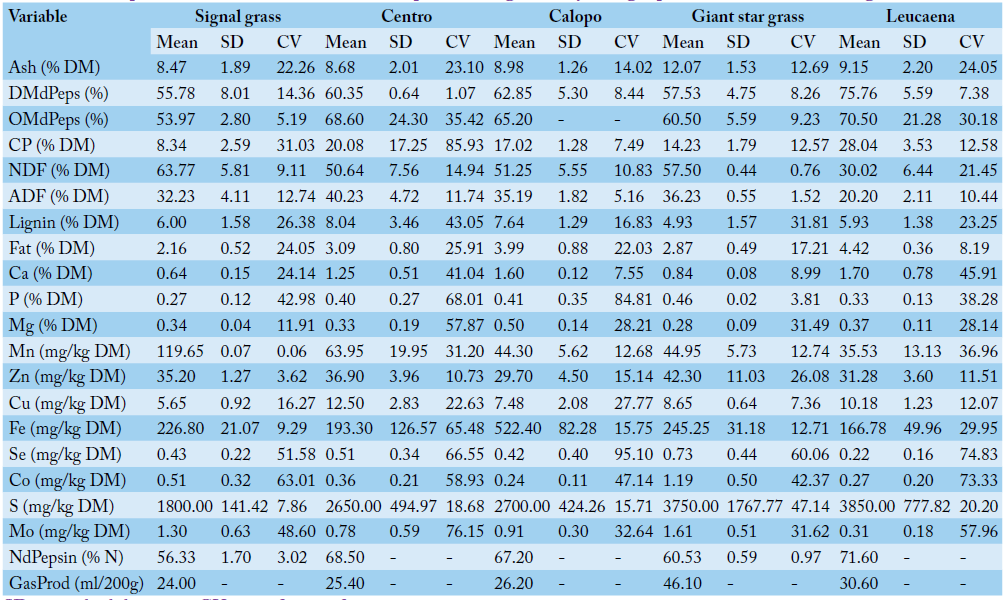
Table 2:
Descriptive statistics for the nutrient composition, digestibility, and gas production of several forages in Indonesia (cont.).
SD= standard deviation; CV= coefficient of variation.
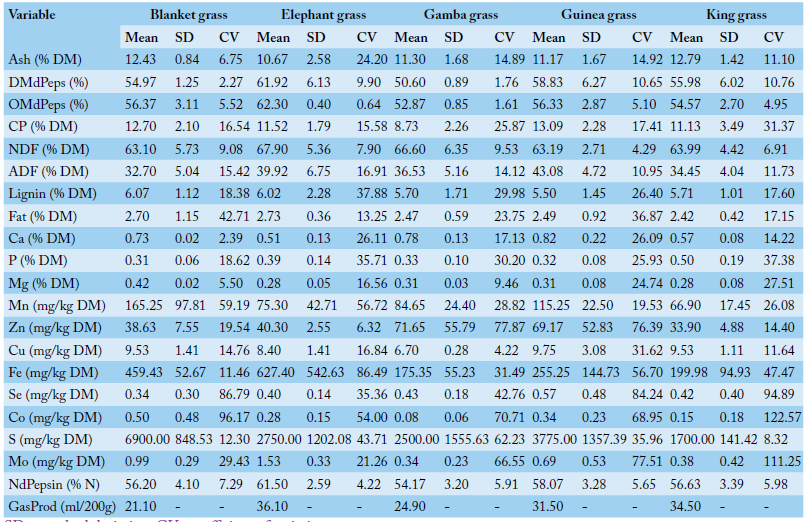
Table 3:
Descriptive statistics for the nutrient composition, digestibility, and gas production of several forages in Indonesia.
SD = standard deviation; CV = coefficient of variation.
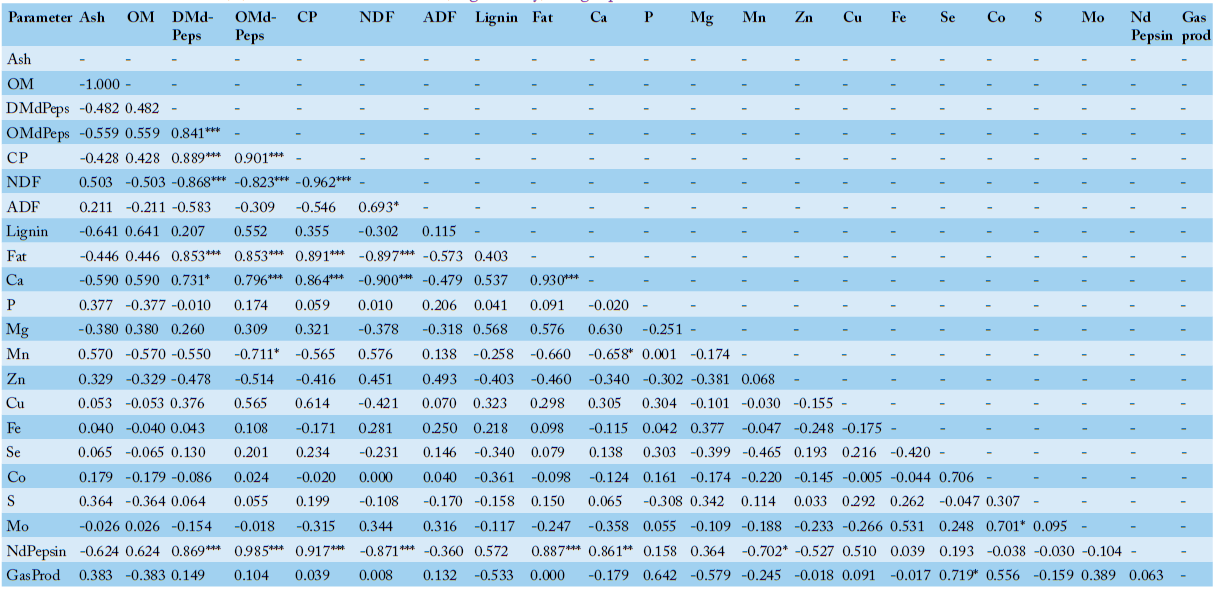
Table 4:
Pearson’s correlation (R) between nutrients content, digestibility, and gas production.
Significant correlations are expressed using a single asterisk (*) for P < 0.05, double asterisk (**) for P < 0.01, and triple asterisk (***) for P < 0.001, respectively.


