
An Assay to Detect the Impact of Biosecurity Levels of Farms on Broilers Gut Health


An Assay to Detect the Impact of Biosecurity Levels of Farms on Broilers Gut Health
Skenndri Safae1*, Charrat Nadia2, Jmiai Mehdi3, Nassik Saadia1

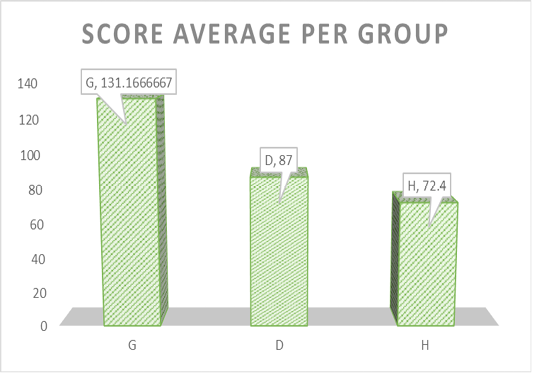
A chart displaying the difference in the average score between the three groups.
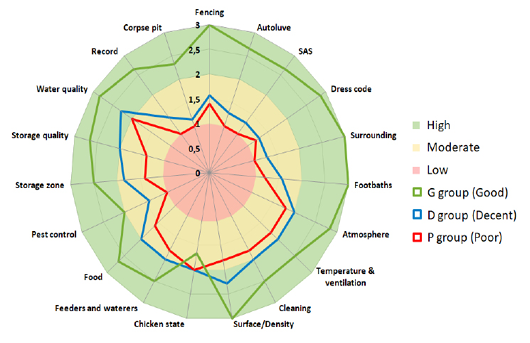
Radar charts exhibiting the average scores of the farms in the 3 groups regarding 19 parameters of biosecurity.
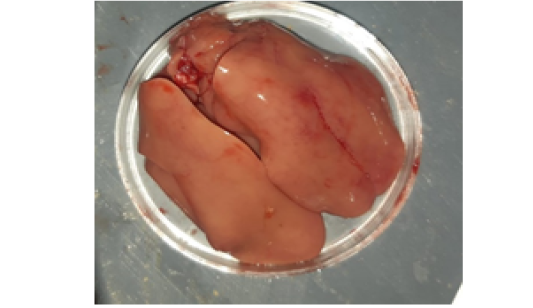
Friability of the liver (score 3).
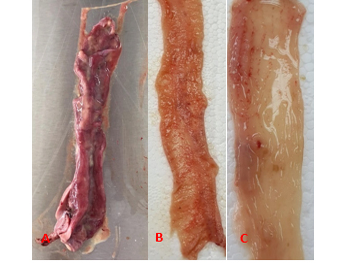
(A) Portion of the duodenum with severe congestion (score 3). (B) Congestion of the jejunum (score2) with thinning of the walls (score 1). (C) Petechia on the caeca (score 1).

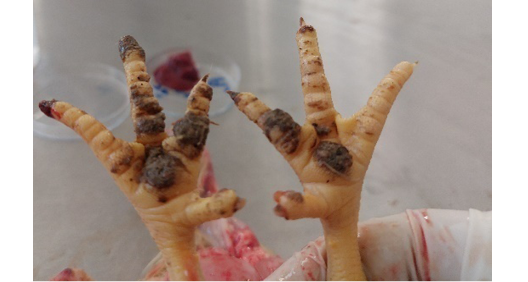
Bilateral pododermatitis on a 35 day old broiler chicken.

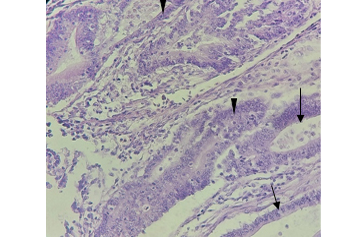
Histopathology slide of the mucosa of the ileum portion of a broiler chicken at 35 days presenting deformed villi and enlarged crypts containing inflammatory cells (arrow), and Eimeria in the mucosa (arrowhead). Hematoxylin and eosin coloration, x40.

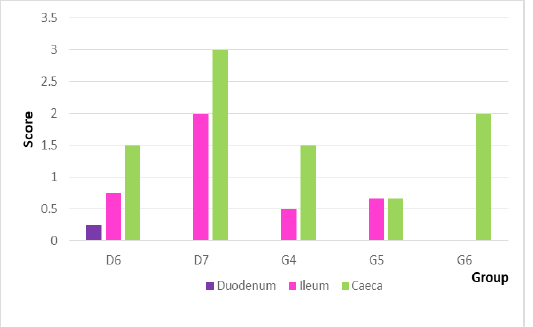
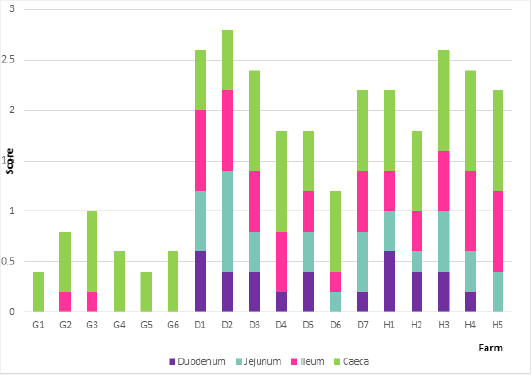
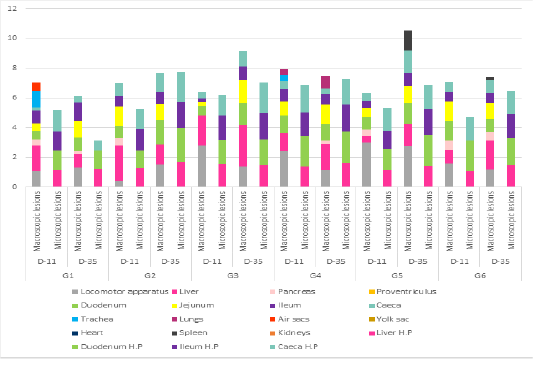
Stacked bar graphs displaying macroscopic and microscopic lesions found on day 11 and day 35 of broiler chickens of farms of the G group.
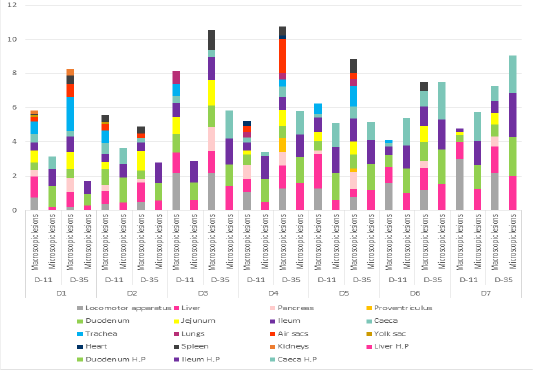
Stacked bar graphs displaying macroscopic and microscopic lesions found on day 11 and day 35 of broiler chickens of farms of the D group

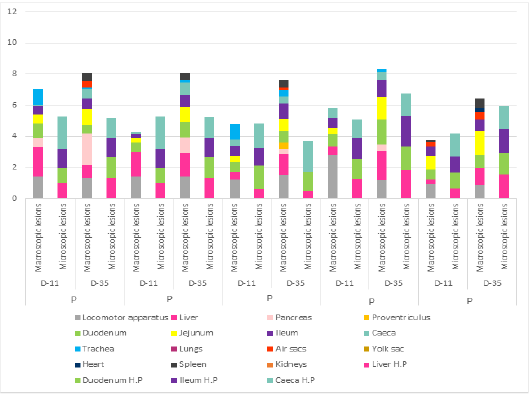
Stacked bar graphs displaying macroscopic and microscopic lesions found on day 11 and day 35 of broiler chickens of farms of the P group.
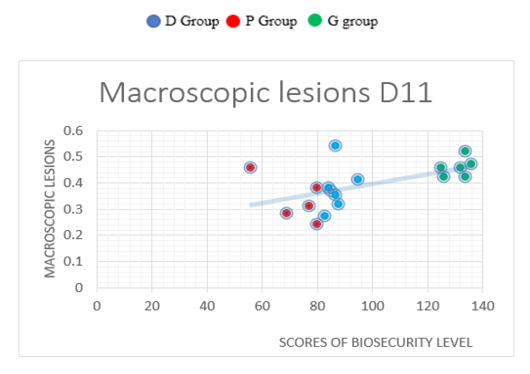
Point cloud representing the distribution of macroscopic lesions throughout the farms groups on day 11.
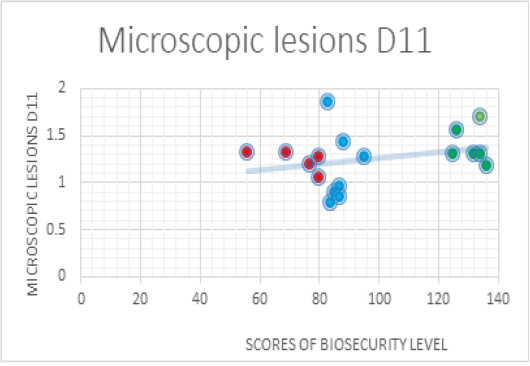
Point cloud representing the distribution of microscopic lesions throughout the farms groups on day 11.

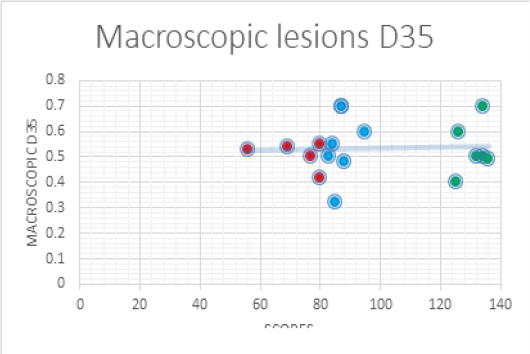
Point cloud representing the distribution of macroscopic lesions throughout the farms groups on day 35.
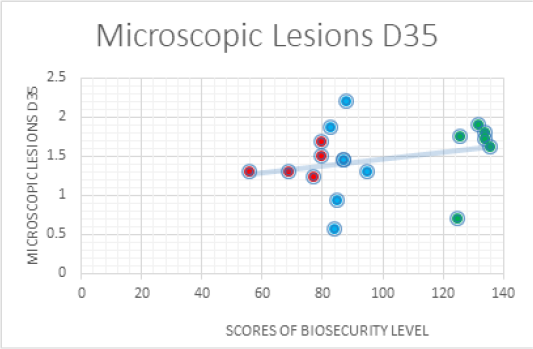
Point cloud representing the distribution of microscopic lesions throughout the farms groups on day 35
Eimeria oocysts detected microscopically at day 11.
Average of Eimeria oocysts detection rate in every farm at day 35 from intestinal scrapings.

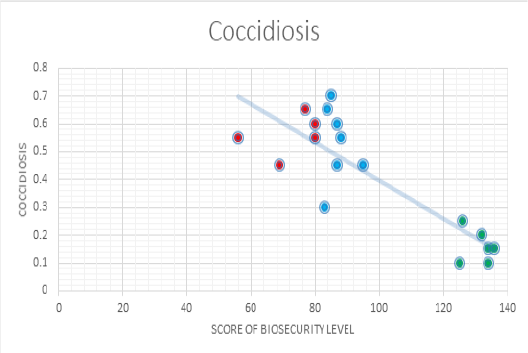
Point cloud distribution of Coccidiosis throughout the farm groups at day 35.

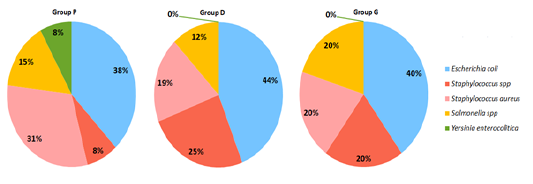
Percentage of the bacteria present on livers of broiler chickens from the 3 groups.

