
Administration of Bee Pollen, Nigella sativa Oil, and their Combination as a Strategy for Improving Growth Performance, Immunity, and Health Status of Newborn Friesian Calves During the Suckling Period

Administration of Bee Pollen, Nigella sativa Oil, and their Combination as a Strategy for Improving Growth Performance, Immunity, and Health Status of Newborn Friesian Calves During the Suckling Period
H.A. El-Nagar1, A.M. El-Hais2, M.S. Mandouh2, W.M. Wafa1*, A.H. ABD El-Aziz, K.A. Attia4


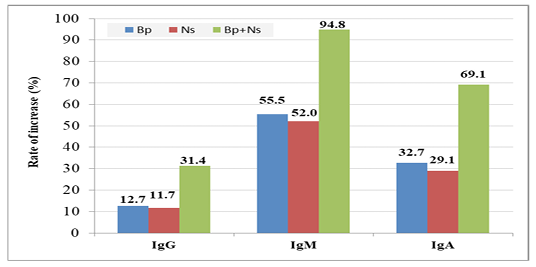
Rate of increase in serum immunoglobulin concentrations at weaning in treatment groups relative to control one. (G2: 10g BP/kg starter. G3: 10g BS oil/kg starter. G4: 5g BP + 5g BS oil/kg starter).
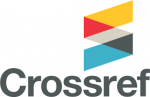
Rate of increase in hematological parameters at weaning of calves in treatment groups relative to control one. (G2: 10g BP/kg starter. G3: 10g BS oil/kg starter.G4: 5g BP + 5g BS oil/kg starter). RBCs: Red blood cells. WBCs: White blood cells. Hb: Hemoglobin. PCV: Packed cell volume.

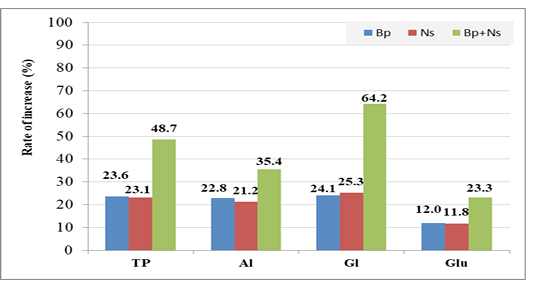
Rate of increase in serum total protein (TP) and carbohydrate metabolites [albumin (Al), globulin (Gl), glucose (Glu)] at weaning of calves in treatment groups relative to control one. (G2: 10g BP/kg starter. G3: 10g BS oil/kg starter. G4: 5g BP + 5g BS oil/kg starter).
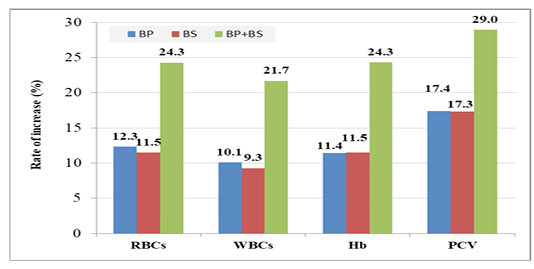
Rate of increase in total lipids (TL) and total cholesterol (Chol) in blood serum at weaning of calves in treatment groups relative to control one.

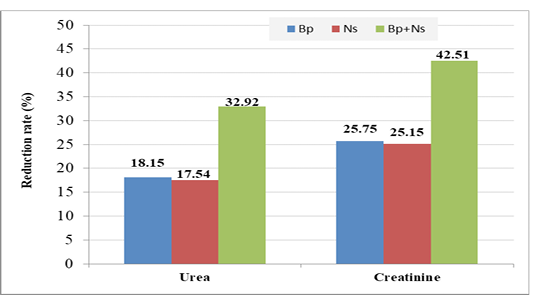
Reduction rate of urea, and creatinine in blood serum at weaning of calves in treatment groups relative to control one.

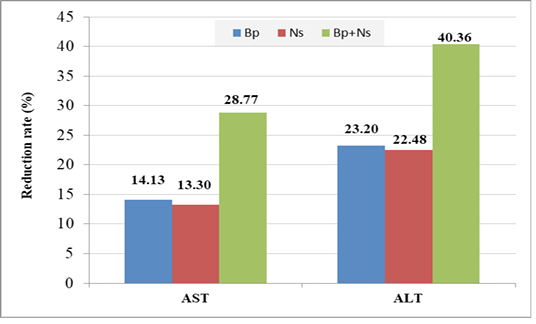
Reduction rate in activity of AST and ALT in blood serum at weaning of calves in treatment groups relative to control one.

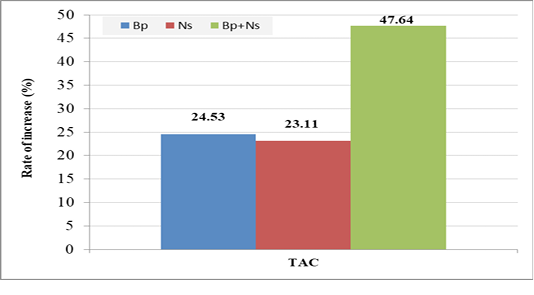
Rate of increase in serum total antioxidant capacity (TAC) at weaning of calves in treatment groups relative to control one.
