Acute Oral Toxicity and Neurobehavioral Effects of Salvia officinalis Essential Oil in Female Wistar Rats
Acute Oral Toxicity and Neurobehavioral Effects of Salvia officinalis Essential Oil in Female Wistar Rats
Safaa Rhaimi1, Sara Brikat2, Mouloud Lamtai2*, Mohammed Ouhssine1
Salvia officinalis plant.
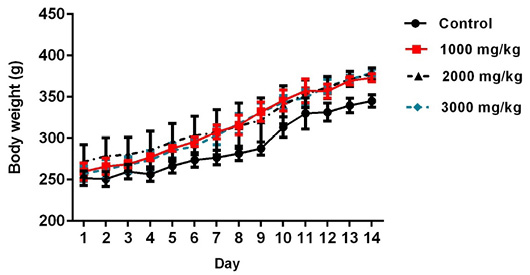
Changes on the body weights during 14 days of observation in male rats after single oral treatment of S. officinalis essential oil.
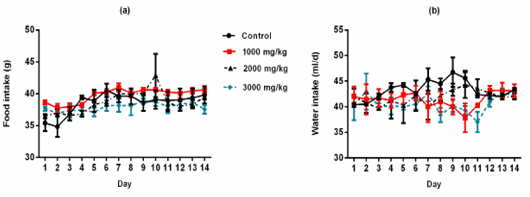
Food consumption expressed in g/d (a) and Water intake expressed in ml/d (b) of female rats orally administered with S. officinalis essential oil.
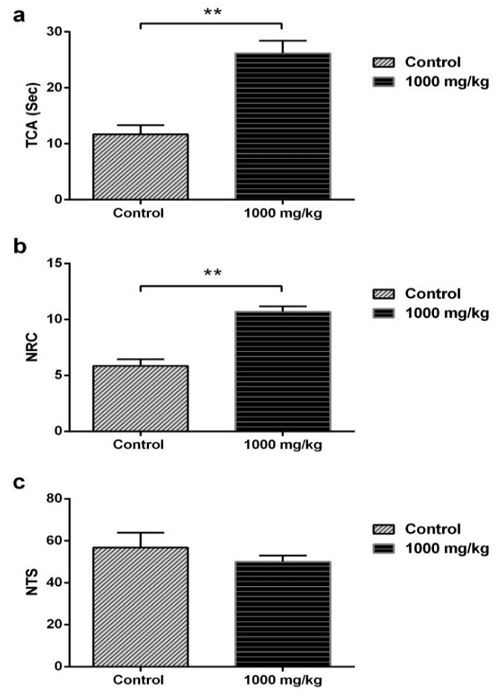
(a) Total amount time spent in the center (TCA). (b) Number of returns into the center area of the arena in the open-field behavior apparatus (NRC). (c) Number of total squares (NTS) in the open field test in female rats after the administration of 1000 mg/kg of S. officinalis essential oil. Data are represented as mean ± S.E.M. *p < 0.05 vs. control group.
(a) Total amount of time spent in open arms (TOA). (b) Number of entries in open arms (EOA) in the EPM test in female rats after the administration of 1000 mg/kg of S. officinalis essential oil. Data are represented as mean ± S.E.M. *p < 0.05 vs. control group.
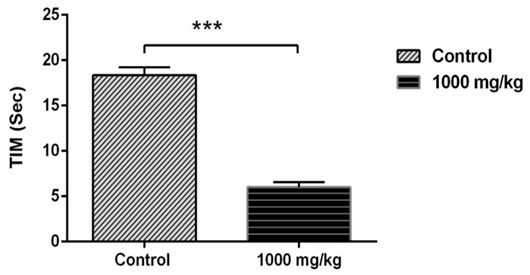
Immobility time expressed in seconds (Sec) (TIM), in the forced swimming test in female rats after the administration of 1000 mg/kg of S. officinalis essential oil. Data are represented as mean ± S.E.M. *p < 0.05 vs. control group.
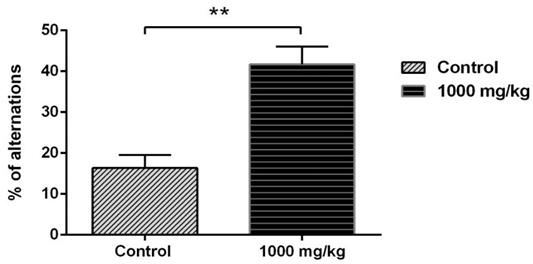
Effect of oral administration of S. officinalis essential oil (1000 mg/kg) on spontaneous alternation percentage measured in Y-maze. Data are represented as mean ± S.E.M. *p < 0.05 vs. control group.
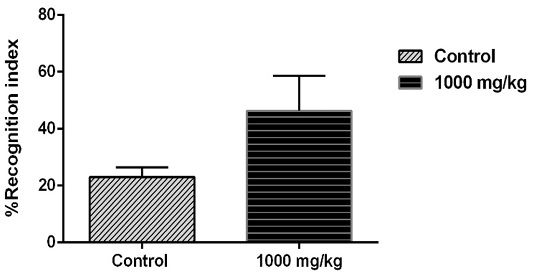
Effects of S. officinalis essential oil (1000 mg/kg) on recognition memory measured in the object recognition test. Data are represented as mean ± S.E.M. *p < 0.05 vs. control group.


