A New Herbal Combination and Trigonella foenum graceum Improve Insulin Resistance, Insulin Signaling Genes, Adipokines Level and Body Weight in Type 2 Diabetic Rat Model
A New Herbal Combination and Trigonella foenum graceum Improve Insulin Resistance, Insulin Signaling Genes, Adipokines Level and Body Weight in Type 2 Diabetic Rat Model
Sana Eijaz, Asmat Salim* and Mohammad Anwar Waqar
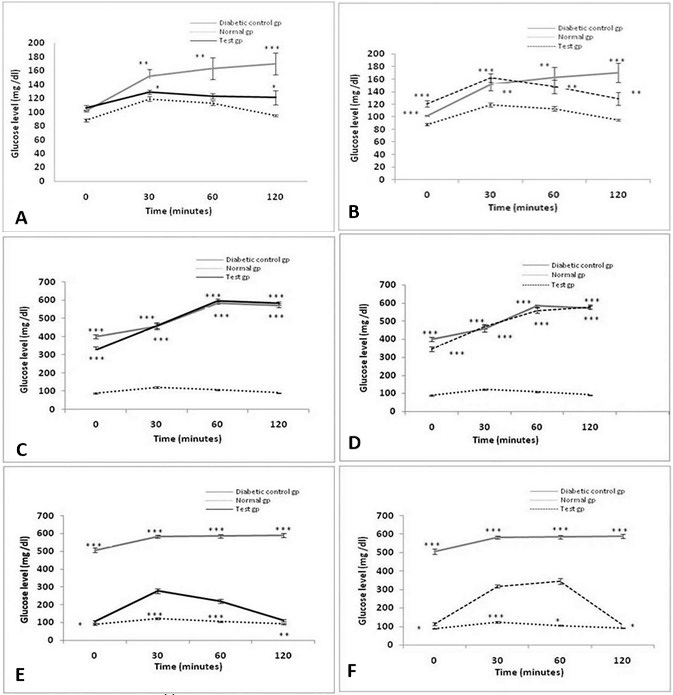
Effect of HFD (A and B); STZ (C and D); herbal combination and Trigonella foenum graceum extracts (E and F) on blood glucose levels of diabetic control, test and normal groups. HFD was given for six months, while STZ, the herbal combination and Trigonella foenum graceum extract for one month. Analysis was done by Student’s t-test using Sigma plot software. Data are presented as means ± SEM and level of significance is p < 0.05 (where * = p < 0.05; ** = p < 0.01 and *** = p < 0.001; n = 6).
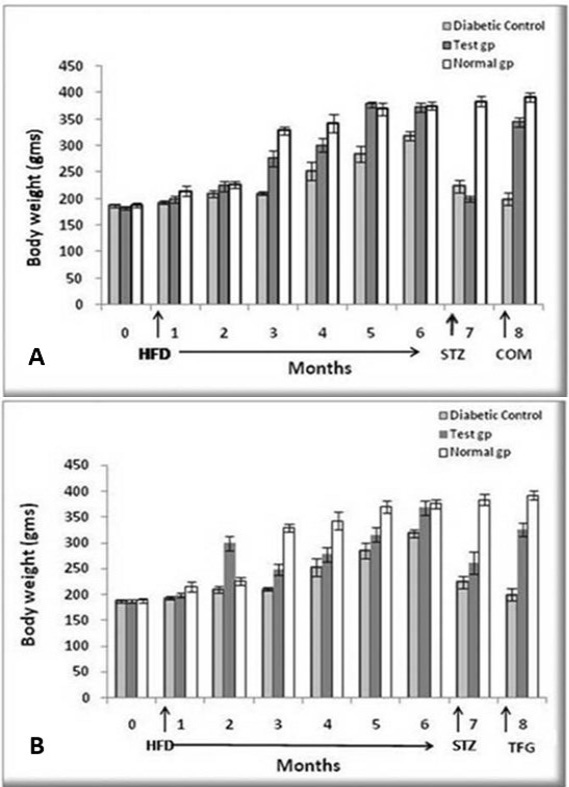
Effect of herbal combination (A) and Trigonella foenum graceum extract (B) on body weight of diabetic control, test and normal groups. The weights were recorded after every one month during the administration of HFD, STZ and herbal combination extract. HFD was given for six months, while STZ and the herbal combination extract for one month. Analysis was done by Student’s t-test using Sigma plot software. Data are presented as means ± SD and level of significance is p < 0.05 (where * = p < 0.05; ** = p < 0.01 and *** = p < 0.001; n = 6).
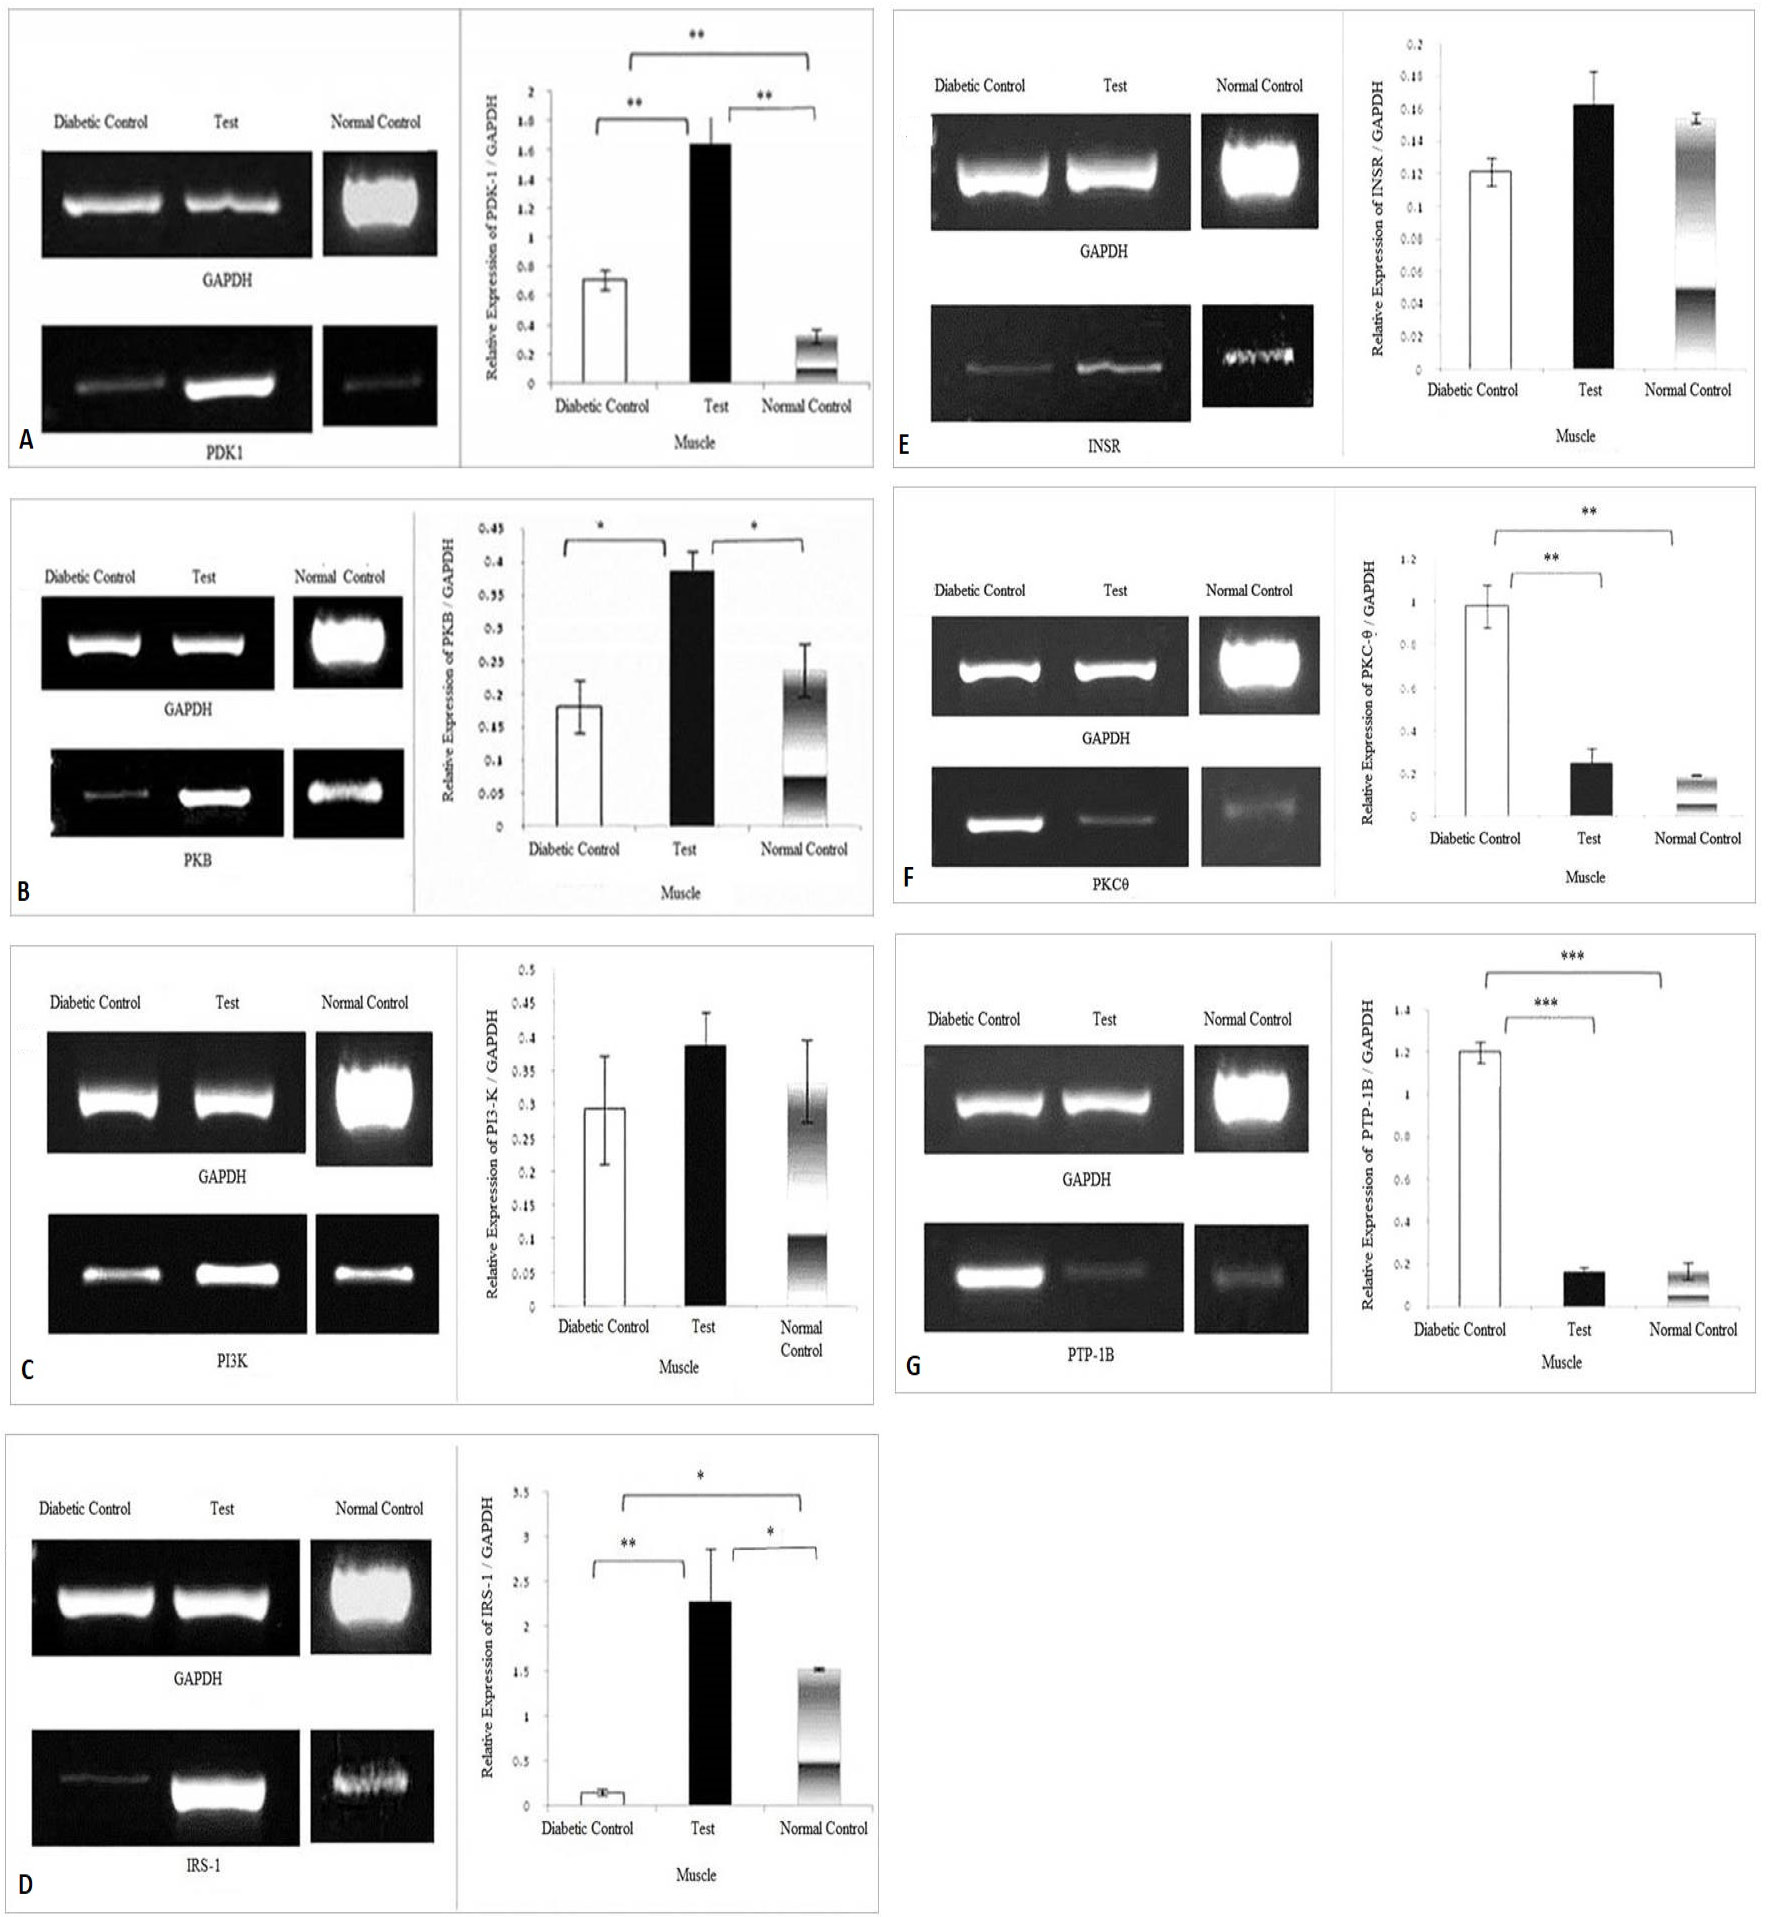
Effect of herbal combination extract on the expression levels of (A) PDK-1, (B) PKB, (C) PI3-K, (D) IRS-1, (E) INSR, (F) PKC-θ, (G) PTP-1B, genes in the skeletal muscle. The density of each band was measured as Integrated Density Values (IDVs). The graphs are showing expression of genes relative to the expression of GAPDH. Analysis was done by one way ANOVA followed by Bonferroni’s post hoc test for comparison between groups using Sigma plot software. Data are presented as means ± SD and level of significance is p < 0.05 (where * = p < 0.05; ** = p < 0.01 and *** = p < 0.001; n = 6).
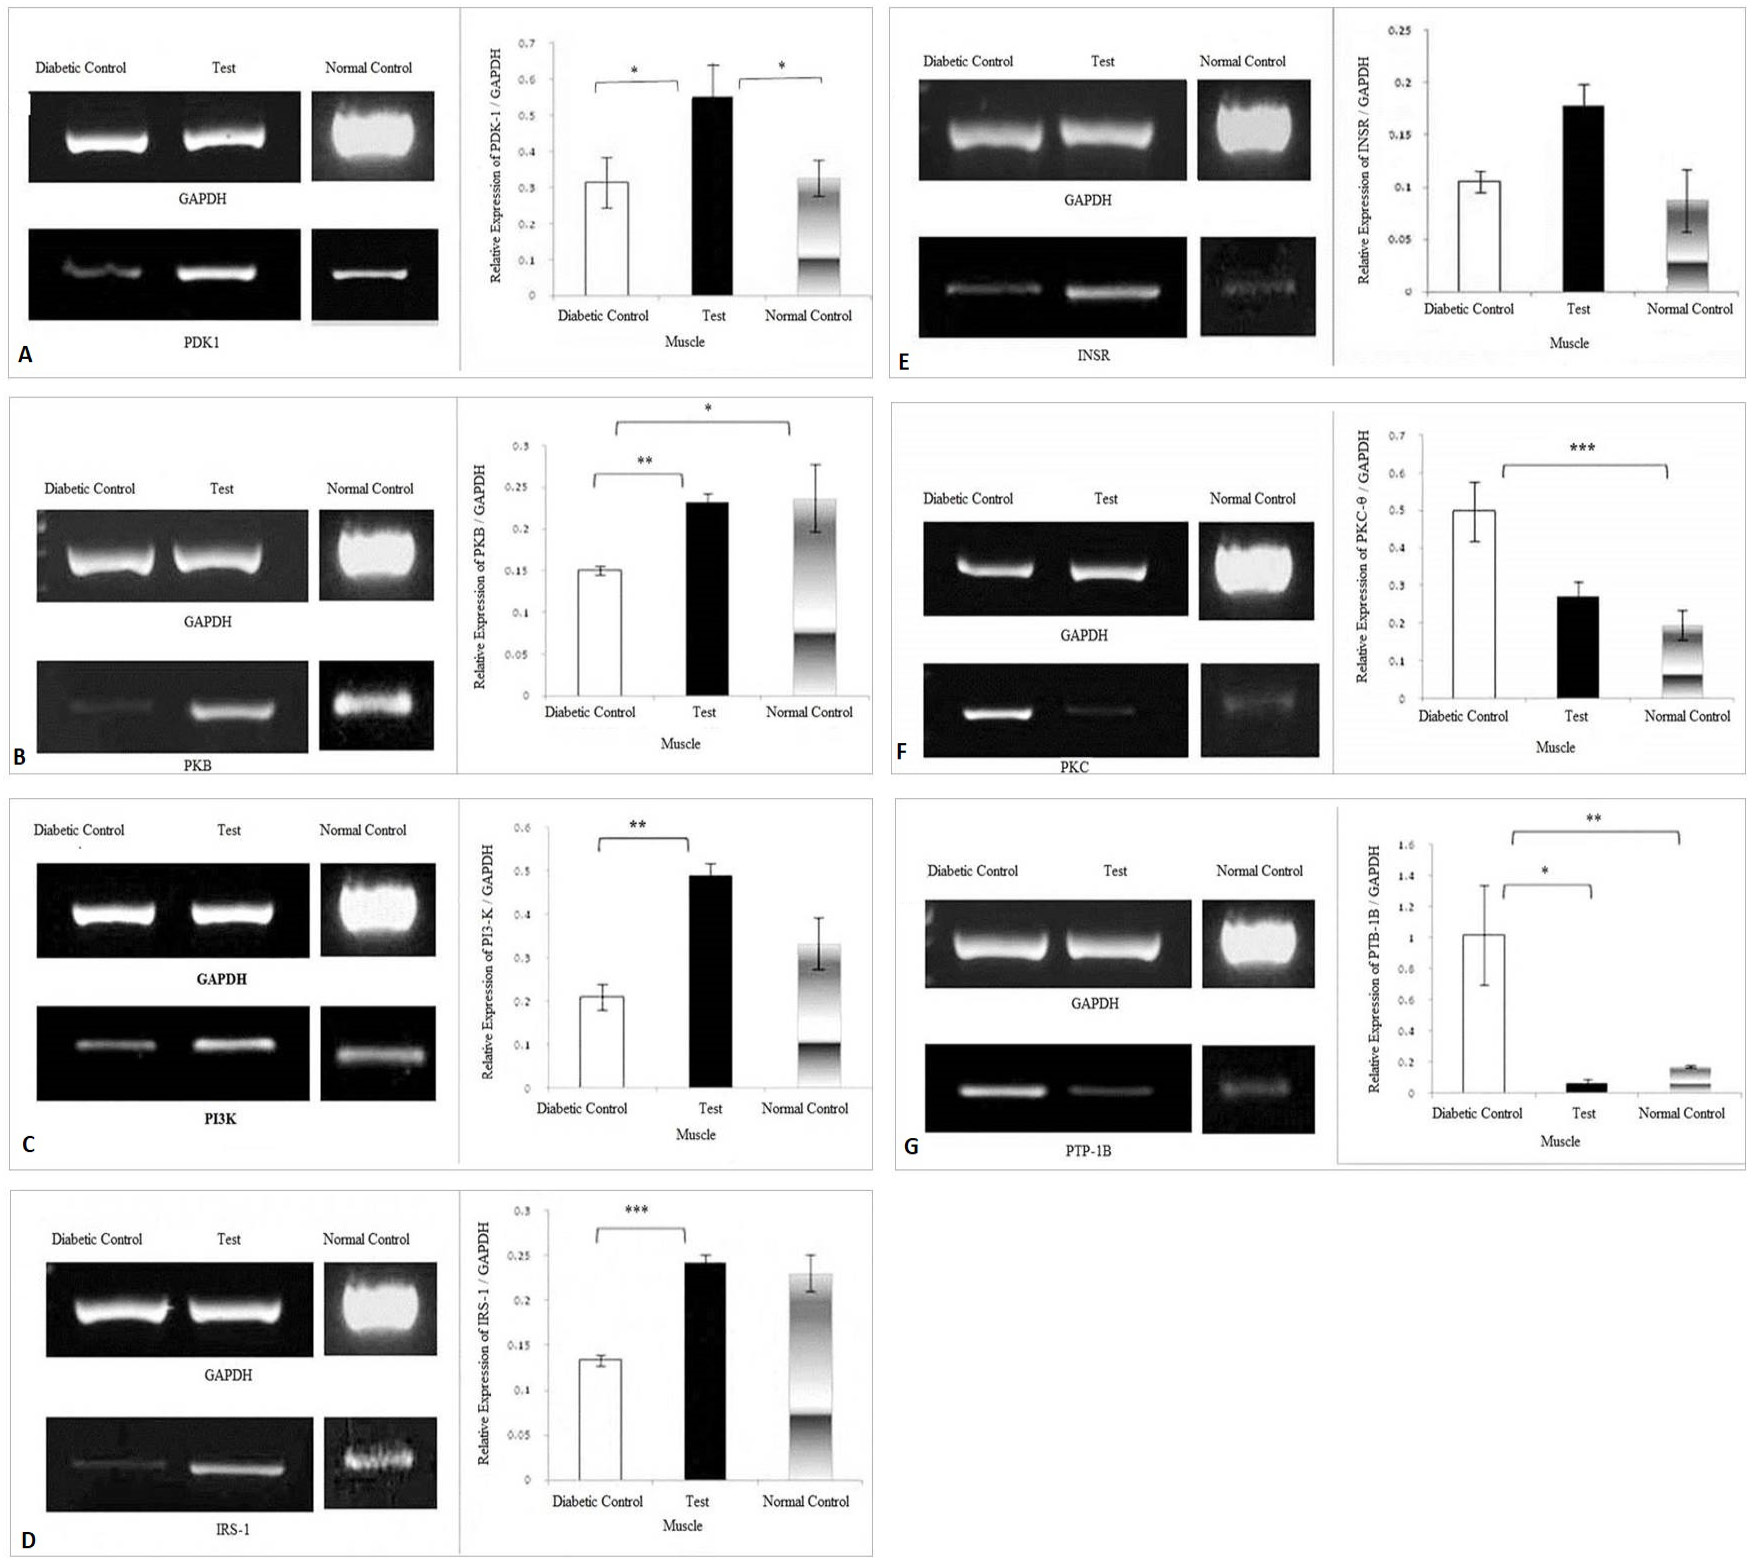
Effect of Trigonella foenum graceum extract on the expression levels of (A) PDK-1, (B) PKB, (C) PI3-K, (D) IRS-1, (E) INSR, (F) PKC-θ, (G) PTP-1B, genes in the skeletal muscle. The density of each band was measured as Integrated Density Values (IDVs). The graphs are showing expression of genes relative to the expression of GAPDH. Analysis was done by one way ANOVA followed by Bonferroni’s post hoc test for comparison between groups using Sigma plot software. Data are presented as means ± SD and level of significance is p < 0.05 (where * = p < 0.05; ** = p < 0.01 and *** = p < 0.001; n = 6).
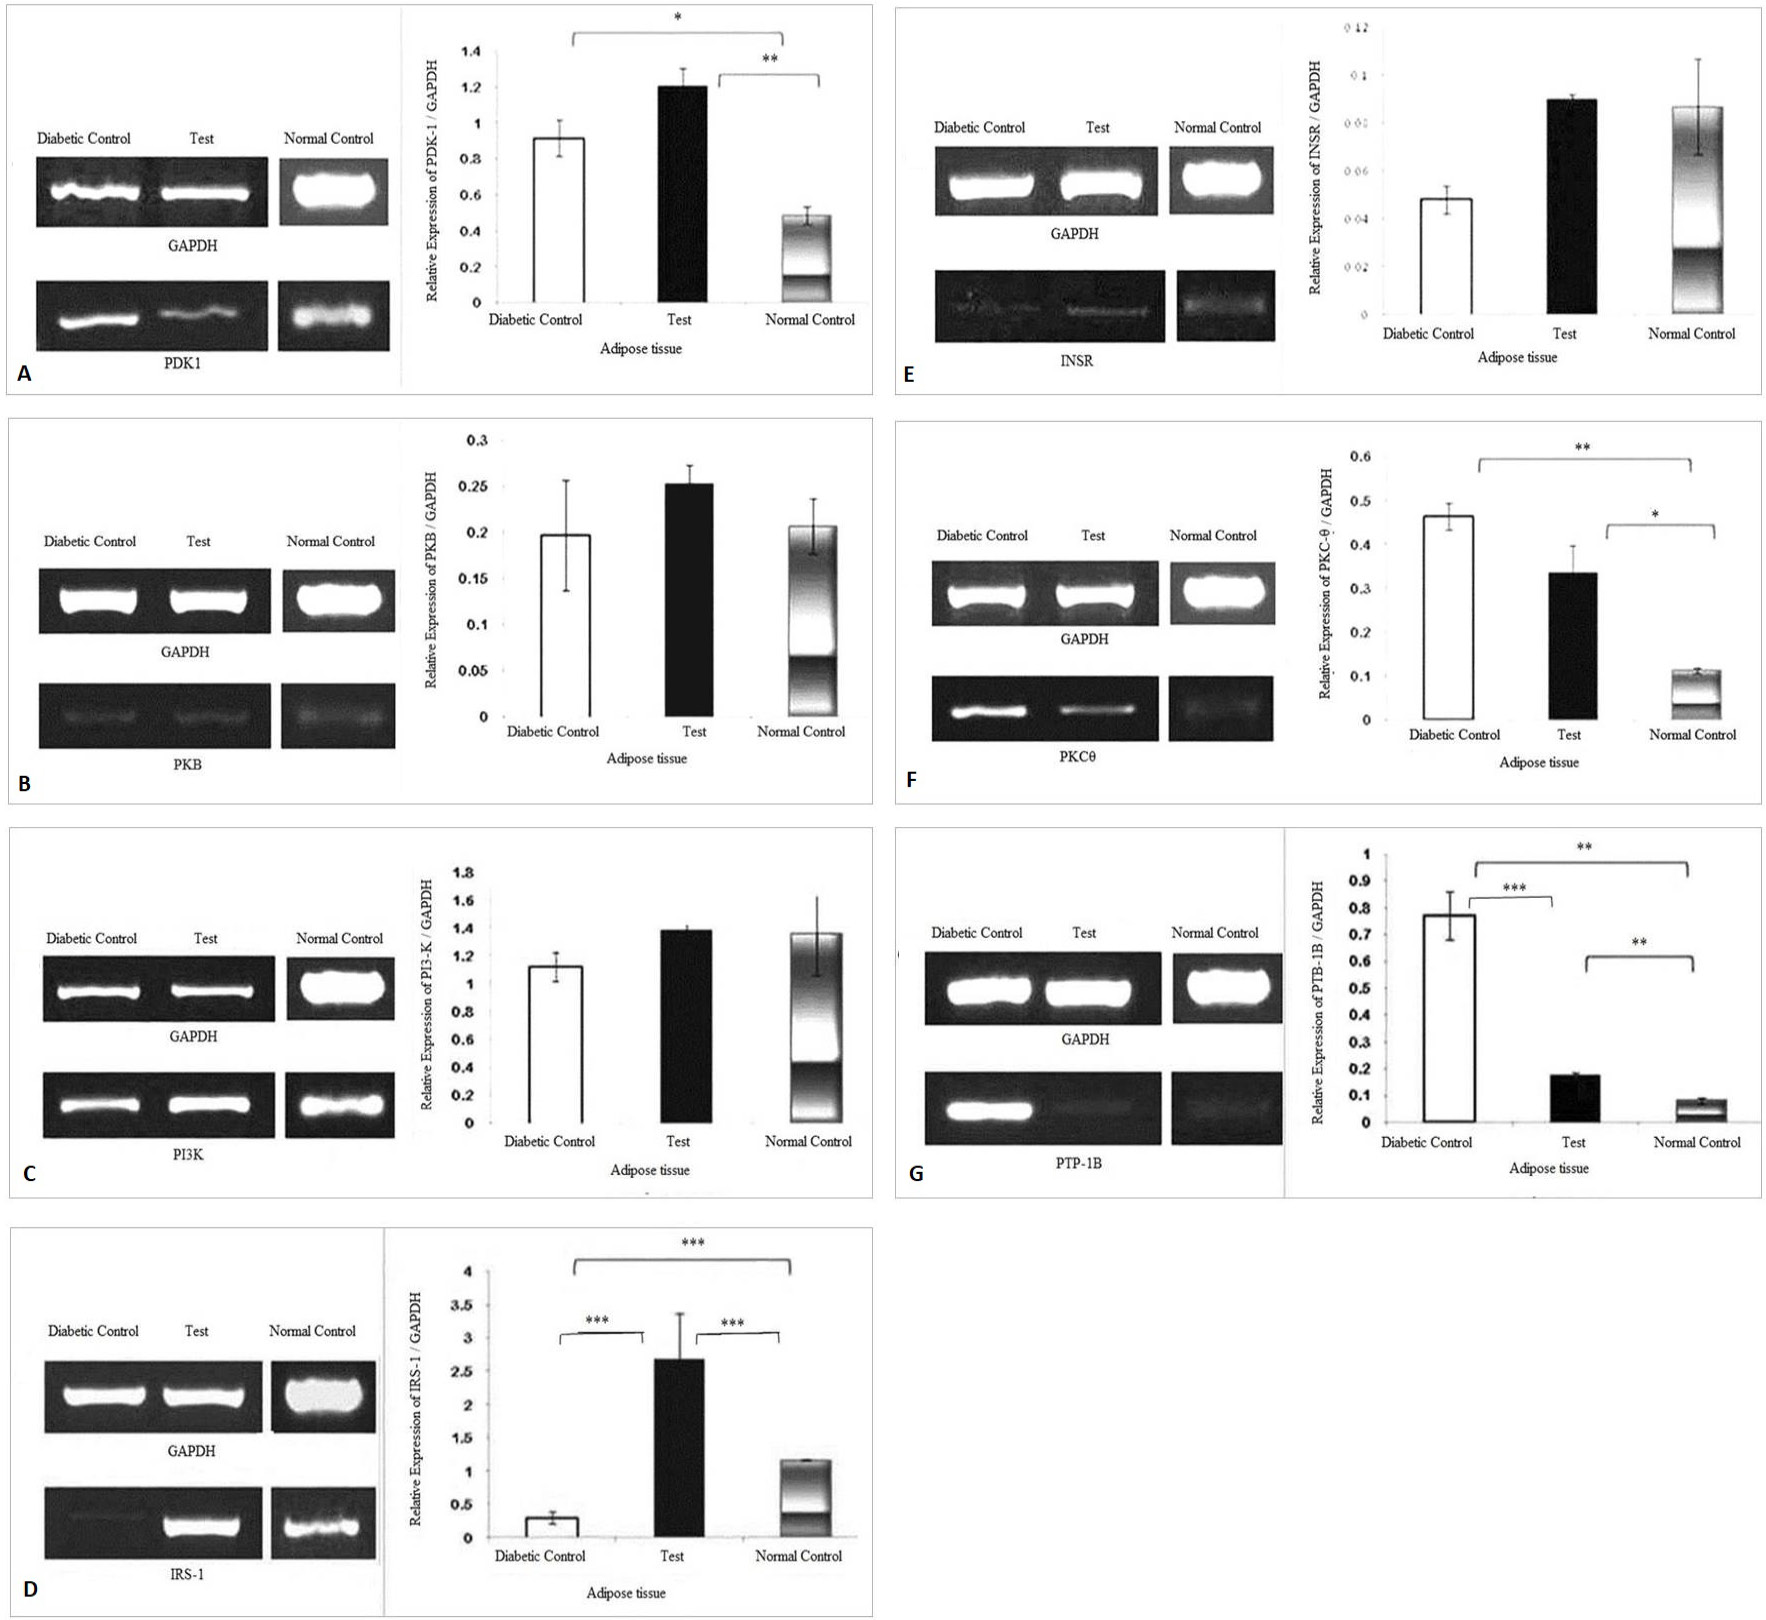
Effect of herbal combination extract on the expression levels of (A) PDK-1, (B) PKB, (C) PI3-K, (D) IRS-1, (E) INSR, (F) PKC-θ, (G) PTP-1B, genes in the adipose tissue. The density of each band was measured as Integrated Density Values (IDVs). The graphs are showing expression of genes relative to the expression of GAPDH. Analysis was done by one way ANOVA followed by Bonferroni’s post hoc test for comparison between groups using Sigma plot software. Data are presented as means ± SD and level of significance is p < 0.05 (where * = p < 0.05; ** = p < 0.01 and *** = p < 0.001; n = 6).
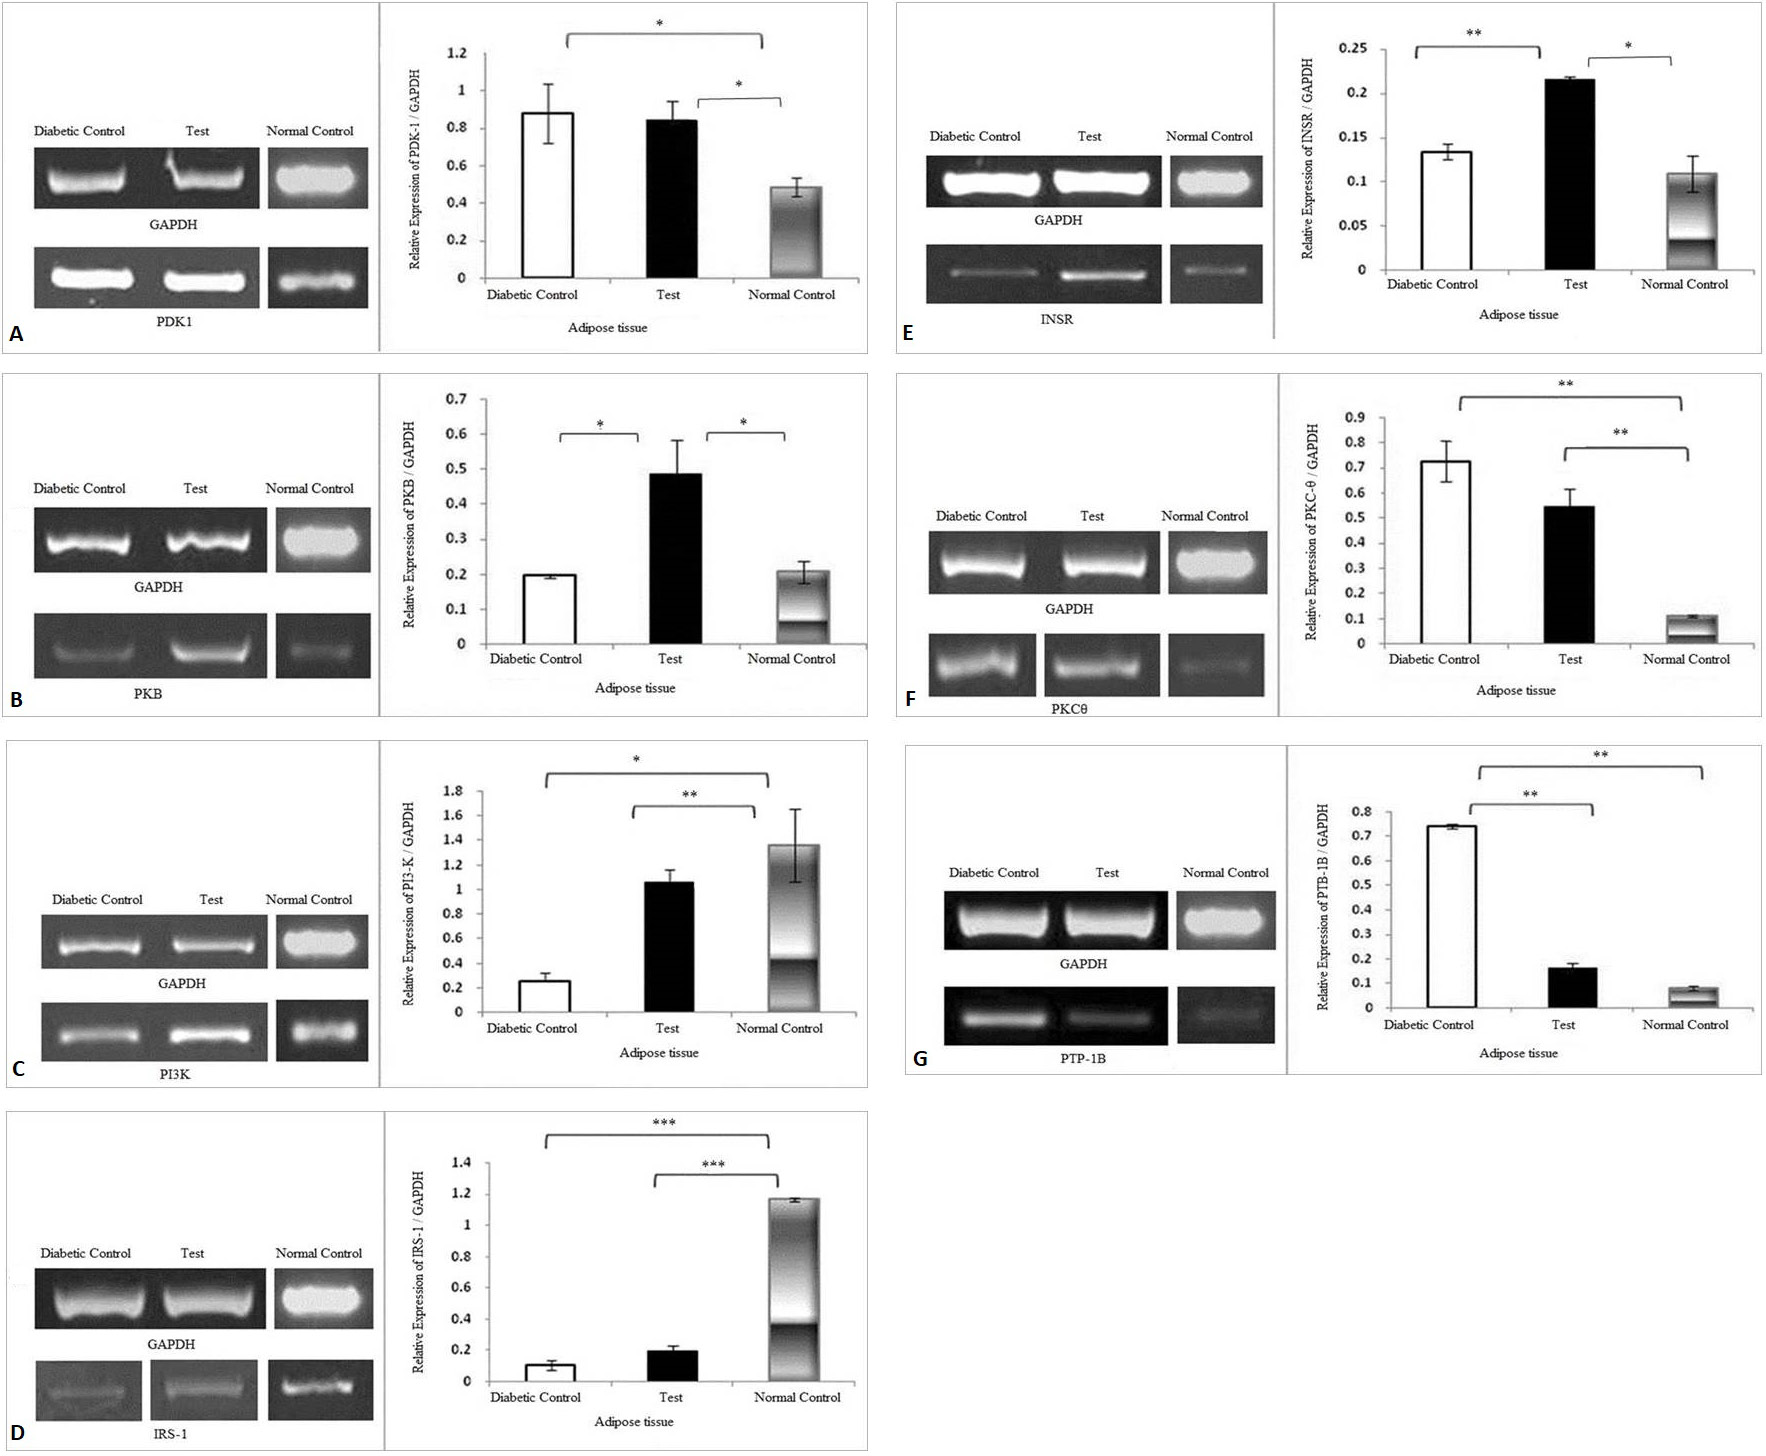
Effect of Trigonella foenum graceum extract on the expression levels of (A) PDK-1, (B) PKB, (C) PI3-K, (D) IRS-1, (E) INSR, (F) PKC-θ, (G) PTP-1B, genes in the adipose tissue. The density of each band was measured as Integrated Density Values (IDVs). The graphs are showing expression of genes relative to the expression of GAPDH. Analysis was done by one way ANOVA followed by Bonferroni’s post hoc test for comparison between groups using Sigma plot software. Data are presented as means ± SD and level of significance is p < 0.05 (where * = p < 0.05; ** = p < 0.01 and *** = p < 0.001; n = 6).
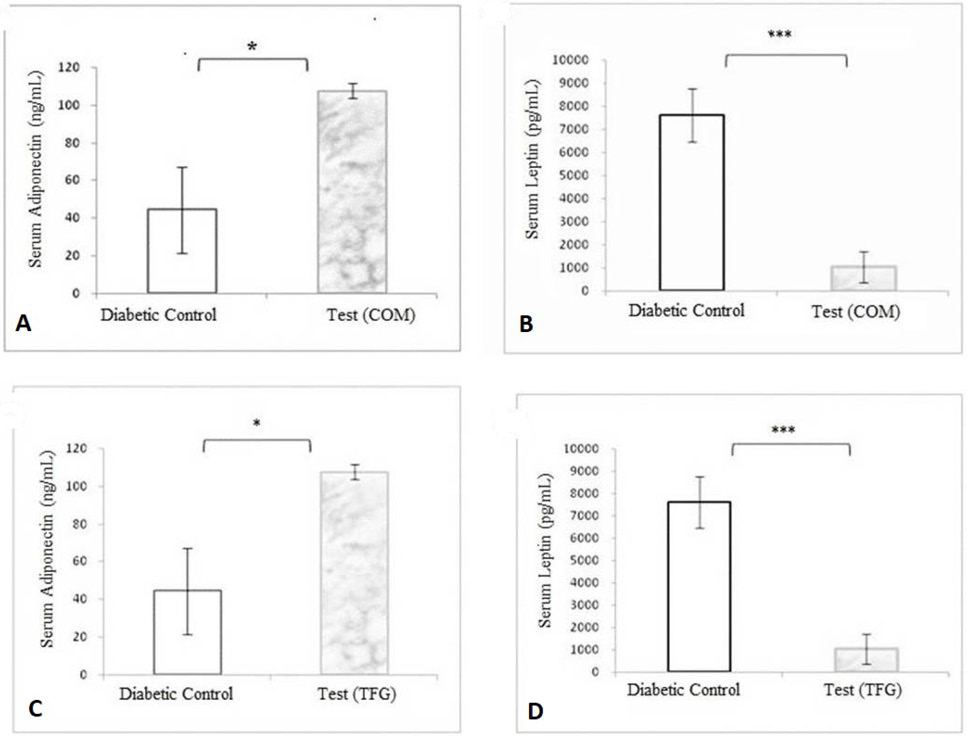
Quantification of adipokines after herbal combination extract treatment using ELISA: (A) Adiponectin, (B) Leptin and Quantification of Adipokines after Trigonella foenum graceum treatment, (C) Adiponectin, (D) Leptin. Data is presented as means ± SEM where n = 3. For statistical analysis, a Shapiro-Wilk Normality test was performed and all comparisons were made with Student’s t- tests. Level of confidence was p <0.05; (*= p<0.05, **=p<0.01, ***= p<0.001).


