
Lemniscomys are exclusively African rodents. This study deals with morphs-genetic analysis of eight species viz. Lemniscomys barbarus, L. bellieri, L. griselda, L. limulus, L. macculus, L. rosalia, L. striatus and L. zebra; which have practically similar external morphologies although they spread in completely different geographical areas. The approach adopted was to identify landmarks on the skulls of all specimens using the tpsDig software, and then analyzing them through the program MorphoJ. Our results show that L. griselda has the largest skull, whereas L. zebra has the smallest. L. griselda and L. rosalia have greater breadth of the braincase, length of the nasals and length of the tympanic bulla, than the other species. This is probably related to a phenotypic evolution due to selective pressure, as is also the case in the genus Gerbillus.
Short Communication · Volume 49, Issue 1, 21 January 2017 · Open Access
Morpho-Geometric Analysis of Eight Grass Mouse Species of the Genus Lemniscomys (Rodentia: Muridae)
· · · ·
Affiliations & Notes ⌄
- 1Research Unit “Biodiversité et Biologie des Populations”, Faculty of Sciences of Tunis, University of Tunis El Manar, 2092 Tunis * Corresponding author: imedbensalem.fst@gmail.com p.p1 {margin: 0.0px 0.0px 0.0px 0.0px
- 2text-align: justify
- 3font: 9.0px 'Times New Roman'} p.p1 {margin: 0.0px 0.0px 0.0px 0.0px
- 4font: 10.0px 'Times New Roman'}
Article Info ⌄
- Journal:
- Pakistan Journal of Zoology
- Published:
- 21 January 2017

From the article
- The morpho-geometric approach applied on eight species of the genus Lemniscomys shows that the closest species on a cranial level can have dissimilar cytogenetic sets.
- It would be interesting to explore this difference between morpho-geometric and cytogenetic results with further molecular studies of this genus.
Selected from the article's own text.
Abstract
Material and methods
A total of 200 adult specimens were analyzed, representing eight species L. barbarus (Linnaeus, 1766), L. bellieri (Van der Straeten, 1975), L. griselda , L. limulus , L. macculus , L. rosalia , L. striatus (Linnaeus, 1758) and L. zebra (Heuglin, 1864). Each species is represented by 25 specimens, they are deposited in Institut Royale des Sciences Naturelles de Belgique (IRSNB), Musé Royal de l’Afrique Centrale (MRAC) and Faculté des Sciences de Tunis (FST) in the Research Unit “Biodiversité et Biologie des Populations” (Supplementary Table I). The deposited specimens in the two museums mentioned above were identified according to Van der Straeten in his previous works (Carlton and Van der Straeten, 1997; Van der Straeten and Verheyen, 1980).
The skulls of all specimens were photographed on the ventral side using a Canon PowerShot A2200 HD camera (14.1 MP resolution). Using the software tpsDig, version 1.40 20 landmarks are identified on the skull images (Fig. 1).
1, tip of the nasal; 2, 15, inferior margin of infraorbital foramen; 3, 14, anterior extremity of molar row; 4, 13, posterior extremity of molar row; 5, 12, back of zygomatic notch; 6, 11, tympanic bulla at the posterior border of the external auditory meatus; 7, 10, posterior extremity of the tympanic bulla; 8, 9, posterior intersection between foramen magnum and occipital condyle; 16, anterior extremity of foramen; 17, posterior extremity of foramen; 18, aAnterior limit of mesopterygoid fossa; 19, 20, junction between tympanic bulla and pterygoid process.
The configurations of landmarks were analyzed by the MorphoJ program version 1.05f . The average size of a skull was obtained from the square root of the sum of squared distances between landmarks and the center of gravity (or centroid) of the skull . The difference in average size of skulls between species is visualized by box plots. Differences in the shape of skulls between species are visualized through the Canonical Variate Analysis (CVA). Finally, Unweighted Pair Group Method with Average (UPGMA) was computed from the Procrustes distances obtained through ventral side configurations. All statistical analyses were performed using the PAST software, version 2.17 .
Results
We noticed a significant variation in the size of skulls (Fig. 2), Turkey HSD test suggests that L. griselda have the largest skulls (P <0.001) whereas L. zebra presents the smallest ones (P <0.001). The other species L. barbarus, L. bellieri, L. limulus, L. macculus, L. rosalia and L. striatus show intermediate sizes.
The variation in the shape of skulls is not related to the size of the skulls. The Canonical Variate Analysis (CVA; Fig. 3) corresponding to the ventral side configuration shows us a significant difference in the shape of skulls between species (Manova: Wilks’ λ = 0.0063; F = 14.29; P <0.001), the first 2 axes of the CVA absorbing 73.024% of variances, axis 1 (55.456%) allows discrimination of L. griselda, L. linulus and L. rosalia which are located in the positive part of the first axis, L. barbarus, L. macculus, and L. zebra are located in the negative part, whereas L. bellieri and L. striatus are located in the intermediate part with a substantial overlap. Axis 2 (17.568%) of the CVA shows significant overlapping between species, however it allows the discrimination between L. barbarus and L. zebra.
The variation on the axis 1 of the CVA focuses on landmarks n° 1, 16, 6, 11, 19 and 20 (Fig. 4), which menas that the most discriminating factors are the breadth of the braincase (landmarks n° 6 and 11), length of nasals (landmarks n° 1 and 16) and length of tympanic bulla (landmarks n° 19 and 20). The latter is more developed among L. rosalia and L. griselda than among the other species.
The UPGMA tree (Fig. 5) computed from the obtained Procrustes distances reveals the existence of two groups: the first consists of L. barbarus; L. bellieri; L. macculus and L. zebra, the second is formed by L. linulus and L. rosalia; L. striatus has a central position, whereas L. griselda has a basal position in the UPGMA tree.
Discussion
Geometric morphometric analysis is used for the first time on the genus Lemniscomys. Our results are close to those found by Van der Straeten and Verheyen (1980), despite having used multivariate analysis methods based on cranial measurements. However, recent molecular studies of the genus Lemniscomys show that L. rosalia, L. striatus and L. zebra have the same ancestry , which differs from the results found by morphometric analysis mentioned above and the present analysis. The difference, in this case, between molecular and morphometric analysis can be explained by a high rate of phenotypic evolution, this suggests the action of different selective pressures or functional constraints in the morphological evolution of the genus Lemniscomys, as in the case of the genus Gerbillus (Abiath, 2002; . Our results show that
close species morphologically on the cranial level are more or less sympatric species such as L. macculus and L. zebra (Eastern Africa) or L. griseldaand L. rosalia (Zambia) covering the same geographical areas .
Conclusion
The morpho-geometric approach applied on eight species of the genus Lemniscomys shows that the closest species on a cranial level can have dissimilar cytogenetic sets. It is due to a high rate of phenotypic evolution that can surpass the molecular counterpart. It would be interesting to explore this difference between morpho-geometric and cytogenetic results with further molecular studies of this genus.
Acknowledgements
The present study has been carried out in the Research Unit “Biodiversité et Biologie des Populations” at the “Faculté des Sciences de Tunis” (FST). It would have never been possible without the collaboration of many people we want to thank. We express our greatest gratitude to Mr. George LENGLET, curator at the “Institut Royale des Sciences Naturelles de Belgique” (IRSNB), who welcomed us at the Institute, and Mr. Wim WENDELEN, curator at the “Musé Royal de l’Afrique Centrale” (MRAC).
Conflict of interest statement
The authors declare that there is no conflict of interests regarding the publication of the manuscript.
Supplementary material
There is supplementary material associated with this article. Access the material online at: http://dx.doi.org/10.17582/journal.pjz/2017.49.1.sc1
Figures
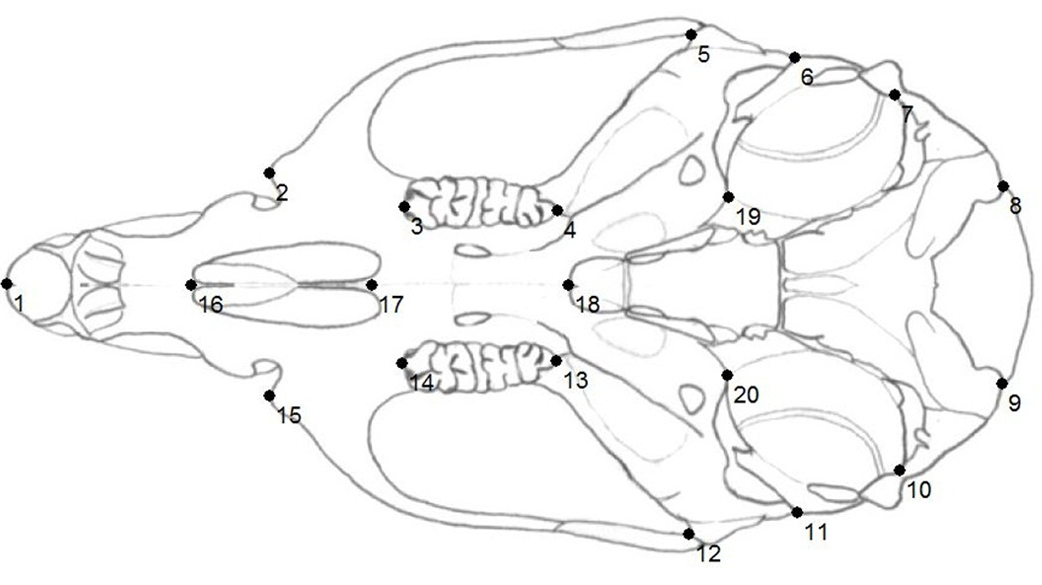
Placement of the collected landmarks
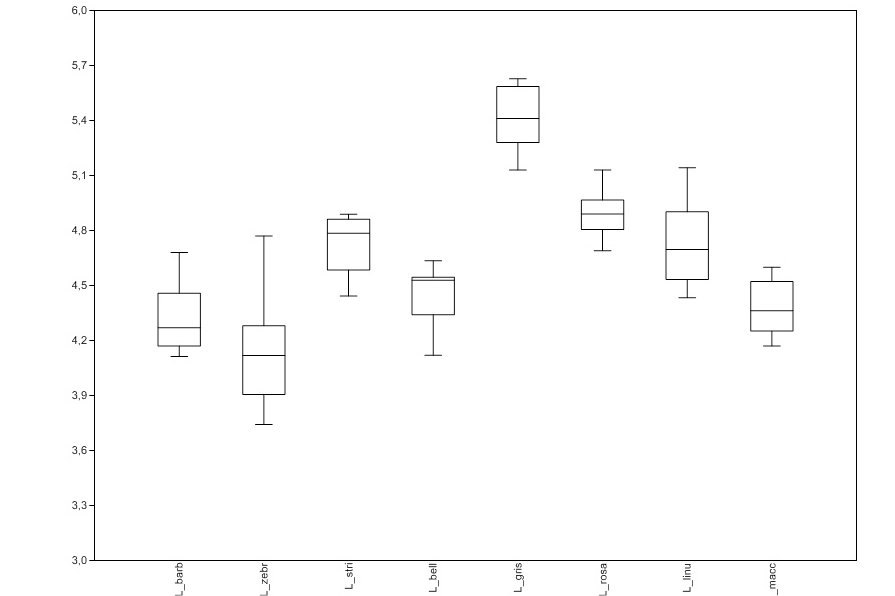
Box plot showing the average of centroid size based on ventral configurations of each species. Box margin are the 25th and 75th percentiles, bars extend to 5th and 95th percentiles, the inner line represents the median.
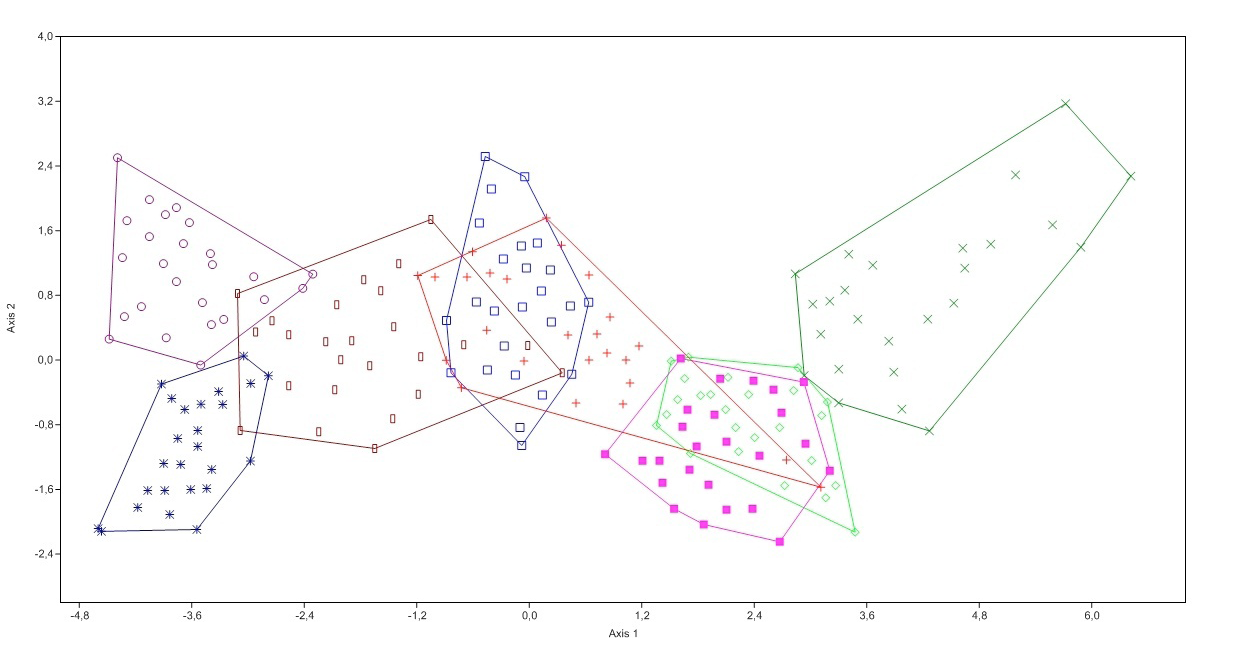
Canonical Variate Analysis (CVA) of ventral configurations
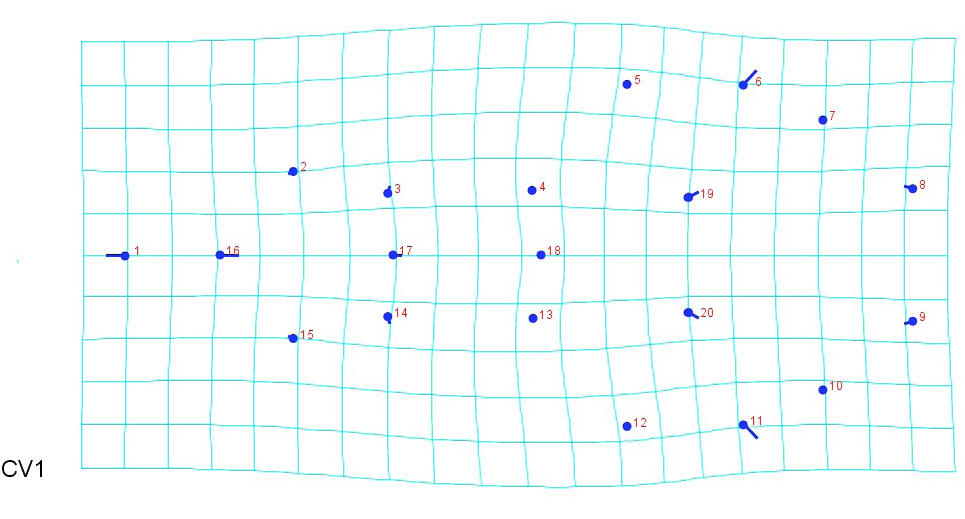
Variation of landmarks on axis 1 of the CVA
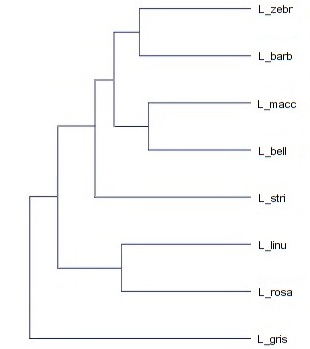
UPGMA based on Procrustes distances for ventral configurations of skulls.
References
- Abiath, A., 2012. Statut taxonomique du genre Gerbillus (Rongeurs, Gerbillinae) en Tunisie: Approches morphologique, cytogénétique et moléculaire. PhD thesis. Faculté des Sciences de Tunis. Tunis, Tunisia, pp. 140.
- Abiath, A., Colangelo, P., Capanna, E. and Cheniti T.L., 2010. C. R. Biol., 333:680-687.
- Bookstein, F.L., 1991. Morphometric tools for landmarks data. Cambridge University Press, New York, USA, pp. 435.
- Carlton, M.D. and Van der Streaten, E., 1997. Proc. biol. Soc. Washington, 110:640-680.
- Castaglia, R. and Oguge, N., 2008. Mammalia, 72:57-60.
- Castaglia, R., Fadda, C., Corti, M., Scanzani, A., Verheyen, W. and Capanna, E., 2002. J. Zool. System. Evolut. Res., 40:223-231.
- Denys, C., Lecompte, E., Granjon, L., Baylac, M., Cordeiro, P., Cornette, R., Dobigny, G., Fichet-Calvet, E., Hugot, J.P., Meslage, C., Millien-Parra, V., Petrillo, P., Volobouev, V. and Welz, M., 2003. In: Rats, mice and people: Rodent biology and management (ACIAR) (eds. G.R. Singleton, L.A. Hinds, C.J. Krebs and D.M. Spratt), Canberra, Australia, pp. 499-506.
- Heuglin, T.H.V., 1864. Beiträge zur Zoologie Central-Afrika’s. Leopoldina 31, Abhandlungen, 7: 1-15.
- Kingdon, J., Happold, D., Butynski, T., Hoffmann, M., Happold, M. and Kalina, J., 2013. Mammals of Africa. Volume III. Bloombury Publishing, London, United Kingdom, pp. 784.
- Klingenberg C.P., 2013. MorphoJ. version 1.05f. Faculty of life Sciences. University of Manchester. United Kingdom. http://www.flywings.org.uk/morphoj_page.htm. (accessed on 10 Jan 2015).
- Linnaeus, C., 1758. Systema Naturae per regna tria naturae, secundum classis, ordines, genera, species cum characteribus, differentiis, synonymis, locis. Vol. I. Tenth edition (Laurentii Salvii). Stockholm. Sweden. pp. 824.
- Linnaeus, C., 1766. Systema Naturae per regna tria naturae, secundum classis, ordines, genera, species cum characteribus, differentiis, synonymis, locis. Vol. I. Regnum Animale, part I. Twelfth edition (Laurentii Salvii). Stockholm. Sweden. pp. 532.
- Mboumba, J.F., Nicolas, V., Colyn, M. and Deleporte, P., 2012. Afri. Zool., 47:285-293.
- Nicolas, V., Mboumba, J.F., Verheyen, E., Denys, C., Lecompte, E., Olayemi, A., Missoup, A.D., Katuala, P. and Colyn, M., 2008. J. Biogeogr., 35:2074-2089.
- Petter, F., 1961. Répartition géographique et écologique des rongeurs désertiques de la région paléarctique. PhD Thesis. University of Paris, Paris, France, pp. 222.
- Rohlf, F.J., 2009. tpsDig. version 1.40 ; PAST. version 2.17. Departement of Ecology and Evolution, State University of New York at Stony Brook, United States. http://life.bio.sunysb.edu/morph/. (accessed 10 Jan 2015).
- Thomas, O., 1904. On mammals from northern Angola collected by Dr. W. J. Ansorge. Annals and Magazine of Natural History. London. Series 7. 13: 405-421.
- Thomas, O., 1910. Notes on African rodents. Annals and Magazine of Natural History. London. Series 8. 6: 221- 226.
- Thomas, O. and Wroughton, R.C., 1910. Zoological results of the Ruwenzori expedition. Mammalia - Transactions of the Zoological Society of London. 19: 481-518.
- Trouessart, E.L., 1881. Catalogue des mamifères vivants et fossils, Rodentia. Bulletin de la Société d’Etude Scientifique, 10:124.
- Van der Straeten, E., 1975. Rev. Zool. Afri., 89:906-908.
- Van der Straeten, E. and Verheyen, W.N., 1980. Mammalia, 44:74-83.
Supplementary material
Services
Article usage statistics
Loading…