
Growing rate of high fat diet consumption can lead to an alarming ratio of metabolic disturbance and obesity. Despite the genetic regulation of metabolic responses, a close relationship between high energy food-intake and increased body-weight has been reported to support several pathologies in the metabolic and immune system. Present work was designed to evaluate the variations in serum protein level induced by fat rich diet. For this purpose, two groups of Wister rats were fed with diets carrying difference in percentage of fats. Protein profiling of treated groups indicated a marked increase in serum protein (related to iron metabolism and immune response) level compared to low fat-fed rats. Additionally, a decreased level of serum proteins was observed in the serum compared to control rats. Taken together, our findings conclude that diets rich in fats result in dysfunction of immune system and iron metabolism.
Research Article · Volume 33, Issue 1, 10 May 2018 · Open Access
Inquisition of Variations in Serum Protein Profile Induced by Fat Rich Diet in Rattus norvegicus
· ·
Affiliations & Notes ⌄
- 1Cell and Molecular Biology Lab, Department of Zoology, University of the Punjab, QA Campus, Lahore 54590 , *Corresponding author: Nadeem Sheikh, s_nadeem77@yahoo.com
Article Info ⌄
- Journal:
- Punjab University Journal of Zoology
- Published:
- 10 May 2018
From the article
- Analysis of serum protein profile illustrated marked variations in level of following serum proteins (Table I).
- There is a close link between obesity and serum transferrin level, as iron metabolism is affected by high fat diet and obesity.
- Complement proteins of alternative pathway (C3, factor B and D) are significantly regulated by body weight.
- Taken together these findings conclude that high fat diet affects the immune system and glucose metabolism by changing the serum protein levels which are related to obesity induced metabolic disturbances.
Selected from the article's own text.
Abstract
Introduction
Genetics play a significant role in modulating the constitution of body and metabolic responses ; however, researchers suggest that increased high energy diet is strongly linked with increased body weight ; . This gained weight may leads to obesity and related health disorders. In addition, studies employing animals have revealed that high fat diet also contribute to stimulate hunger than diets containing more carbohydrates. In other words, high fat diets not only result in weight gain but also have properties to elevate the appetite by inducing low satiation. Moreover, high fat diet also leads to increased lipid accumulation inside the body (Golay and Bobbioni, 1997). Organism’s physiology is designed to react towards a damaging action. This response of the body is known as inflammation. The signal may be physical, biological or chemical. In any case, homeostatic balance is maintained. Several different kinds of mediators and cells function in a synchronized way lead to the resulting action. The usual acute response is characterized by the lymphocyte recruitment to the infected area, which is induced by macrophages and mast cells residing within the adipose tissues. They produce different kinds of mediators of inflammation . Obesity is characterized by low grade chronic inflammation that enhances the risks of many disorders of heart, kidney, liver and pancreas . The inflammatory response triggered by obesity involves various factors of classical inflammatory response that increases the systemic inflammatory cytokines, acute phase proteins and recruitment of immune cells to the infected site .
Furthermore, the communication between metabolic and immune systems is a prominent characteristic of chronic low grade inflammation . This can be explained by the direct and paracrine signaling of classically activated macrophages that impair normal adipogenesis, insulin signaling, glucose transport, and many other metabolic pathways through the production of pro-inflammatory cytokines such as IL6, IL-1β, TNFα and IFN-ϒ . These cytokines may generate a coordinated increase in inflammatory genes and inhibit the genes responsible for proper nutrient metabolism .
Obesity and iron deficiency are associated with molecular mechanisms and dysregulation of iron metabolism is closely linked to obesity-induced inflammation. Liver is a key regulator of iron metabolism, however in obesity fat accumulation, inflammation and fibrosis in liver result in disturbed iron metabolism .
By affecting a huge number of nations with local differences, obesity and iron deficiency have become a worldwide epidemic. Both of these are apparently unrelated but are linked by molecular mechanisms. Iron deficiency and iron over load are frequent findings in obese subjects. Dysregulation of iron homeostasis is due to the inflammation in adipose tissues and elevated levels of iron regulatory protein (hepcidin). It is also affected by the cytokines like TNF-α, IL-6 and IL-1 including hepcidin including hepcidin, resistin and leptin from the inflamed adipose tissues. These adipocytokines also lead to the iron retention in liver, spleen and bone marrow thus lowering the serum iron and its availability to the maturing RBCs .
As mentioned above, obesity leads to variations in serum proteins due to altered nutrient metabolism. Therefore, it is imperative to evaluate the serum proteins to assess the effects of high fat diet and its correlation with the body weight and obesity.
Materials and Methods
Animal models
Male Wister rats (Rattus norvegicus) were obtained from the animal house of the Department of Zoology, University of the Punjab, Lahore, Pakistan. They were kept in clean and fully aerated environment at room temperature (24-26°C) and provided with freshwater ad libitum. The animals were divided in three different groups depending upon their diet. One group was designated as control with mean weight of 69±5g and given normal rat chow. There were two experimental groups; Group 1 with average body weight of 69±5g was provided with 33.3% dry milk, 33.3% sucrose and 33.3% ground rat chow . Group 2 with average weight of 70±5g was supplied with 50% dry milk and 50% rat chow.
Blood sampling and processing
After sixteen weeks all the animals were sacrificed under aseptic conditions. A total of 5ml of blood was taken from each animal in gel tubes for serum separation. After incubation for 2-3 h, blood was centrifuged for 20 min at 4000 rpm. Serum was stored at -20°C in labeled aliquots until the sodium dodecyl sulphate (SDS) gel electrophoresis was performed.
Evaluation of serum proteins and their variations among groups
A total of 0.1mm thick 8% polyacrylamide gel was prepared using Laemmli method and was carried out in gel apparatus from Bio-Rad Mini-Protean II. A 10μl BenchMarkTM unstained protein ladder (Catalogue# 10747-012) was used to evaluate the high molecular weight serum proteins. A total of 15µl of each sample was loaded in wells of stacking gel and electrophoresis was performed at 120V for the time until the dye reaches the lower ending of resolving gel in a cooling chamber followed by staining in Coomassie blue stain solution and in destaining solution made from methanol, acetic acid and distilled water. The gel was photographed after destaining and images were analyzed by gel analyzer Total Lab Quant 2.2. It showed the records of each protein fraction depending upon the molecular density. The results were then used to find out the variations in levels of serum proteins in experimental group, compared with that of control ones.
Results
Serum proteins of control and experimental animals were evaluated on SDS-PAGE by the use of the protein marker of molecular weight ranging from 10-220 kDa. The gel containing bands was assessed to reveal the changes in serum protein expression. Analysis of serum protein profile illustrated marked variations in level of following serum proteins (Table I).
Table I: Molecular weights of proteins resolved on SDS gel are illustrated.
| Proteins | Molecular weight (kDa) |
| Transferrin | 79.5 |
| Serum albumin | 68.731 |
| Ceruloplasmin | 120.841 |
| Complement C3 | 186.460 |
| Macrophage colony-stimulating factor 1 receptor | 109.264 |
| Complement inhibitory factor H | 140.344 |
| Protein Nlrc5 | 211.569 |
Serum albumin level was increased in both experimental groups as compared to control. Gel analysis of Group 1 showed a decreased level of serum transferrin, ceruloplasmin (Cp), complement C3, macrophage colony-stimulating factor 1 receptor, complement factor H (CFH) and protein NLR family, CARD domain 5 (Nlrc5) (Figure 1). An elevated level of these proteins was observed in serum samples of members of Group 2 (Figure 2).
Discussion
The current work includes the inquisition of electrophoretic examination of serum proteins. Analysis of serum protein profile illustrated marked variations in level of serum proteins just in accordance to the literature.
Complement factor H is a glycoprotein found abundantly in plasma and is crucial for maintenance of homeostatic balance of complements. It can also halt their activation. In C3b regulated cleavage it may function as a cofactor by accelerating the dissociation of alternative pathway C3 convertase ; ; ; . Elevated levels of factor H have been seen in case of insulin insensitivity and in several other metabolic dysfunctions. Association among the factor H and lipid parameters, insulin resistance and inflammatory markers can be explained by the alternative pathway activation of complements ; .
Transferrins are proteins that are involved in iron transport. It binds with two Fe3+ ions and with an anion too, generally a bicarbonate. It carriages iron from absorption site and haeme degradation to the site of iron use and storage. It also stimulates cell proliferation process. There is a close link between obesity and serum transferrin level, as iron metabolism is affected by high fat diet and obesity. Obesity results in increased level of serum transferrin .
Macrophage colony stimulating factor 1 is responsible for the proliferation, differentiation, survival and chemotaxis of the macrophages or monocytes. It is produced in various cell types. Its effects are facilitated by macrophage colony stimulating factor 1 receptor. It stimulates many signaling pathways on binding and activates a number of kinases . Macrophage colony stimulating factor 1 receptor level was seen to increase in diabetic rats .
Ceruloplasmin (Cp) acts as serum ferroxidase and comprises maximum amount of plasma copper. It belongs to conserved group of proteins, which use copper for proper functioning. Description of ceruloplasminemia disclosed a major functional role of Cp in iron release from the cells . The Cp concentrations are strongly related to serum cholesterol and serum triglycerides level. Obese subjects show remarkable increase in serum Cp level . An association between elevated serum Cp level and type II diabetes mellitus has been observed ; . This may be due to the protective response to elevated free iron in circulation, which stimulate lipoperoxidation . In addition Cp is thought to be involved in inflammatory responses in obesity and obesity related disorders by stimulating oxidative stress ; ; ; .
Complement C3 is a cytokine inducible acute phase protein. Its cleavage product is an important detriment of lipid and glucose metabolism. Variations in serum C3 levels also change the lipid and glucose metabolism. LDL- cholesterol, triglycerides and free fatty acids have been recently reported to be positively linked with serum C3 levels ; . Serum complement protein C3 plays a pivotal role in complement activation pathways , and is crucial for the defense of the human body against intruding micro-organisms . Complement proteins of alternative pathway (C3, factor B and D) are significantly regulated by body weight. There is a close link between serum C3 protein level and body weight . In addition there is an inverse relation between serum C3 levels and HDL-cholesterol in hyperlipidemic families . High C3 levels have been expressed in obese subjects with diabetes and insulin resistance ; Muscari et al., 2000; ; .
Protein NLR family, CARD domain 5 (Nlrc5) is an example of inflammasome. Infalmmasomes includes a protein family that distinguishes a variety of microbes and internal signals to stimulate innate immune responses and low-grade inflammation. These promote the caspase-1 activation and recruitment for the pro-inflammatory cytokine production particularly IL-1β and IL-18. Recent studies have investigated that inflammasome expression increases in obesity and obesity related metabolic disorders . Serum proteins of Group 2 were in accordance with results of above-mentioned studies. Deviation in the level of the serum proteins from the previous literature may be due to the difference in percentage of fat in both diets. Increased serum albumin level in both of the experimental group needs to be explained by further research.
Conclusion
Taken together these findings conclude that high fat diet affects the immune system and glucose metabolism by changing the serum protein levels which are related to obesity induced metabolic disturbances.
Acknowledgement
The current work was supported by HEC funded project 20-2115. Authors are thankful to HEC for providing financial support.
Conflicts of interest
The authors declare no conflicts of interest.
Figures
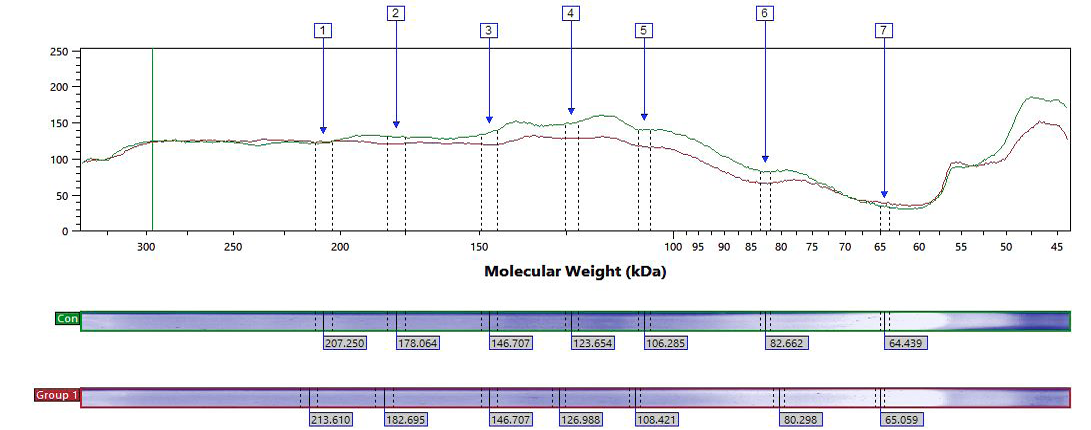
Electropherogram representing the control and group 1, given the volume of protein expression on Y-axis and molecular weight on X-axis.
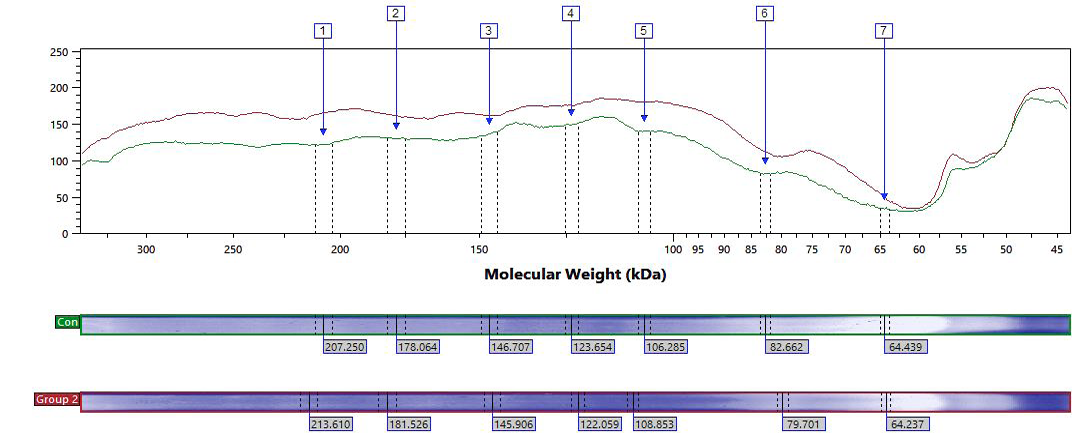
Electropherogram representing evaluation of control and group 2, given the volume of protein expression on Y-axis and molecular weight on X-axis.
References
- Abbas, A.S. and Sheikh, N., 2016. Counter effects of N. Sativa L. and P. ovate L. on indicative markers of non alcoholic fatty liver disease. Pak. J. Pharm. Sci., 29: 185-191.
- Aigner, E., Feldman, A. and Datz C., 2014. Obesity as an emerging risk factor for iron deficiency. Nutrients, 6: 3587-3600. https://doi.org/10.3390/nu6093587[CrossRef]
- Anderson, E.R. and Shah, Y.M., 2013. Iron homeostasis in the liver. Comp. Physiol., 3: 315-330. https://doi.org/10.1002/cphy.c120016[CrossRef]
- Baumgartl, J., Baudler, S., Scherner, M., Babaev, V., Makowski, L., Suttles, J., McDuffie, M., Fazio, S., Kahn, C.R. and Hotamisligil, G.K.S., 2006. Myeloid lineage cell-restricted insulin resistance protects apolipoproteinE-deficient mice against atherosclerosis. Cell Metab., 3: 247-256. https://doi.org/10.1016/j.cmet.2006.02.010[CrossRef]
- Berkey, C.S., Rockett, H.R., Field, A.E., Gillman, M.W. and Colditz, G.A., 2004. SugarGÇÉadded beverages and adolescent weight change. Obes. Res., 12: 778-788. https://doi.org/10.1038/oby.2004.94[CrossRef]
- Cignarelli, M., Depergola, G., Picca, G., Sciaraffia, M., Pannacciulli, N., Tarallo, M., Laudadio, E., Turrisi, E. and Giorgino, R., 1996. Relationship ofobesity and body fatdistribution with ceruloplasmin serum levels. Int. J. Obes. Relat. Metab. Disord., 20: 809-813.
- Cordoba, D., Rodriguez, S. and de Jorge, E.G., 2008. Translational mini-review series oncomplement factor H: genetics and disease associations of human complement factor H. Clin. exp. Immunol., 151: 1-13. https://doi.org/10.1111/j.1365-2249.2007.03552.x[CrossRef]
- Cunninghamn, J., Leffell, M., Mearkle, P. and Harmatz, P., 1995. Elevated plasmaceruloplasmin in insulin-dependent diabetes mellitus: Evidence for increased oxidative stress asa variablecomplication. Metabolism, 44: 996-999. https://doi.org/10.1016/0026-0495(95)90095-0[CrossRef]
- Daimon, M., Susa, S., Yamatani, K., Manaka, H., Hama, K., Kimura, M., Ohnuma, H. and Kato, T., 1998. Hyperglycemia is a factor for an increase in serum ceruloplasmin in type 2 diabetes. Diabet. Care, 21: 1525-1528. https://doi.org/10.2337/diacare.21.9.1525[CrossRef]
- de Cordoba, S.R., Esparza-Gordillo, J., de Jorge, E.G., Lopez-Trascasa, M. and Sanchez-Corral, P., 2004. The human complement factor H: Functional roles, geneticvariations and disease associations. Mol. Immunol., 41: 355-367. https://doi.org/10.1016/j.molimm.2004.02.005[CrossRef]
- Deng, T., Cui, J., Lyon, C.J., Zhang, N., Wang, H.Y., Wang, R.F. and Hsueh, W.A., 2013. Inflammasomes and obesity. In: Obesity, inflammation and cancer (eds. A.J. Dannenberg and N.A. Berger). Springer, New York, pp. 25-60. https://doi.org/10.1007/978-1-4614-6819-6_2[CrossRef]
- Feuerer, M., Herrero, L., Cipolletta, D., Naaz, A., Wong, J., Nayer, A., Lee, J., Goldfine, A.B., Benoist, C. and Shoelson, S., 2009. Lean, but not obese, fat is enriched for a unique population of regulatory T cells that affect metabolic parameters. Nature Med., 15: 930-939. https://doi.org/10.1038/nm.2002[CrossRef]
- Figueredo, A., Ibarra, J.L., Bagazgoitia, J., Rodriguez, A., Molino, A.M., Fernandez-Cruz, A. and Patino, R., 1993. Plasma C3d levels and ischemic heartdisease in type II diabetes. Diabet. Care, 16: 445-449. https://doi.org/10.2337/diacare.16.2.445[CrossRef]
- Freixenet, N., Remacha, A., Berlanga, E., Caixas, A., Gimenez-Palop, O., Blanco-Vaca, F., Bach, V., Baiget, M., Sanchez, Y. and Felez, J., 2009. Serum soluble transferrin receptor concentrations are increased in central obesity. Results from a screeningprogramme for hereditary hemochromatosis in men with hyperferritinemia. Clin. Chim. Acta, 400: 111-116. https://doi.org/10.1016/j.cca.2008.10.019[CrossRef]
- Gajda, A.M., 2009. High fat diets for diet-induced obesity models. Research Diets, Inc., New Brunswick, NJ, USA.
- Golay, A. and Bobbioni, E., 1997. The role of dietary fat in obesity. Int. J. Obes. Relat. Metab. Disord., 21: 2-11.
- Gotoh, K., Inoue, M., Masaki, T., Chiba, S., Shimasaki, T., Ando, H., Fujiwara, K., Katsuragi, I., Kakuma, T. and Seike, M., 2012. A novel anti-inflammatory role for spleen-derived interleukin-10 in obesity-induced inflammation in white adipose tissue and liver. Diabetes, 61: 1994-2003. https://doi.org/10.2337/db11-1688[CrossRef]
- Gros, P., Milder, F.J. and Janssen, B.J., 2008. Complement driven by conformational changes. Nat. Rev. Immunol, 8: 48-58. https://doi.org/10.1038/nri2231[CrossRef]
- Hellman, N.E. and Gitlin, J.D., 2002. Ceruloplasmin metabolism and function. Annu. Rev. Nutr., 22: 439-458. https://doi.org/10.1146/annurev.nutr.22.012502.114457[CrossRef]
- Jonsson, S., Hedblad, B., Engstrom, G., Nilsson, P., Berglund, G. and Janzon, L., 2002. Influence of obesity on cardiovascular risk. Twenty-three-year follow-up of 22,025 menfrom an urban Swedish population. Int. J. Obes. Relat. Metab. Discord., 26: 1046-1053. https://doi.org/10.1038/sj.ijo.0802060[CrossRef]
- Kannel, W.B., Wilson, P.W., Nam, B.H. and Dagostino, R.B., 2002. Risk stratification ofobesity as a coronary risk factor. Am. J. Cardiol., 90: 697-701. https://doi.org/10.1016/S0002-9149(02)02592-4[CrossRef]
- Laemmli, U.K., 1970. Cleavage of structural proteins during the assembly of the head of bacteriophage T4. Nature, 227: 680-685.
- Liu, W., Xu, G.Z., Jiang, C.H. and Da, C.D., 2009. Expression of macrophage colony-stimulatingfactor (M-CSF) and its receptor in streptozotocin-induced diabetic rats. Curr. Eye Res., 34: 123-133. https://doi.org/10.1080/02713680802650369[CrossRef]
- Lumeng, C.N., Delproposto, J.B., Westcott, D.J. and Saltiel, A.R., 2008. Phenotypic switching of adipose tissue macrophages with obesity is generated by spatiotemporal differences in macrophage subtypes. Diabetes, 57: 3239-3246. https://doi.org/10.2337/db08-0872[CrossRef]
- Luo, J., Elwood, F., Britschgi, M., Villeda, S., Zhang, H., Ding, Z., Zhu, L., Alabsi, H., Getachew, R., Narasimhan, R., Wabl, R., Fainberg, N., James, M.L., Wong, G., Relton, J., Gambhir, S.S., Pollard, J.W. and Wyss-Coray, T., 2013. Colony-stimulating factor 1 receptor (CSF1R) signaling in injured neurons facilitates protection andsurvival. J. exp. Med., 210: 157-172. https://doi.org/10.1084/jem.20120412[CrossRef]
- Markiewski, M.M. and Lambris, J.D., 2007. The role of complement in inflammatory diseasesfrom behind the scenes into the spotlight. Am. J. Pathol., 171: 715-727. https://doi.org/10.2353/ajpath.2007.070166[CrossRef]
- Mello, M.M., Studdert, D.M. and Brennan, T.A., 2006. Obesity-the new frontier of public health law. N. Engl. J. Med., 354: 2601-2610. https://doi.org/10.1056/NEJMhpr060227[CrossRef]
- Memisogullar, R. and Bakan, E., 2004. Levels of ceruloplasmin, transferrin, and lipid peroxidation in the serum of patients with Type 2 diabetes mellitus. J. Diebet. Complic., 18: 193-197. https://doi.org/10.1016/S1056-8727(03)00032-1[CrossRef]
- Muscari, A., Bozzoli, C., Puddu, G.M., Rovinetti, C., Fiorentini, G.P., Roversi, R.A. and Puddu, P., 1990. Correlations between serum lipids and complement components inadults without demonstrated atherosclerotic disease. Atherosclerosis, 81: 111-118. https://doi.org/10.1016/0021-9150(90)90017-D[CrossRef]
- Pasarin, M., La Mura, V., Gracia-Sancho, J., Garcia-Caldero, H., Rodriguez-Vilarrupla, A., Garcia-Pagin, J.C., Bosch, J. and Abraldes, J.G., 2012. Sinusoidal endothelial dysfunction precedes inflammation and fibrosis in a model of NAFLD. PLoS One, 7: e32785. https://doi.org/10.1371/journal.pone.0032785[CrossRef]
- Peake, P.W., Kriketos, A.D., Campbell, L.V. and Charlesworth, J.A., 2005. Response of the alternative complement pathway to an oral fat load in first-degree relatives of subjects withtype II diabetes. Int. J. Obes., 29: 429-435. https://doi.org/10.1038/sj.ijo.0802644[CrossRef]
- Pomeroy, C., Mitchell, J., Eckert, E., Raymond, N., Crosby, R. and Dalmasso, A.P., 1997. Effect of body weight and caloric restriction on serum complement proteins, including factor D/adipsin: Studies in anorexia nervosa and obesity. Clin. exp. Immunol., 108: 507-515. https://doi.org/10.1046/j.1365-2249.1997.3921287.x[CrossRef]
- Qatanani, M. and Lazar, M.A., 2007. Mechanisms of obesity-associated insulin resistance: Many choices on the menu. Genes Develop., 21: 1443-1455. https://doi.org/10.1101/gad.1550907[CrossRef]
- Skinner, A.C., Steiner, M.J., Henderson, F.W. and Perrin, E.M., 2010. Multiple markers of inflammation and weight status: cross-sectional analyses throughout childhood. Pediatrics, 125: e801-e809. https://doi.org/10.1542/peds.2009-2182[CrossRef]
- Somani, R., Grant, P.J., Kain, K., Catto, A.J. and Carter, A.M., 2006. Complement C3 andC-reactive protein are elevated in South Asians independent of a family history of stroke. Stroke, 37: 2001-2006. https://doi.org/10.1161/01.STR.0000231649.56080.6d[CrossRef]
- Taysi, S., Polat, F., Gul, M., Sari, R.A. and Bakan, E., 2002. Lipid peroxidation, some extracellular antioxidants, and antioxidant enzymes in serum of patients with rheumatoid arthritis. Rheumatol. Int., 21: 200-204. https://doi.org/10.1007/s00296-001-0163-x[CrossRef]
- Thiel, S., Vorup-Jensen, T., Stover, C.M., Schwaeble, W., Laursen, S.B., Poulsen, K., Willis, A.C., Eggleton, P., Hansen, S. and Holmskov, U., 1997. A secondserine protease associated with mannan-binding lectin that activates complement. Immunol. Lett., 56: 18. https://doi.org/10.1016/S0165-2478(97)85069-9[CrossRef]
- Torzewski, J., Bowyer, D.E., Waltenberger, J. and Fitzsimmons, C., 1997. Processesin atherogenesis: complement activation. Atherosclerosis, 132: 131-138. https://doi.org/10.1016/S0021-9150(97)00100-7[CrossRef]
- Ylitalo, K., Porkka, K.V., Meri, S., Nuotio, I., Suurinkeroinen, L., Vakkilainen, J., Pajukanta, P., Viikari, J.S., Peltonen, L. and Ehnholm, C., 1997. Serum complement and familial combined hyperlipidemia. Atherosclerosis, 129: 271-277. https://doi.org/10.1016/S0021-9150(96)06054-6[CrossRef]
- Weyer, C., Tataranni, P.A. and Pratley, R.E., 2000. Insulin action and insulinemia areclosely related to the fasting complement C3, but not acylation stimulating protein concentration. Diabet. Care, 23: 779-785. https://doi.org/10.2337/diacare.23.6.779[CrossRef]
Services
Article usage statistics
Loading…