
A negative dietary cation-anion difference (DCAD) motivates a compensated metabolic acidosis, stimulating calcium (Ca) absorption and mobilization before calving and decreasing clinical and subclinical hypocalcemia postpartum. The objective of this trial was to determine the effects of varying pre- and postpartum DCAD, mEq [(Na + K - Cl + S)]/ kg of dry matter on blood total Ca, ionized iCa, blood, and rumen metabolites, and endocrine status in prepartum and postpartum phases. Forty-eight multiparous Holstein cows range lactation 1-5 with an average body weight 706 kg ±7.29 SD were enrolled in a nested block design trial at 29 d prior anticipated parturition through 90 d in milk. A factorial arrangement of treatments -3 DCAD concentrations Tr1. (0.0, -100 or -180 mEq/kg DM) and -2 postpartum DCAD concentrations Tr2. (+250 or +350 mEq/kg DM). Prepartum urine pH was lower for cows fed -180 DCAD compared with -100 or 0.0 DCAD. Postpartum urine pH was higher for cows fed +350 mEq/kg compared with those fed +250 mEq/kg DCAD. Prepartum serum tCa, iCa, hydroxyproline (OH-PRO) was highest for -180 DCAD compared with both -100 and 0.0 DCAD. Parathyroid hormone was highest for 0.0 DCAD compared with -100, -180 DCAD. After calving there is a significant effect of tCa and iCa of prepartum treatment and we didn’t obtain any effect due to interaction between prepartum x postpartum treatment. Feeding an acidogenic diet improved Ca postpartum status.
Research Article · Volume 54, Issue 6, 28 August 2022 · Open Access
Influence of Varying Dietary Cation-Anion Difference on Blood Metabolites of Holstein Dairy Cows
· · · ·
Affiliations & Notes ⌄
- 1Department of Animal Production, Faculty of Agriculture, Kafrelsheikh University, Kafr El Sheikh, Egypt. 2Animal Production Research Institute, Agriculture Research Center, Ministry of Agriculture, Giza, Egypt. 3Department of Internal Medicine, Faculty of Veterinary Medicine, Kafrelsheikh University, Kafr El Sheikh, Egypt. * Corresponding author: hazem_hassanien@yahoo.com
Article Info ⌄
- Journal:
- Pakistan Journal of Zoology
- Published:
- 28 August 2022

From the article
- The composition of diets are shown in Table II and average DM intake in different treatments of prepartum diet DCAD 0.0, -100, or -180 mEq/kg DM (13, 13.1, 13.2 kg DM/day) and postpartum DCAD +250 or +350 mEq/kg DM (22.4 and 22.6 kg DM/day), respectively.
- Cows fed on prepartum DCAD have a significant with higher concentrations of tCa, iCa due to 0.0, -100 and -180 mEq/kg DM (Figs. 3, 4).
- The Hydroxyproline increased with increasing negative DCAD, while urine pH and PTH decreased in cows fed -180 than 0.0 and -100 mEq/kg DM (Fig. 1, Tables III, V).
- Postpartum blood metabolites were unaffected in cows given positive DCAD (+250 and +350 mEq/kg DM).
Selected from the article's own text.
Abstract
INTRODUCTION
The successful preventing hypocalcemia in a positive dietary cation-anion difference (DCAD) diet relies on reducing dietary Ca concentration to below requirements to stimulate Ca mobilization from labile bone stores and absorption from the diet maintenance for an individual animal can be as low as 25 g/d . This nutritional strategy has fallen out of favor due to high cation-containing forages and an insensitivity to Parathyroid hormone (PTH) signaling found in kidney and bone PTH receptors when a positive DCAD diet is fed ; . Alternatively, supplementing anionic salts to create an acidogenic diet prepartum has been used to improve Ca homeostatic before calving . Acidogenic diets formulation strategy causes compensated metabolic acidosis in blood of prepartum cows, decreasing urine pH and increasing urinary Ca excretion . Compensated metabolic acidosis also directly impacts Ca availability by increasing bone Ca mobilization and tissue responsiveness to hormonal signals ; . Under circumstances of prepartum compensated metabolic acidosis, Ca is absorbed actively and passively from the rumen and small intestine and mobilized from bone stores to be excrected through the urine to maintain Ca homeostasis. This continuous Ca flux creates a supply of available Ca to be used at the initiation of lactation when urinary Ca excretion is conserved ; . The objective of our study was to evaluate the effects 3 levels of DCAD prepartum (0.0, -100 or -180 mEq/kg DM) and 2 levels of DCAD postpartum (+250 or +350 mEq/kg DM), dietary strategy on urine pH, IgG, PTH, hydroxyproline, Ca status and blood parameters.
MATERIALS and METHODS
Management procedures of experimental animals
The field experiment was carried out on a private dairy farm in Egypt, which is approximately 80 kilometers from Cairo on the Ismailia desert road. Forty-eight multiparous Holstein cows with 3 to 4 wk of expected parturition were selected from the herd. Cows were fed twice daily at 700 and 1700 h. Prepartum diets were formulated to provide 0.0 mEq DCAD/kg dry matter (DM) as a control, -100 mEq/kg DM or -180 mEq DCAD /kg DM. Immediately after calving cows in each prepartum treatment were split and fed a lactation diet formulated to contain either +250 or +350 mEq DCAD/kg DM throughout the remainder of the trial. Cows were housed in an open yard with a shed area and milked three times daily 08:00, 16:00 and 24:00 h. Prepartum and postpartum diets were formulated using the Cornell net carbohydrate protein system (CNCPS version 6.5, Cornell University, Ithaca, NY) (Table I). Dietary ingredients were analyzed for DM, CP, EE, Ash, minerals , neutral detergent fiber (NDF), acid detergent fiber (ADF) and lignin , TDN, NEL and NFC were calculated according to NRC (2001).
Blood samples and measurement
Blood samples were collected from coccygeal vein on -14, -7, -2, 0, 2, 7, 14 and 21 d relative to predicted calving. Blood was collected into vacutainer tubes and serum was separated after centrifugation at 1,600 × g for 15 min at 5 °C, and frozen at −80°C until analysis. Sampling time (approximately 1300 h) corresponded to approximately 5 h after morning feeding. The analyses were performed in laboratory of Animal Reproductive Research Institute, Agriculture Research Center, Ministry of Agriculture, Al-Harm, Egypt. Blood serum samples were used for analysis of PTH and hydroxyproline (OH-PRO) were determined using bovine ELISA kit (Keyuan Road, DaXing Industry Zone, Beijing, China), tCa was determined calorimetrically according to the manufacture’s instruction (RA-50 Chemistry Analyzer (Bayer) using readymade chemical kits, (CA 1210 Biodiagnostic co. Egypt). iCa was determine by an ion-sensitive electrode of blood serum (RapidLab 348, Bayer Diagnostics, Fernwald, Germany). Colostrum was collected, weighed, and sampled immediately from first milking directly after parturition and frozen at −20oC. Concentrations of IgG were determined by calorimetrically at 585 nm CAT no CA 1210 IgG ELISA assay (Sunred co, China REF DZE201040108). Midstream urine samples were collected prepartum on days -21, -14, -7 and -2 d, after calving were measured at 2, 7 and 14 d, (Fig. 1) by manual stimulation of the vulva and were measured for urine pH immediately after collection by using a portable pH meter (PHS-3C, Youke Instrument Co. Ltd., Shanghai, China).
Table I. Ingredient composition of experimental diets formulated to differ in dietary cation-anion difference (DCAD).
| Ingredients (% DM) | Prepartum DCAD | Postpartum DCAD | |||
| 0 | -100 | -180 | +250 | +350 | |
| Corn silage | 39.35 | 38.94 | 38.68 | 32.07 | 32.07 |
| Wheat straw | 8.93 | 8.83 | 8.77 | - | - |
| Alfalfa hay | - | - | - | 8.05 | 8.05 |
| Corn, ground | 19.69 | 19.49 | 19.35 | 25.08 | 25.08 |
| Soybean meal, 44% CP | 7.75 | 7.67 | 7.62 | 20.43 | 20.43 |
| Beet pulp, dried | 7.20 | 7.12 | 7.08 | - | - |
| Corn gluten feed | - | - | - | 8.45 | 8.45 |
| Sunflower meal, 36% CP | 14.15 | 14.00 | 13.91 | - | - |
| Energier-Gold1 | - | - | - | 0.85 | 0.85 |
| OleoFat2 | - | - | - | 0.89 | 0.89 |
| Limestone | 1.06 | 1.11 | 1.14 | 0.54 | 0.54 |
| Salt | 0.30 | 0.30 | 0.30 | 0.41 | 0.41 |
| Sodium bicarbonate | - | - | - | 1.15 | 1.88 |
| M&V Dry Cow premix3 | 0.31 | 0.30 | 0.30 | - | - |
| Magnesium oxide | 0.23 | 0.22 | 0.22 | 0.19 | 0.19 |
| Free feed silica4 | - | - | - | 0.19 | 0.19 |
| Mycofix5 | - | - | - | 0.07 | 0.07 |
| Diamond V Yeast XP6 | - | - | - | 0.07 | 0.07 |
| Organic zinc | - | - | - | 0.02 | 0.02 |
| Potassium carbonate | - | - | - | 0.27 | 0.44 |
| Magnesium sulphate | 0.15 | 0.45 | 0.82 | - | - |
| Dicalcium phosphate | 0.22 | 0.22 | 0.22 | 0.09 | 0.09 |
| M&V premix7 | - | - | - | 0.27 | 0.27 |
| MegAnion8 | 0.37 | 0.51 | 0.54 | - | - |
| Calcium chloride | 0.31 | 0.82 | 1.06 | - | - |
| DCAD mEq/kg DM9 | 0.0 | -100 | -180 | +250 | +350 |
1Calcium salts fatty acids 84.5% (IIFCO, Malaysia). 2Fractionated fatty acids 99% (El- Sadat City, Egypt). 3Dry cow Mineral-vitamins premix contained each 3kg contains: Vit A 9,000,000iu, vit D3 2,000,000iu, vit E 40,000mg, Mn 50,000mg, Zn 50,000mg, Fe 50,000mg, Cu 15,000mg, I 250mg, Co150mg, Se 250mg (El-Dakahlia Company, Egypt). 4Silica mycotoxin binder (Avitasa, Spain). 5Enzymatic mycotoxin binder biology (Biomin GmbH, Austria). 6Diamond V (Cedar Rapids, IA, USA). 7Dairy cow Mineral-vitamins premix contained each 3kg contains: VitA 12,000,000iu, vitD3 2,500,000iu, vitE 35,000mg, Mn 80,000mg, Zn 100,000mg, Fe 50,000mg, Cu 20,000mg, I 300mg, Co400mg, Se 300mg CaCo3 up to 3kg (El-Dakahlia Company, Egypt). 8Origination (O2D Inc, Maplewood, MN, USA). Contains (%DM) 81.5% CP, 3.8%ADF, 7.5%NDF, 0.52%EE, 0.26%Ca, 0.49%P, 2.5%Mg, 1.6% K, 0.07%Na, 23.7%Cl and 3.1%S. DCAD= (Na+K)-(Cl+S)= -8270mEq/kg DM. according to Goff(2018). 9Dietary cation anion difference = DCAD = (Na+K) – (Cl+S) according to Goff and Koszewski (2018).
Statistical analysis
Statistical analysis of experimental data was carried out through the SPSS V23 (https://www.ibm.com/eg-en/analytics/spss-statistics-software).
RESULTS
The composition of diets are shown in Table II and average DM intake in different treatments of prepartum diet DCAD 0.0, -100, or -180 mEq/kg DM (13, 13.1, 13.2 kg DM/day) and postpartum DCAD +250 or +350 mEq/kg DM (22.4 and 22.6 kg DM/day), respectively. Prepartum urine pH, tCa and iCa are presented in (Table III). Cows fed on prepartum DCAD have a significant with higher concentrations of tCa, iCa due to 0.0, -100 and -180 mEq/kg DM (Figs. 3, 4). The Hydroxyproline increased with increasing negative DCAD, while urine pH and PTH decreased in cows fed -180 than 0.0 and -100 mEq/kg DM (Fig. 1, Tables III, V). Postpartum urine pH, tCa and iCa (Table VI) were affected due to 0.0, -100 and -180 mEq/kg DM, +250 and +350 mEq/kg DM, (Table VI). No differences were observed in serum PTH, OH-PRO and Insulin in postpartum due to 0.0, -100 and -180 mEq/kg DM, +250 and +350 mEq/kg DM or interaction (Table VII). There is no effect of (0.0, -100 and -180 mEq/kg DM) on calf birth weight, IgG and colostrum yield (Table IV).
Table II. Chemical composition of experimental diets formulated to differ in dietary cation-anion difference (DCAD).
| Ingredients (% DM) | Prepartum DCAD | Postpartum DCAD | |||
| 0 | -100 | -180 | +250 | +350 | |
| CP | 15.0 | 14.8 | 14.8 | 17.5 | 17.5 |
| Soluble protein (% of CP1) | 30.0 | 31.0 | 31.0 | 26.0 | 26.0 |
| Ether extract | 3.00 | 3.00 | 3.00 | 4.50 | 4.50 |
| NDF | 42.2 | 41.9 | 41.7 | 28.0 | 28.0 |
| NFC2 TDN | 31.80 70.0 | 31.80 69.0 | 31.80 69.0 | 40.80 76.0 | 40.50 75.0 |
| peNDF3 | 31.0 | 31.0 | 30.0 | 23.0 | 23.0 |
| NEl (Mcal/kg4) | 1.51 | 1.52 | 1.51 | 1.73 | 1.71 |
| Ash | 8.00 | 8.9 | 9.00 | 9.20 | 9.50 |
| Ca | 0.99 | 1.10 | 1.20 | 0.89 | 0.88 |
| P | 0.36 | 0.37 | 0.36 | 0.41 | 0.41 |
| Mg | 0.38 | 0.42 | 0.48 | 0.30 | 0.30 |
| K | 1.00 | 1.00 | 1.00 | 1.23 | 1.27 |
| Na | 0.20 | 0.20 | 0.20 | 0.56 | 0.76 |
| Cl | 0.51 | 0.70 | 0.80 | 0.34 | 0.34 |
| S | 0.32 | 0.40 | 0.48 | 0.34 | 0.33 |
| DCAD5 (mEq/kg DM) | 0.0 | -103.8 | -181.9 | +250.6 | +351.2 |
Values calculated using CNCPS v6.55 (2015). 1Soluble protein (%) = CP (%) − insoluble protein (%). 2NFC = 100 – [(NDF – neutral detergent insoluble CP) + CP + ash + fat)] Calculated according to (NRC, 2001). 3Predicted by Cornell Net Carbohydrate and Protein System (v 6.55, Cornell University, Ithaca, NY) Calculated according to Mertens (1997). 4Calculated from chemical composition (NRC, 2001). 5DCAD = (Na + K)– (S+Cl).
Table III. Urinary pH and blood calcium measured prepartum for cows fed diets formulated to contain 0, -100 and -180 mEq/kg dietary cation-anion difference (DCAD).
| Item | Prepartum DCAD (Tr1) | SEM | DCAD | P -value | |||
| 0.0 | -100 | -180 | day | DCAD x day | |||
| Urinary pH | 7.50 | 7.02 | 5.93 | 0.057 | 0.001 | 0.001 | 0.099 |
| tCa (mg/dL) | 8.38 | 8.85 | 9.40 | 0.048 | 0.001 | 0.001 | 0.170 |
| iCa (mg/dL) | 4.16 | 4.68 | 4.98 | 0.025 | 0.001 | 0.001 | 0.002 |
Table IV. Blood metabolites prepartum for cows fed diets formulated to contain 0, -100 and -180 mEq/kg dietary cation-anion difference (DCAD) during experimental period.
| Blood metabolites | Prepartum DCAD (Tr1) (mEq/kg DM) | SEM | P value | ||
| 0 | -100 | -180 | |||
| PTH pg/ml | 62.37a | 50.57b | 34.66c | 1.265 | 0.001 |
| Hydroxyproline µg/ml | 1.83c | 2.27b | 2.86a | 0.043 | 0.001 |
| Insulin, pmol/L | 179.16 | 179.66 | 178.83 | 0.435 | 0.738 |
abMeans in the same row with different superscripts differ (P < 0.05).
Table V. Calf birth weight, colostrum yield and Immunoglobulin-G (IgG) concentrations of cows fed diets formulated to contain 0, -100 and -180 mEq/kg dietary cation-anion difference (DCAD).
| Prepartum DCAD (Tr1) (mEq/kg DM) | SEM | P -value | |||
| 0.0 | -100 | -180 | |||
| Colostrum IgG g/L | 58.05 | 59.75 | 63.17 | 1.111 | 0.163 |
| Calf birth weight kg | 42.13 | 41.46 | 40.13 | 0.439 | 0.168 |
| Colostrum milk kg | 6.60 | 6.20 | 7.13 | 0.269 | 0.375 |
Discussion
DCAD and ionized calcium status
Both tCa and iCa had a positive connection at 48 h before and 48 h following parturition, respectively (Figs. 3, 4, 5). Figure 5 reveals a favourable association between iCa and tCa (r = 0.84, P 0.00) using simple linear regression. There was no evidence of hypocalcemia in either pre- or postpartum cows, as blood calcium levels were normal at 8-12 mg/dL and never went below 2 mmol/L or 8 mg/dL for all cows administered DCAD (Tables III, V). Serum Ca reached its nadir during the calving period or 1 and 2 d after parturition due to effect of treatment, day and interaction DCAD x day (Fig. 3), similar to previous reports ; . Acidogenic diets are hypothesized to increase serum Ca by increasing Ca mobilization from bone as indicated by elevated serum hydroxyproline which is indicator of bone resorption as shown in Table IV which agrees with mediated through increased serum PTH concentration . Tissue responsiveness to PTH was postulated to increase with greater blood acidity ; .
Table VI. Urinary pH and Ca concentrations for cows fed prepartum diets formulated to contain 0, -100 and -180 mEq/kg dietary cation-anion difference (DCAD) and postpartum diets formulated to contain 250 or 350 mEq/kg.
| Tr1 | 0 | -100 | -180 | P -value | ||||||||||
| Tr2 | 250 | 350 | 250 | 350 | 250 | 350 | SEM | Tr1 | Tr2 | day | Tr1 x Tr2 | Tr1 X day | Tr2 x day | Tr1 X Tr2 X day |
| Urine pH | 7.48 | 8.20 | 7.42 | 8.36 | 7.42 | 8.53 | 0.037 | 0.347 | 0.001 | 0.001 | 0.103 | 0.034 | 0.003 | 0.690 |
| tCa (mg/dL) | 7.98 | 8.09 | 8.64 | 8.47 | 8.92 | 9.19 | 0.054 | 0.001 | 0.511 | 0.001 | 0.247 | 0.003 | 0.587 | 0.086 |
| iCa (mg/dL) | 4.01 | 4.16 | 4.37 | 4.49 | 4.57 | 4.64 | 0.029 | 0.001 | 0.058 | 0.001 | 0.836 | 0.001 | 0.045 | 0.510 |
Tr1= prepartum DCAD treatment (0.0, -100 and -180), Tr2= postpartum DCAD treatment (+250 and +350).
Table VII. Blood metabolites measured postpartum for cows fed prepartum diets formulated to contain 0, -100 and -180 mEq/kg dietary cation-anion difference (DCAD) and postpartum diets formulated to contain 250 or 350 mEq/kg.
| Tr1 | 0 | -100 | -180 | P-value | ||||||
| Tr2 | +250 | +350 | +250 | +350 | +250 | +350 | SEM | Tr1 | Tr2 | Tr1x Tr2 |
| PTH (pg/ml) | 38.15 | 39.10 | 36.44 | 36.25 | 31.07 | 35.50 | 0.828 | 0.064 | 0.317 | 0.514 |
| Hydroxyproline (µg/ml) | 1.67 | 1.76 | 1.63 | 1.81 | 1.80 | 1.73 | 0.027 | 0.669 | 0.252 | 0.198 |
| Insulin, (pmol/L) | 82.0 | 82.66 | 85.66 | 81.0 | 84.0 | 87.0 | 0.737 | 0.241 | 0.825 | 0.136 |
Parathyroid hormone and iCa
Cows fed prepartum DCAD diets -180 and −100 mEq/kg DM had lower serum PTH concentrations compared with cows fed on 0.0 mEq/kg DM DCAD diet (Table IV). Serum PTH concentrations usually are negatively correlated with serum iCa concentrations . The blood PTH level increased 10-20 fold. If a cow is fed anions, the rise is temporary and falls by day 2 -3 to baseline levels . The target tissues respond to the PTH and it works on bone and kidney cells to restore blood Ca to the normal level. In cows not fed anions, that have more alkaline blood and urine- the PTH concentrations increased when blood Ca falls, but the tissues are resistant to the effects of PTH. We think that PTH receptor is not properly recognizing the hormone. As a result of blood Ca does not rise rapidly or at all and the parathyroid gland continues to secrete large amounts of hormone for a longer period. Cows with milk fever will have extremely high blood levels of PTH- but it is not helping them maintain normal Ca because the tissues do not recognize it .
Urine pH
Prepartum DCAD treatments and sample day had a significant effect on urine pH decrease (Fig. 1, Table III), as well as a negative association between urine pH and iCa. Increasing urine pH can lead to a decrease in iCa concentrations (r = -0.74, P 0.001), (Fig. 2). The urine pH was lower in the negative DCAD (-18 mEq/100 g of DM), which was consistent with ; ; ; . In contrast, Moore et al. (2000) reported no differences in postpartum Ca metabolism in cows given an anionic diet. The reason for increasing urine pH after calving due to (+250 or +350 mEq/kg DM) and day (Fig. 1) is due to high levels of sodium bicarbonate and potassium carbonate for raising DCAD and rumen buffering because lactating cow diet contains higher levels of concentrates, thus increasing DCAD postpartum to avoid ruminal acidosis.
Colostrum yield, IgG and calf BW
There were no effects on IgG, Colostrum yield, or calf birth weight (Table V), demonstrating that giving nutritional anions to dairy cows in late gestation had no impact on colostrum supply or IgG. Other studies have reached the same result as we have ; ; ; . Lowering DCAD of prepartum meals from about +130 to -130 mEq/kg DM had no effect on the yield or quality of colostrum . This is consistent with the findings of Weich et al. (2013), who observed no differences in birth weight between calves from cows fed a diet containing -160 mEq/kg DM (41.1 kg) and calves fed +120 mEq/kg DM (41.1 kg) (44.6 kg).
CONCLUSIONS
Prepartum anionic diets raised hydroxyproline and lowered urine pH and parathyroid hormone, resulting in better Ca availability after parturition and Ca concentrations at normal levels on calving day. Calf birth weight, IgG, and colostrum yield were unaffected by cows given a negative DCAD approach (-100 and -180 mEq/kg DM). Postpartum blood metabolites were unaffected in cows given positive DCAD (+250 and +350 mEq/kg DM).
ACKNOWLEDGEMENTS
The authors express their gratitude to everyone who assisted in the care of the cows in the experiment.
Statement of conflict of interest
The authors have declared no conflict of interest.
Figures
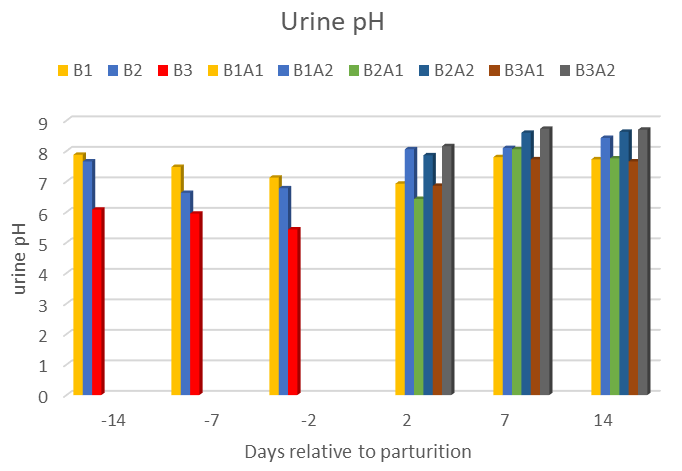
Urine pH (Means±SE) for cows fed prepartum DCAD (Tr1) 0.0, -100, -180 (BC1, BC2, BC3) and postpartum DCAD (Tr2) +250 and +350 (AC1, AC2) showing effect of interaction (BC1AC1, BC1AC2, BC2AC1, BC2AC2, BC3AC1, BC3AC2), there is effect of prepartum DCAD (Tr1) between means for cows fed 0.0, -100, -180 (7.5, 7.02 and 5.82), P < 0.005, there is effect of time sample -2, -7 ( 6.45 and 6.68) and -14 (7.21) P < 0.05 and the interaction Tr1 x T, P = 0.247. postpartum there is effect of treatment Tr2 x T time of sample at 14, 7 urine pH (8.15 and 8.17), 2 days after calving pH (7.38), P> 0.05, also there is interaction after calving Tr1 x T time of sample p. 0.05 but there is no interaction after calving from Tr1 x Tr2 x T, P = 0.690.
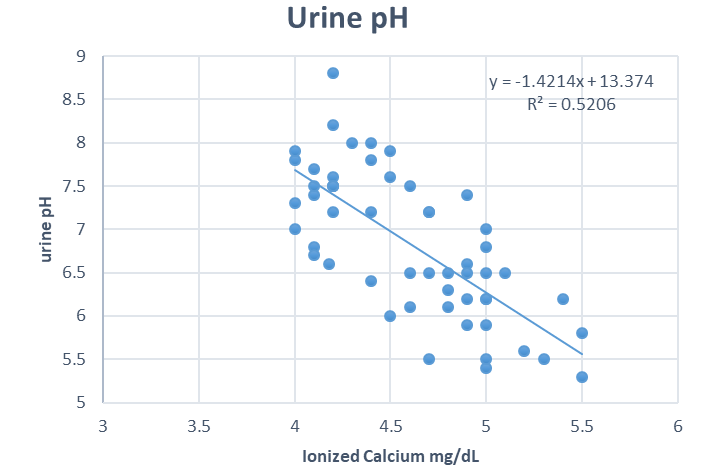
Simple linear regression and negative linear correlation between urine pH and iCa (R = -0.74, R2 = 0.548) urine pH = (14.2 + -1.61*iCa) for cows fed prepartum (Tr1) DCAD (0.0, -100, -180) there is negative linear relationship urine pH and iCa p < 0.05.
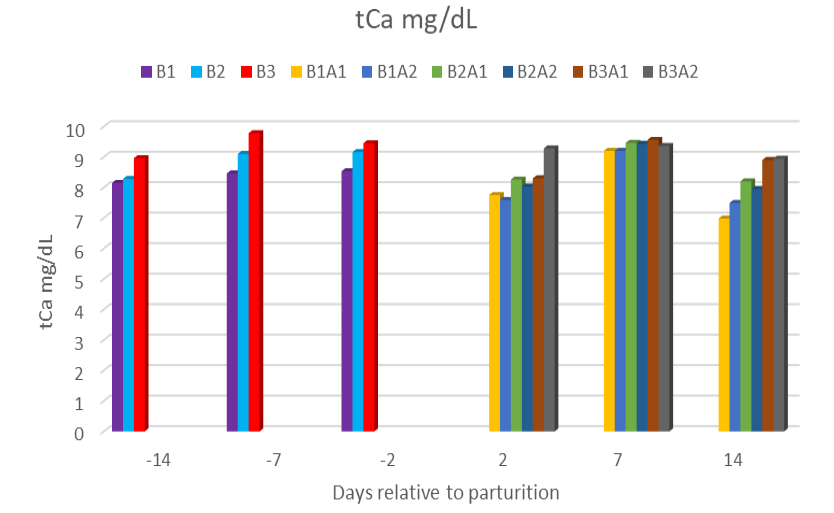
Means of tCa concentrations for cows fed prepartum and effect of (Tr1) DCAD 0.0, -100, -180 (BC1, BC2, BC3. P < 0.001) and effect of postpartum (Tr2) DCAD +250 and +350 (B1A1, B1A2, B2A1, B2A2, B3A1, B3A2. P = 0.511), day P < 0.001 and interaction Tr1 x Tr2 x day P = 0.086, during experimental period.
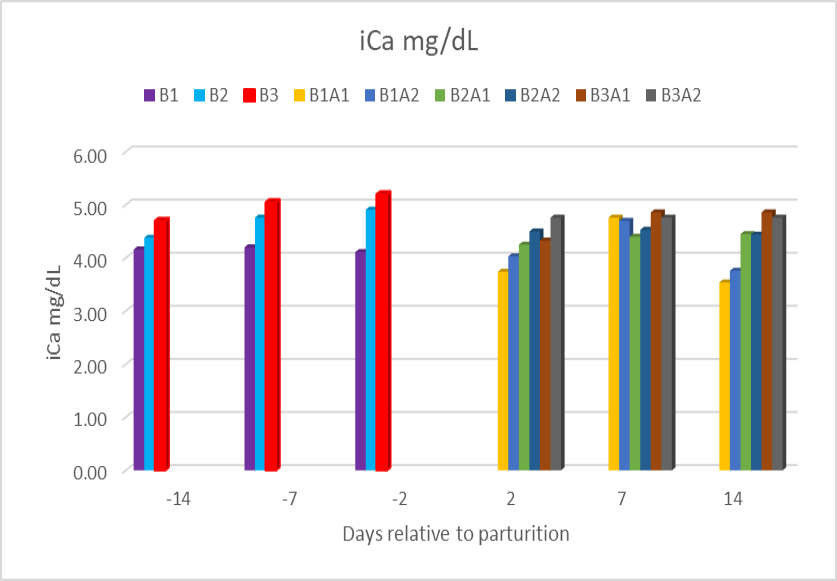
Means serum iCa concentrations for cows fed prepartum and effect of Tr1 DCAD 0.0, -100, -180 (BC1, BC2, BC3. P < 0.001) and effect of postpartum Tr2 DCAD +250 and +350 (B1A1, B1A2, B2A1, B2A2, B3A1, B3A2. P = 0.511), day P < 0.001 and interaction Tr1 x Tr2 x day P = 0.510, during experimental period.
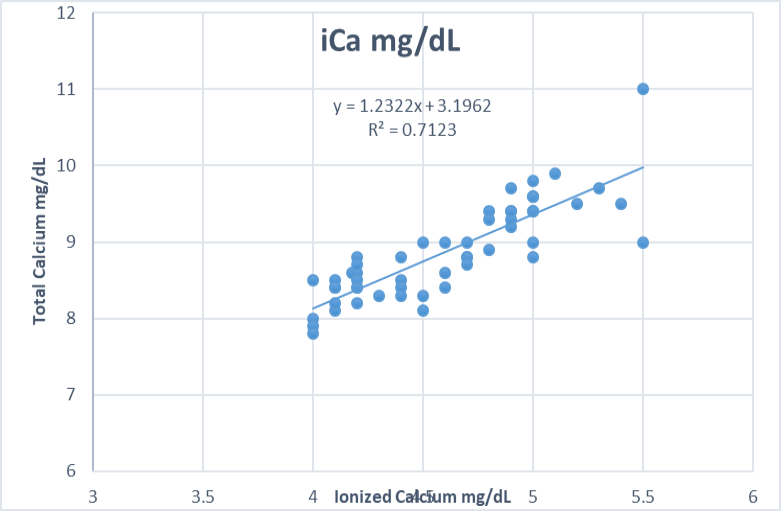
Simple linear regression and positive correlation between tCa and iCa (R = 0.84, R2 = 0.712 P < 0.001) tCa = 3.2 + 1.23*iCa for cows fed prepartum (Tr1) DCAD (0.0, -100, -180) there is positive linear relationship tCa and iCa p < 0.05.
References
- Abu Damir, H., Phillippo, M., Thorp, B.H., Milne, J.S., Dick, L., and Nevison, I.M., 1994. Effects of dietary acidity on calcium balance and mobilization, bone morphology, and 1, 25 dihydroxyvitamin D in prepartal dairy cows. Res. Vet. Sci., 56: 310–318. https://doi.org/10.1016/0034-5288(94)90147-3[CrossRef]
- AOAC International, 2000. Official methods of analysis, 17th ed. Assoc. Off. Anal. Chem., Gaithersburg, MD.
- Crenshaw, T.D., Rortvedt, L.A., and Hassen, Z., 2011. Triennial growth symposium: A novel pathway for vitamin D-mediated phosphate homeostasis: Implications for skeleton growth and mineralization. J. Anim. Sci., 89: 1957–1964. https://doi.org/10.2527/jas.2010-3411[CrossRef]
- Diehl, A.L., Bernard, J.K., Tao, S., Smith, T.N., Marins, T., Kirk, D.J., McLean, D.J., and Chapman, J.D., 2018. Short communication: Blood mineral and gas concentrations of calves born to cows fed prepartum diets differing in dietary cation-anion difference and calcium concentration. J. Dairy Sci., 101: 9048–9051. https://doi.org/10.3168/jds.2018-14829[CrossRef]
- Goff, J.P., Liesegang, A., and Horst, R.L., 2014. Died-induced pseudo-hypoparathyroidism: A hypocalcemia and milk fever risk factor. J. Dairy Sci., 97: 1520–1528. https://doi.org/10.3168/jds.2013-7467[CrossRef]
- Goff, J.P., and Koszewski, N.J., 2018. Comparison of 0.46% calcium diets with and without added anions with a 0.7% calcium anionic diet as a means to reduce periparturient hypocalcemia. J. Dairy Sci., 101: 5033–5045. https://doi.org/10.3168/jds.2017-13832[CrossRef]
- Goff, J.P., Horst, R.L., Mueller, F.J., Miller, J.K., Kiess, G.A., and Dowlen, H.H., 1991. Addition of chloride to a prepartal diet high in cations increases 1,25-dihydroxyvitamin D response to hypocalcemia preventing milk fever. J. Dairy Sci., 74: 3863–3871. https://doi.org/10.3168/jds.S0022-0302(91)78579-2[CrossRef]
- Goff, J.P., Reinhardt, T.A., and Horst, R.L., 1989. Recurring hypocalcemia of bovine parturient paresis is associated with failure to produce 1,25-dihydroxyvitamin D. Endocrinology, 125: 49–53. https://doi.org/10.1210/endo-125-1-49[CrossRef]
- Grünberg, W., Donkin, S.S., and Constable, P.D., 2011. Periparturient effects of feeding a low dietary cation-anion difference diet on acid- base, calcium, and phosphorous homeostasis and on intravenous glucose tolerance test in high-producing dairy cows. J. Dairy Sci., 94: 727–745. https://doi.org/10.3168/jds.2010-3230[CrossRef]
- Horst, R.L., Goff, J.P., Reinhardt, T.A., and Buxton, D.R., 1997. Strategies for preventing milk fever in dairy cattle. J. Dairy Sci., 80: 1269–1280. https://doi.org/10.3168/jds.S0022-0302(97)76056-9[CrossRef]
- Jonsson, G., Pehrson, B., Lundstrom, K., Edqvist, L.E., and Blum, J.W., 1980. Studies on the effect of the amount of calcium in the prepartum diet on blood levels of calcium, magnesium, inorganic phosphorus, parathyroid hormone and hydroxyproline in milk fever prone cows. Zbl. Vet. Med. A., 27: 173–185. https://doi.org/10.1111/j.1439-0442.1980.tb01686.x[CrossRef]
- Leno, B.M., Ryan, C.M., Stokol, T., Kirk, D., Zanzalari, K.P., Chapman, J.D., and Overton, T.R., 2017. Effects of prepartum dietary cation-anion difference on aspects of peripartum mineral and energy metabolism and performance of multiparous Holstein cows. J. Dairy Sci., 100: 4604–4622. https://doi.org/10.3168/jds.2016-12221[CrossRef]
- Liesegang, A., Chiappi, C., Risteli, J., Kessler, J., and Hess, H.D., 2007. Influence of different calcium contents in diets supplemented with anionic salts on bone metabolism in periparturient dairy cows. J. Anim. Physiol. Anim. Nutr. (Berl.), 91: 120–129. https://doi.org/10.1111/j.1439-0396.2006.00651.x[CrossRef]
- Lopera, C., Zimpel, R., Vieira-Neto, A., Lopes, F.R., Ortiz, W., Poindexter, M., Faria, B.N., Gambarini, M.L., Block, E., Nelson, C.D. and Santos, J.E.P., 2018. Effects of level of dietary cation-anion difference and duration of prepartum feeding on performance and metabolism of dairy cows. J. Dairy Sci., 101: 7907–7929. https://doi.org/10.3168/jds.2018-14580[CrossRef]
- Martinez, N., Rodney, R.M., Block, E., Hernandez, L.L., Nelson, C.D., Lean, I.J., and Santos, J.E.P., 2018. Effects of prepartum dietary cation-anion difference and source of vitamin D in dairy cows: Lactation performance and energy metabolism. J. Dairy Sci., 101: 2544–2562. https://doi.org/10.3168/jds.2017-13739[CrossRef]
- Megahed, A.A., Hiew, M.W.H., El-Badawy, S.A., and Constable, P.D., 2018. Plasma calcium concentrations are decreased at least 9 h before parturition in multiparous Holstein-Friesian cattle in a herd fed an acidogenic diet during late gestation. J. Dairy Sci., 101: 1365–1378. https://doi.org/10.3168/jds.2017-13376[CrossRef]
- Mertens D.R., 1997. Creating a system for meeting the fiber requirements of dairy cows. J. Dairy Sci., 80: 1463-1481. https://doi.org/10.3168/jds.S0022-0302(97)76075-2[CrossRef]
- Moore, S.J., Vande-Haar, M.J., Sharma, B.K., Pilbeam, T.E., Beede, D.K., Bucholtz, H.F., Liesman, J.S., Horst, R.L., and Goff, J.P., 2000. Effects of altering dietary cation-anion difference on calcium and energy metabolism in peripartum cows. J. Dairy Sci., 83: 2095–2104. https://doi.org/10.3168/jds.S0022-0302(00)75091-0[CrossRef]
- NRC, 2001. Nutrient requirements of dairy cattle. 7th Rev. ed. Natl. Acad. Press, Washington, DC.
- Rodriguez, E.M., Bach, A., Devant, M., and Aris, A., 2016. Is calcitonin an active hormone in the onset and prevention of hypocalcemia in dairy cattle? J. Dairy Sci., 99: 3023–3030. https://doi.org/10.3168/jds.2015-10229[CrossRef]
- Romo, G.A., Kellems, R.O., Powell, K., and Wallentine, M.V., 1991. Some blood minerals and hormones in cows fed variable mineral levels and ionic balance. J. Dairy Sci., 74: 3068–3077. https://doi.org/10.3168/jds.S0022-0302(91)78492-0[CrossRef]
- Santos, J.E.P., Lean, I.J., Golder, H., and Block, E., 2019. Meta-analysis of the effects of prepartum dietary cation-anion difference on performance and health of dairy cows. J. Dairy Sci., 102: 2134–2154. https://doi.org/10.3168/jds.2018-14628[CrossRef]
- Van-Soest, P.J., Robertson, J.B., and Lewis, B.A., 1991. Methods for dietary fiber, neutral detergent fiber, and nonstarch polysaccharides in relation to animal nutrition. J. Dairy Sci., 74: 3583–3597. https://doi.org/10.3168/jds.S0022-0302(91)78551-2[CrossRef]
- Weich, W., Block, E., and Litherland, N.B., 2013. Extended negative dietary cation-anion difference feeding does not negatively affect postpartum performance of multiparous dairy cows. J. Dairy Sci., 96: 5780-5792. https://doi.org/10.3168/jds.2012-6479[CrossRef]
Services
Article usage statistics
Loading…