
This study describes the spatial and temporal distribution characteristics of Oncomelania hupensis a tropical freshwater snail in mainland China from 2011 to 2020. It assesses the impact of factors, including newfound snail distribution area, eliminated snail area, and population in the snail region. Data on O. hupensis distribution was downloaded from the internet, and both section data and panel data were constructed. We used a spatial matrix to investigate the spatial aggregation and autocorrelation of the O. hupensis distribution area. Moran’s I and local Moran’s I values were applied as the two indices. The spatial durbin model (SDM) with a time fixed effect was employed to explore the correlation between the natural distribution area and the other factors. LM test was used to distinguish the best-fit model. LR and Hausman tests were conducted as robust tests, and an effect test was also performed. The distribution area of O. hupensis decreased from 2011 to 2020 and showed spatial aggregation and autocorrelation. The SDM revealed that eliminating snail areas had a positive main effect and a positive spill-out effect on the actual distribution of O. hupensis. The decomposition of the effect showed that the elimination area had a positive total effect on the actual distribution through positive direct and indirect methods. The snail elimination program effectively decreased the actual distribution of O. hupensis, which might also be an efficient way to prevent and control the disease transmitted by O. hupensis, Schistosomiasis.
Short Communication · Volume 57, Issue 6, 15 November 2025 · Open Access
Geographical Spatial Distribution of a Tropical Freshwater Snail, Oncomelania hupensis and Influencing Factors on its Distribution
· · · ·
Affiliations & Notes ⌄
- 1Internal Medicine Department, Shushan Geriatric Hospital (East Branch of Huzhou Central Hospital) and School of Medicine, Huzhou University, 759 Erhuan Rd, Huzhou, Zhejiang, Peoples Republic of China 2Key Laboratory of Vector Biology and Pathogen Control of Zhejiang Province, Huzhou University, Huzhou, Zhejiang, Peoples Republic of China * Corresponding author: guoyue88@126.com
Article Info ⌄
- Journal:
- Pakistan Journal of Zoology
- Published:
- 15 November 2025

From the article
- Local Moran’s I indicated that there were 2 clusters of distribution: A high-high cluster in the first quartile and a low-low cluster in the third quartile.
- In this study, we utilized Moran’s I value and local Moran’s I value to determine the spatial aggregation and autocorrelation of O. hupensis distribution area in Anhui, Hubei, Hunan, Jiangsu, Jiangxi, Sichuan, and Yunnan during 2001-2020.
- Results indicated that the distribution of O. hupensis exhibited spatial aggregation, with high-high clusters observed in Hunan, Jiangxi, and Hubei, which are also the largest endemic regions of Schistosomiasis in China.
- However, the newfound snail distribution area showed no correlation with the real distribution of O. hupensis.
Selected from the article's own text.
Abstract
Materials and Methods
The data used in this study were accessed through internet databases . The data on O. hupensis distribution included the actual distribution area, newfound distribution, eliminated distribution, and human population in the snail location. These data were obtained from the Chinese Health Yearbook and the Annual Report on Schistosomiasis Control in China. We focused our study on Anhui, Hubei, Hunan, Jiangsu, Jiangxi, Sichuan, and Yunnan from 2011 to 2020.
A spatial matrix of 01 was used in this study, where 0 represents no bordering with each other, and 1 refers to bordering with each other. The spatial aggregation and autocorrelation were analyzed on section data of O. hupensis real distribution by the 01 spatial matrix. The impact of factors on O. hupensis accurate distribution was obtained on the panel data using the same spatial matrix. Spatial aggregation was measured by global Moran’s I. Evaluation indices for spatial autocorrelation were local Moran’s I values. The models used in this study included the spatial durbin model (SDM), spatial error model (SEM), and spatial lag model (SLM). The LM, robust, and effect tests determined the best-fit model. The LM test determined the best-fit model among the three models. If the best-fit model was SDM, the robust test was used to determine if the SDM would return to SEM or SLM. The effect test was used to ensure the model was random or fixed effect, time, individual, or both.
Data downloaded online was edited in Excel (Microsoft Office 2016). GraphPad Prism 10 generated the overall trends for the actual distribution area, newfound area, and eliminated area of O. hupensis. ArcGIS generated the map of the average distribution. Figures were also edited using GraphPad Prism 10. Stata was used to analyze spatial and temporal distribution characteristics.
Results
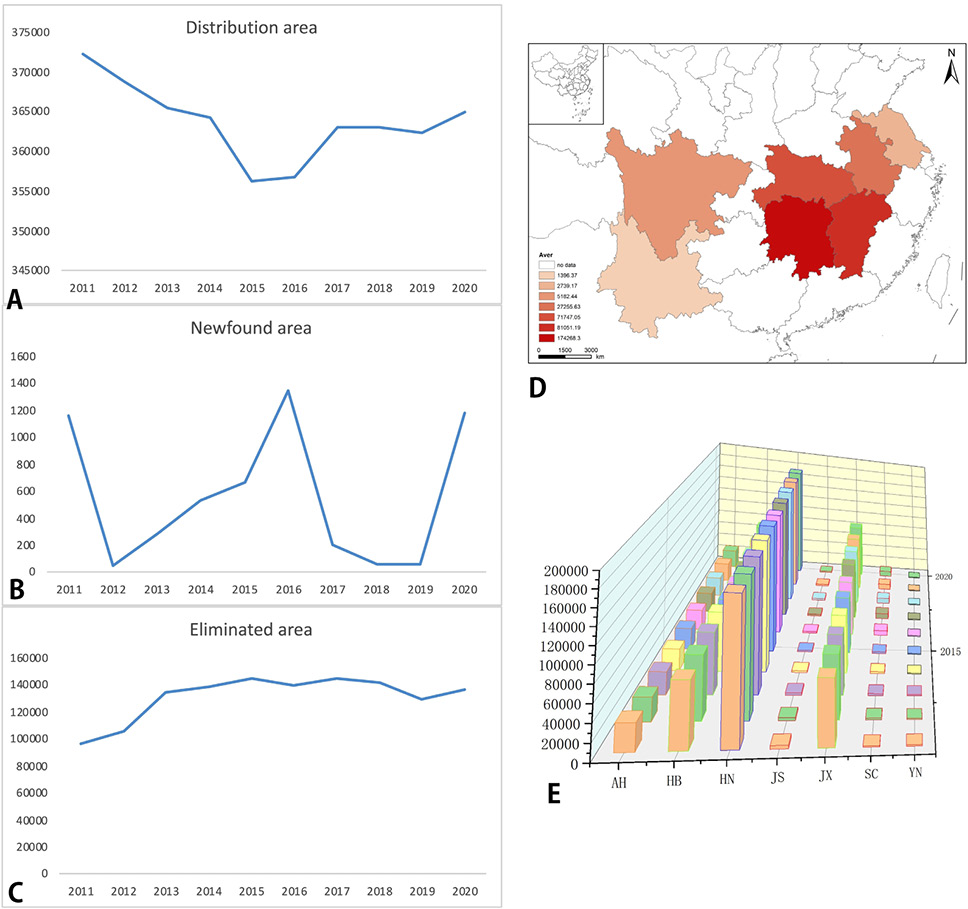
Figure 1 shows distribution, newfound and eliminated areas of overall distribution of O. hupensis in mainland China. The distribution area of its snails decreased continuously while eliminated area of O. hupensis declined continuously and slowly in the mainland China during 2011-2020. The rise and fall of Newfound area is shown Figure 1B.
At the provincial level, the largest distribution area was, followed by in Figure 1A, C. The average distribution area of HN among 2011-2020 was 174 268 m2.
Table I shows the distribution area exhibited spatial aggregation from 2011 to 2020 (Moran’s I value > 0, p-value < 0.05). The highest spatial aggregation occurred in 2011, and the lowest was in 2016. Local Moran’s I indicated that there were 2 clusters of distribution: A high-high cluster in the first quartile and a low-low cluster in the third quartile. The high-high cluster included Hunan, Jiangxi, and Hubei. Local Moran’s I changed minimally, but the overall spatial autocorrelation was essentially similar. The high-high cluster remained consistent in each year (Fig. 2).
Table I. Spatial aggregation of real distribution of O. hupensis during 2011-2020.
| Moran's I | z value | p value | |
| 2011 | 0.474 | 2.034 | 0.021 |
| 2012 | 0.475 | 2.032 | 0.021 |
| 2013 | 0.468 | 2.027 | 0.021 |
| 2014 | 0.464 | 2.021 | 0.022 |
| 2015 | 0.437 | 1.998 | 0.023 |
| 2016 | 0.435 | 1.985 | 0.024 |
| 2017 | 0.446 | 1.977 | 0.024 |
| 2018 | 0.444 | 1.974 | 0.024 |
| 2019 | 0.442 | 1.969 | 0.024 |
| 2020 | 0.458 | 1.984 | 0.024 |
Table II. LM test result.
| Spatial error | Statistic | p value | |
| Moran's I | 6.07 | 0.000 | |
| Lagrange multiplier | 31.743 | 0.000 | |
| Robust lagrange multiplier | 1.792 | 0.181 | |
| Spatial lag | |||
| Lagrange multiplier | 30.122 | 0.000 | |
| Robust lagrange multiplier | 0.172 | 0.679 | |
Table III. Results of robust and effect test.
| x2 value | p value | ||
| Robust test | SLM vs.SDM | 71.98 | <0.05 |
| SEM vs.SDM | 78.84 | <0.05 | |
| Hausman test | 35.02 | <0.05 | |
| Effect test | Lr-test both vs. ind | 6.91 | 0.73 |
| Lr-test both vs. time | 379.55 | 0.00 |
The LM test result indicated a statistically significant difference between SEM and SLM; therefore, we chose SDM for this study (Table II). Table III shows robust test results indicating that SDM could not be simplified to SLM or SEM. The Hausman test result demonstrated that the fixed model fit better than the random model. The LR effect test further indicated that the time-fixed effect should be used. Thus, the time-fixed effect of SDM was utilized for this study. The coefficient value in the main effect indicated that the area of eliminated O. hupensis location and the population in the snail area had positive effects on the distribution of O. hupensis, both with statistically significant differences. Spatial autoregression showed spatial conduction and was measured by the Wx value. The area of eliminated O. hupensis location and population in the snail area exhibited spatial spillover effects on the distribution of O. hupensis; the snail elimination area had a positive spatial spillover effect, while the population showed a negative spatial spillover effect (Table IV).
Analyzing the direct, indirect, and total effects of spatial lag explanatory variables revealed that the elimination area had a total effect on the actual distribution area of O. hupensis. The decomposition of the total effect showed that the elimination area had both direct and indirect effects on the distribution area of O. hupensis, both statistically significant. The population in the snail area had only a statistically significant direct effect (Table V).
Table IV. Result of SDM.
| Coefficient | p value | 95% conf. interval | |
| Main effect | |||
| x1 | -2.44 | 0.89 | -33.51~28.63 |
| x2 | 1.86 | <0.05 | 1.03~2.69 |
| x3 | 105.36 | <0.05 | 65.65~145.07 |
| Wx effect | |||
| x1 | 22.5 | 0.266 | -17.18~62.19 |
| x2 | 11.59 | <0.05 | 9.33~13.83 |
| x3 | -78.28 | <0.05 | -119.43~-37.13 |
x1: newfound area with O. hupensis distribution; x2: area eliminated with O.hupensis; x3: population in area with O. hupensis
Table V. Effect decomposition of the influencing factors on O. hupensis distribution.
| Coefficient | p value | |
| LR_Direct | ||
| x1 | 2.02 | 0.92 |
| x2 | 4.16 | <0.05 |
| x3 | 98.3 | <0.05 |
| LR_Indirect | ||
| x1 | 26.63 | 0.32 |
| x2 | 15.08 | <0.05 |
| x3 | -58.52 | 0.03 |
| LR_Total | ||
| x1 | 28.65 | 0.49 |
| x2 | 19.23 | <0.05 |
| x3 | 39.77 | 0.36 |
Discussion
In this study, we utilized Moran’s I value and local Moran’s I value to determine the spatial aggregation and autocorrelation of O. hupensis distribution area in Anhui, Hubei, Hunan, Jiangsu, Jiangxi, Sichuan, and Yunnan during 2001-2020. Results indicated that the distribution of O. hupensis exhibited spatial aggregation, with high-high clusters observed in Hunan, Jiangxi, and Hubei, which are also the largest endemic regions of Schistosomiasis in China. Jiangxi and Hunan boast the first and second largest freshwater lakes in China ; , respectively, while Hubei is renowned for its numerous lakes, providing ample habitat for freshwater snails ; . Consequently, these three provinces demonstrated the most extensive distribution of O. hupensis.
Previous research has also highlighted these provinces as the most severe endemic regions of Schistosomiasis. Therefore, rigorous prevention and control programs are imperative in these provinces.
Snail elimination has been an essential tool for Schistosomiasis prevention and control for many decades. Here, we found that the elimination area critically influenced the actual distribution of O. hupensis, with a positive main effect, positive spill-out effect, and a positive total effect. The population in endemic regions also showed a positive main effect and negative spill-out effects on the actual distribution of O. hupensis. However, the newfound snail distribution area showed no correlation with the real distribution of O. hupensis. Theoretically, the snail elimination area and population size in these regions should be negatively correlated with the actual distribution, while the newfound snail distribution should positively correlate with the actual distribution of O. hupensis. However, the theory contradicted the field reality while may be because schistosomiasis has been effectively controlled and prevented in China over the past decades, primarily through snail elimination, chemotherapy of patients, and positive animals ; . The elimination area has expanded over time, but enlarging it has become increasingly challenging in recent years. Concurrently, the rise and decline of newfound snail areas indicate the difficulty in identifying new habitat areas for O. hupensis. Furthermore, this study was conducted at the provincial level, and the correlation between accurate snail distribution and newfound snail areas, elimination areas, and local populations might be closer to the theoretical expectations at the county or village level. Therefore, a more detailed survey at lower administrative levels is warranted.
Thirdly, various other factors may also impact the distribution of O. hupensis snails, including floods, land use changes such as returning farmland to grassland, and local water conservancy projects ; . While significant progress has been made in the past decades, studies suggest that there is still a long way to go in eliminating Schistosomiasis in China. Moreover, recent factors have complicated the distribution of O. hupensis, indicating the need to discover and include more factors in future studies. Nonetheless, snail elimination remains an effective strategy for disease control and prevention, especially in provinces like Hunan, Jiangxi, and Hubei.
In summary, while Schistosomiasis is likely to be eliminated in China in the near future, the distribution area of O. hupensis is currently confined to some historical natural habitats. Spatial aggregation and autocorrelation may persist for a long time, underscoring the importance of continuing efforts to eliminate snails as a strategy for preventing and controlling Schistosomiasis.
Statement of conflict of interest
The authors have declared no conflict of interest.
Figures
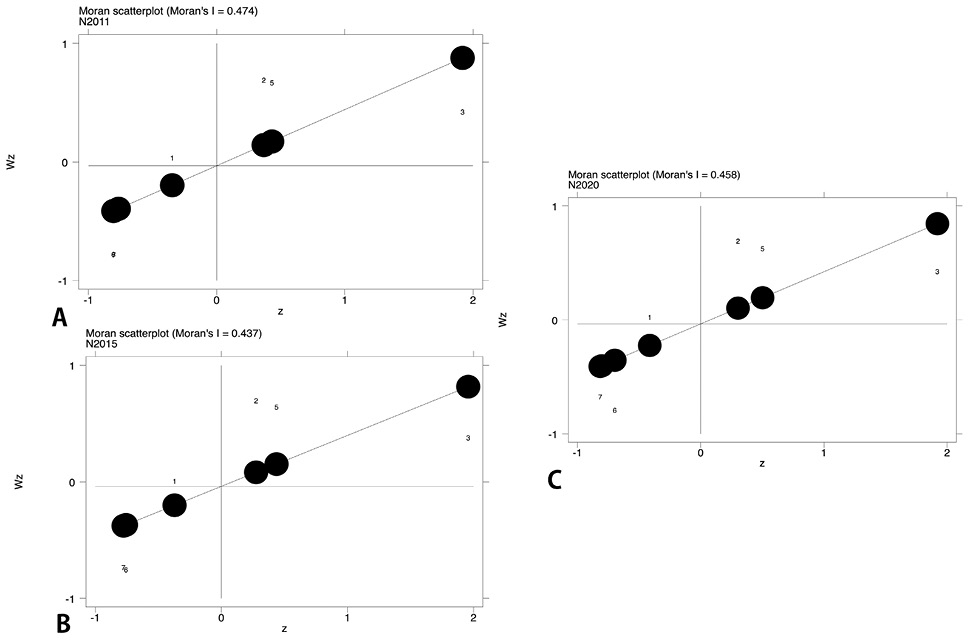
Local Moran’s I value for real distribution of O.hupensis. A) local Moran’s I value in 2011, B) local Moran’s I value in 2015 and C) local Moran’s I value in 2020.
References
- Alene, K. A., Gordon, C.A., Clements, A.C.A., Williams, G.M., Gray, D.J., Zhou, X.N. and McManus, D.P., 2022. Diseases, 10. https://doi.org/10.3390/diseases10040093[CrossRef]
- Barnett, R., 2018. Lancet, 392: 2431. https://doi.org/10.1016/S0140-6736(18)33008-3[CrossRef]
- Cao, C.L., Zhang, L.J., Deng, W.P., Li, Y.L., Lv, C., Dai, S.M. and Zhou, X.N., 2020. Adv. Parasitol., 110: 1-62. https://doi.org/10.1016/bs.apar.2020.04.002[CrossRef]
- Chen, S., Lu, D., Duan, L., Ma, B., Lv, C., Li, Y.L. and Lv, S., 2022. Parasit. Vectors, 15: 363. https://doi.org/10.1186/s13071-022-05496-0[CrossRef]
- Chen, Y.Y., Liu, J.B., Jiang, Y., Li, G., Shan, X.W., Zhang, J. and Huang, X.B., 2018. Acta Trop., 180: 88-96. https://doi.org/10.1016/j.actatropica.2018.01.004[CrossRef]
- Anonymous, 2020. Lancet, 396: 1204-1222.
- Gordon, C.A., Williams, G.M., Gray, D.J., Clements, A.C.A., Zhou, X.N., Li, Y. and McManus, D.P., 2022. Parasitology, 149: 218-233. https://doi.org/10.1017/S0031182021001724[CrossRef]
- Jiang, H., Zhou, J., Xia, M., Li, G., Di, J., Mao, F. and Zhou, Y., 2023. Infect. Dis. Poverty, 12: 4. https://doi.org/10.1186/s40249-023-01053-8[CrossRef]
- Li, K., Li, Z., Li, A., Zeng, Z., Jiang, X., Shahzad, M. and Li, J., 2020. Travel. Med. Infect. Dis., 36: 101598. https://doi.org/10.1016/j.tmaid.2020.101598[CrossRef]
- Li, Y., Guo, S., Dang, H., Zhang, L., Xu, J. and Li, S. 2023. Trop. Med. Infect. Dis., 8.
- McManus, D.P., Bergquist, R., Cai, P., Ranasinghe, S., Tebeje, B.M., and You, H., 2020. Semin. Immunopathol., 42: 355-371. https://doi.org/10.1007/s00281-020-00789-x[CrossRef]
- Molehin, A.J., 2020. J. Biomed. Sci., 27: 28. https://doi.org/10.1186/s12929-020-0621-y[CrossRef]
- Wang, Z., Liu, L., Shi, L., Wang, X., Zhang, J., Li, W. and Yang, K. 2022. Pathogens, 11. https://doi.org/10.3390/pathogens11090970[CrossRef]
- Xu, N., Zhang, Y., Du, C., Song, J., Huang, J., Gong, Y. and Zhou, Y., 2023. Parasit. Vectors, 16: 377. https://doi.org/10.1186/s13071-023-05952-5[CrossRef]
- Yang, Y., Zhou, Y.B., Song, X.X., Li, S.Z., Zhong, B., Wang, T.P. and Jiang, Q.W., 2016. Adv. Parasitol., 92: 237-268. https://doi.org/10.1016/bs.apar.2016.02.004[CrossRef]
- Zhou, L., 2023. Parasitol. Res., 122: 2457-2465. https://doi.org/10.1007/s00436-023-07966-5[CrossRef]
- Zhu, H., Liu, J.B., Xiao, Y., Tu, Z.W., Shan, X.W., Li, B. and Huang, X.B., 2022. Acta Trop., 231: 106417. https://doi.org/10.1016/j.actatropica.2022.106417[CrossRef]
Services
Article usage statistics
Loading…