
The aim of the present study was to perform genetic diversity and population structure estimation on 382 individuals from seven Chinese Tibetan ecotype yak population using twenty-one microsatellites. The results revealed that the HO ranged from 0.4854±0.0194 in NNV to 0.6086±0.0267 in YRY, and the NA ranged from 3.86±1.98 in XMY to 6.05±3.37 in NNV. The least number of markers which deviated from Hardy-Weinberg equilibrium within the population was W, and largest number of deviations was in the NNV population. Consistent of phylogenetic relationships between the seven populations was identified by Phylogenetic N-J network (Reynold’s genetic distance), FST and Principal components factor (PCA) analysis. These analyses inferred that the population cluster data was not only consistent with the populations’ geographic habits but could also be influenced by artificial selection and feeding style. Lastly, two credible genetic backgrounds were identified from the yak populations in this study using STRUCTURE software, which corresponded to previous knowledge about different molecular genetic markers. Therefore, unexpectedly, our study indicated that the diversity of some of the populations was decreased, leaving us to improve and refine our conversional strategy. In addition, this resulted in a greater understanding of human yak phylogenetic differentiation as well as providing data support for understanding the evolution and migration of yak population in future studies.
Short Communication · Volume 51, Issue 5, 6 August 2019 · Open Access
Genetic Diversity and Population Structure of Seven Tibet Yak Ecotype Populations using Microsatellite Markers
· · · · · · ·
Affiliations & Notes ⌄
- 1Institute of Animal Husbandryand Veterinary Medicine, Tibet Academy of Agriculture and Animal Husandry Science, Lhasa, 850009, China 2State Key Laboratory of Barley and Yak Germplasm Resources and Genetic Improvement (Tibet Academy of Agricultural and Animal Husbandry Sciences (TAAAS)), Lhasa, 850002, China 3Chongqing Key Laboratory of Forage & Herbivore, Chongqing Engineering Research Centre for Herbivores Resource Protection and Utilization, College of Animal Science and Technology, Southwest
Article Info ⌄
- Journal:
- Pakistan Journal of Zoology
- Published:
- 6 August 2019

From the article
- Across populations, an average of 9.2 alleles of each marker were observed, ranging from 2 in BGR3001 to 21 in TGLA53.
- Our analysis not only indicated that most of the microsatellites which were used to estimate the diversity of yak populations would show high levels of polymorphism, but also indicated that the markers used in this study are qualified to represent the genetic diversity of these yak populations.
- The range of FIS within populations was from 0.153 in NNV to -0.059 in YRY population.
- Seven Chinese Tibetan ecotype populations were genotyped using 21 microsatellites.
Selected from the article's own text.
Abstract
Table I.- Original distribution and sample information for the seven Tibetan yak populations.
| Name | Code | SZ | N | E | Native Location |
| Xiama Population | XMY | 20 | 30°47′51.61″ | 92°40′36.28″ | Xiama No.3 villege, Jiali, Naqu |
| Jiali Population | JLY | 111 | 30°38′36.76″ | 93°13′51.74″ | Jiali Farm, Naqu |
| Neirong Farm Population | NRF | 61 | 32°06′36.73″ | 92°18′7.68″ | Neirong Farm, Neirong, Naqu |
| Neirong nine village Population | NNV | 47 | 31°44′44.43″ | 92°04′4.36″ | Nima No.9 Villege, Neirong, Naqu |
| Neirong eleven village Population | NEV | 59 | 31°44′46.32″ | 92°04′2.03″ | Nima No.11 Villege, Neirong, Naqu |
| Yare Population | YRY | 23 | 31°29′42.03″ | 82°19′59.05″ | Yare, Geji, Arli |
| Dangxiong Population | DXY | 61 | 30°31′39.23″ | 91°17′20.96″ | Longren, Dangxiong, Naqu |
SZ, Sample size; N, North latitude; E, East longitude and Code, short name of breed.
Naqu, and one from Ali region) using 21 microsatellite markers, and the evolution of their genetic divergence and population structure.
Material and methods
The experimental conditions used in this study were approved by the Committee on the Ethics of Animal Experiments of Southwest University (No. [2007] 3) and accordant with the Animal Protection Law of China. DNA of 382 individuals from seven Tibet yak populations (Table I) was extracted by a standard phenol-chloroform protocol from vein blood samples.
All individuals were genotyped at the 21 microsatellite markers (Supplementary Table I) as well as with genotyping being performed on a Genetic Analyzer 3130xl (Applied Biosystems, US), a detailed description of the genotyping can be found in E et al. (2018). Conventional genetic diversity parameters, including observed (Ho) heterozygosity, expected heterozygosity (HE), mean number of alleles (NA), and polymorphism information content (PIC), were estimated with the Microsatellite Toolkit (Park, 2008). Deviations of markers from Hardy-Weinberg equilibrium (HWE) within populations were identified using GENEPOP 3.4 software . The inbreeding coefficient (FIS) was estimated, and Fisher’s exact test with Bonferroni correction was performed using FSTAT 2.9.3.2 (Goudet, 1995). Pairwise differences between populations (FST) and loci under selection were identified using Arlequin software version 3.5.1.3 .
Principal components factor analysis (PCA) performed with R-Script. Bayesian clustering algorithm was implemented in STRUCTURE 2.3.3 ; with 50000 burn, and 100000 Markov Chain Monte Carlo (MCMC) in 100 iterations from K=1 to K=7. To estimate the most optimal K reference as deta K = m|L”(K)|/s|L(K)| by Structure Harvester (Earl and vonHoldt, 2012).
Results and discussion
In total, 193 alleles were identified in 7 local yak populations across 21 microsatellites. Across populations, an average of 9.2 alleles of each marker were observed, ranging from 2 in BGR3001 to 21 in TGLA53. The HO and HE of each marker within all individuals was 0.5239 (from 0.0304 (BGR3012) to 0.735 (CSRD247)) and 0.555 (from 0.034 (BGR3012) to 0.7986 (SPS115)), respectively. The mean PIC across markers was 0.4969 and ranged from 0.0323 (BGR3012) to 0.8091 (TGLA73) across populations (Supplementary Table II). Our analysis not only indicated that most of the microsatellites which were used to estimate the diversity of yak populations would show high levels of polymorphism, but also indicated that the markers used in this study are qualified to represent the genetic diversity of these yak populations.
Across markers, the HE within a breed ranged from 0.5333±0.0646 in XMY to 0.5832±0.0524 in YRY. The HO ranged from 0.4854±0.0194 in NNV to 0.6086±0.0267 in YRY, and the NA ranged from 3.86±1.98 in XMY to 6.05±3.37 in NNV (Table II). This indicated that those yak ecotype populations were still existing with a high level of diversity within the population.
Based on the Hardy-Weinberg equilibrium (HWE) analysis, nearly all markers in YRY populations were at HWE, expected BM2113. Only two markers deviated from HWE (dHWE) in B (BGR3004, ILSTS008), and DXY (BM2113, AGLA293) and other four populations exhibited 6 to 9 markers of dHWE. The range of FIS within populations was from 0.153 in NNV to -0.059 in YRY population. Three of these populations (JLY, NEV, NNV) had P-value for FIS considered significant at the adjusted nominal level (5%, P < 0.00034). According to the HWE and FIS results, inbreeding did not occur in DWY, YRY and XMY population. This indicates that the other four populations are under potential risk of becoming endangered. This should be a reminder to the government and management units involved that they should pay more attention to the protection of the genetic diversity in these populations and improve their current protection and conservation methods.
In addition, highest average number of pairwise differences within populations was observed in XMY
Table II.- Genetic diversity and pairwise differences of seven Tibet ecotype yak populations.
| Population genetic diversity | Pair-wise differences analysis | ||||||||||||
| Popul ation | HO (±SD) | HE (±SD) | NA (±SD) | FIS | P-Value | dH WE | XMY | JLY | NRF | NNV | NEV | YRY | DXY |
| XMY | 0.51± 0.03 | 0.53± 0.07 | 3.86± 1.98 | 0.04 | 0.17 | 2 | 1.49 | 1.46* | 1.57* | 1.43* | 1.60* | 1.59* | 1.57* |
| JLY | 0.51± 0.01 | 0.54± 0.06 | 5.76± 3.63 | 0.06 | 0.0003# | 8 | 0.09* | 1.23 | 1.32* | 1.22 | 1.34* | 1.32* | 1.31* |
| NRF | 0.51± 0.02 | 0.55± 0.06 | 4.95± 2.87 | 0.07 | 0.001 | 8 | 0.16* | 0.03* | 1.34 | 1.30* | 1.36 | 1.35 | 1.32 |
| NNV | 0.49± 0.02 | 0.57± 0.06 | 6.05± 3.37 | 0.15 | 0.0003# | 9 | 0.09* | 0.006 | 0.03* | 1.21 | 1.31* | 1.29* | 1.29* |
| NEV | 0.49± 0.02 | 0.56± 0.06 | 5.19± 3.14 | 0.11 | 0.0003# | 6 | 0.17* | 0.04* | 0.004 | 0.01* | 1.37 | 1.36 | 1.34 |
| YRY | 0.61± 0.03 | 0.58± 0.05 | 4.24± 2.21 | -0.06 | 0.78 | 1 | 0.19* | 0.04* | 0.01 | 0.03* | 0.02 | 1.32 | 1.33 |
| DXY | 0.54± 0.02 | 0.55± 0.06 | 4.95± 2.94 | 0.01 | 0.30 | 2 | 0.17* | 0.04* | -0.006 | 0.03* | 0.002 | 0.02 | 1.31 |
Pa, number of private alleles; dHWE, number of populations that deviated (P < 0.01) from Hardy-Weinberg equilibrium; #, indicates the adjusted nominal level (5%) for one table is 0.0006 based on 1680 randomizations of P-values for FIS.
(πX=1.48846) and the lowest was observed in NNV (πX=1.20773). The results of genetic divergence between populations (FST) based on corrected average pairwise differences (πXY-(πX+πY) and average number of pairwise differences between populations (πXY) indicated that the XMY population was carrying a higher divergence than the others (Table II, Fig. 1).
The genetic pattern of those populations from the phylogenetic Network tree can be seen in Figure 2A. The phylogenetic network revealed that XMY, and JLY population separated into Cluster I, which was easily understood being that the habitat of these three populations were around Jiali county. However, four populations, NRF, DXY, YRY, NEV population were separated into Cluster II, which was inconsistent with their geographic location, the YRY being from Ali region and others from the Naqu region of Tibet. In addition, the smaller sample size of this population (23, YRY) was not enough to present its correct population structure.
Regarding the genetic investigation of PCA (Fig. 2B) the investigation indicated that there could be a popular exchange of gene flow among those populations due to nomadic behavior, regular activity and human migration. Strangely, there are three populations NRF, NEV and NNV that had large divergences between each other. This could easily be caused by local artificial or cross breeding. What’s more, due to the high occurrence of irregular breedable livestock selection human intervention was a possible reason leading to inbreeding within this population which was revealed from FIS and dHWD in this study, this could also contribute to unreasonable population phylogenetic relationships within the populations.
Furthermore, we used STRUCTURE software to cluster the 7 Tibet ecotype populations into 2 ≤ K ≤7 (Fig. 2C). The result revealed that the most credible K value was 2 by ΔK = m| L” (K)|/s|L(K)|, which was consistent with current knowledge that there are two genetic backgrounds within Chinese yak with different molecular markers, such as mitochondrial DNA (e.g., , and Y –chromosome (e.g., .
Conclusion
Seven Chinese Tibetan ecotype populations were genotyped using 21 microsatellites. The results indicated that the current genetic diversity in some of these populations is decreasing and conservation strategies should be improved What’s more, the gene flow exchanged among those populations could be due to nomadic behavior and normal activity etc. Last but not least two divergence genetic backgrounds were identified in this study which further corroborates the current knowledge of human yak phylogenetic differentiation as well as provides data support for understanding the evolution and migration of yak populations in future studies.
Acknowledgements
This work was supported by National Technical System for Beef and Yak Industry (CARS-38), and the Open Project Program of State Key Laboratory of Barley and Yak Gemplasm Resources and Genetics Improvement (Tibet Academy of Agricultural and Animal Husbandry Sciences (TAAAS)), Lhasa Tibet 850002, China.
Conflict of interest
Authors declare no conflict of interest.
Supplementary material
There is supplementary material associated with this article. Access the material online at: http://dx.doi.org/10.17582/journal.pjz/2019.51.5.sc6
Figures
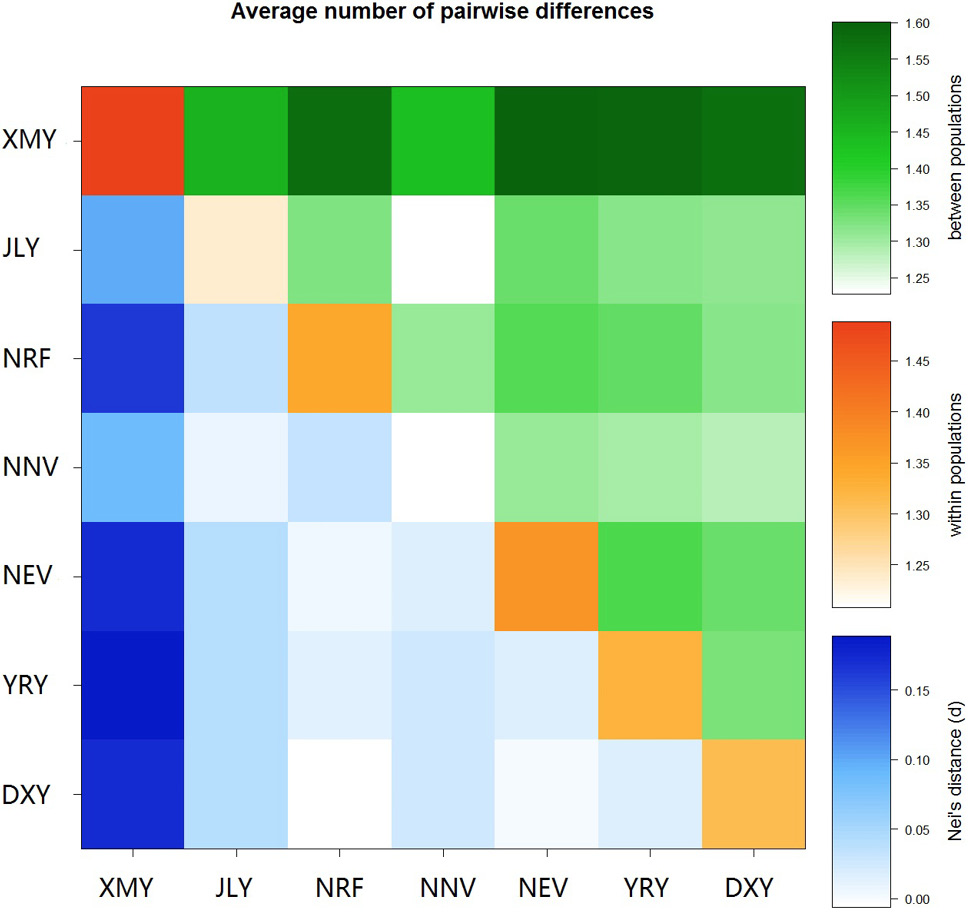
Pairwise differences analysis between seven yak populations. About pairwise differences analysis as (1) above diagonal: average number of pairwise differences between populations (πXY); (2) Diagonal elements: average number of pairwise differences within populations (πX); and (3) Below diagonal: corrected average pairwise differences (πXY-(πX+πY).
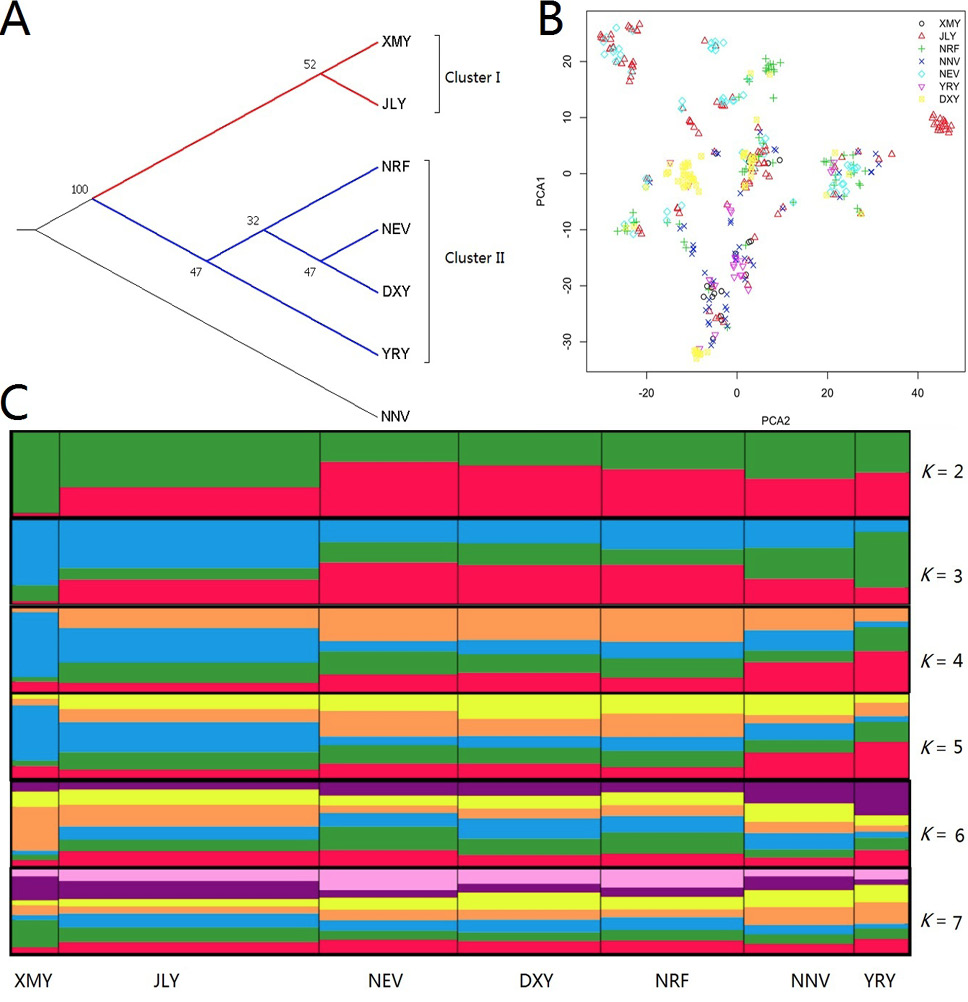
Phylogenetic population structure of seven Tibet local yak populations. A, Phylogenetic network of 7 yak populations by Reynold’s genetic distance; B, PCA pattern of 382 Tibet yak individuals from 7 populations; C, Cluster diagrams of 7 yak populations obtained using STRUCTURE.
References
- Basang, W.D., An, T.W., Danjiu, L.B., Zhu, Y.B., He, S.C., Luo, X.L., Ni, W.W., Wang, X., Cheng, S.Z., Wang, J. and E, G.X., 2018. Pakistan J. Zool., 50: 2051-2057. https://doi.org/10.17582/journal.pjz/2018.50.6.2051.2057[Full text][CrossRef]
- E, G.X., Zhao, Y.J., Chen, L.P., Ma, Y.H., Chu, M.X., Li, X.L., Hong, Q.H., Li, L.H., Guo, J.J., Zhu, L., Han, Y.G., Gao, H.J., Zhang, J.H., Jiang, H.Z., Jiang, C.D., Wang, G.F., Ren, H.X., Jin, M.L., Sun, Y.Z., Zhou, P. and Huang, Y.F., 2018. Ecol Evol., 8: 5111-5123.
- Earl, D.A. and vonHoldt, B.M., 2012. Conserv. Genet. Resour., 4: 359-361.
- Excoffier, L. and Lischer, H.E., 2010. Mol. Ecol. Resour., 10: 564-567. https://doi.org/10.1111/j.1755-0998.2010.02847.x[CrossRef]
- Falush, D., Stephens, M. and Pritchard, J.K., 2003. Genetics, 164: 1567–1587.Goudet, J., 1995. J. Hered., 86: 485-486.
- Felsenstein, J., 2005. PHYLIP (Phylogeny Inference Package) version 3.6 Distributed by the author. Department of Genome Sciences, University of Washington, Seattle.
- Kovach, W.L., and Services, K.C., 2004. MVSP- A multi-variate statistical package for Windows. ver 3.13m. http://www.kovcomp.co.uk/mvsp/index.html
- Lan, D., Xiong, X., Mipam, T.D., Fu, C., Li, Q., Ai, Y., Hou, D., Chai, Z., Zhong, J. and Li, J., 2018. G3 (Bethesda), 28:945-952. https://doi.org/10.1534/g3.118.300572[CrossRef]
- Ma, Z.J., Xia, X.T., Chen, S.M., Zhao, X.C., Zeng, L.L., Xie, Y.L., Chao, S.Y., Xu, J.T., Sun, Y.G., Li, R.Z., Guanque, Z.X., Han, J.L. and Lei, C.Z., 2018. Anim. Genet., 49:618-622.
- Ma, Z.J., Chen, S.M., Sun, Y.G., Xi, Y.L., Li, R.Z., Xu, J.T. and Lei, C.Z., 2015. Genet. mol. Res., 14:18859-62.
- Pei, J., Bao, P., Chu, M., Liang, C., Ding, X., Wang, H., Wu, X., Guo, X. and Yan, P., 2018. Peer J., 6: e5946. https://doi.org/10.7717/peerj.5946[CrossRef]
- Pritchard, J.K., Stephens, M. and Donnely, P., 2000. Genetics, 155: 945–959.
- Qiu, Q., Wang, L., Wang, K., Yang, Y., Ma, T., Wang, Z., Zhang, X., Ni, Z., Hou, F., Long, R., Abbott, R., Lenstra, J. and Liu, J., 2015. Nat. Commun., 22:10283.
- Raymond, M. and Rousset, F., 1995. Heredity, 86: 248-249. https://doi.org/10.1093/oxfordjournals.jhered.a111573[CrossRef]
- Song, Q.Q., Chai, Z.X., Xin, J.W., Zhao, S.J., Ji, Q.M., Zhang, C.F., Ma, Z.J. and Zhong, J.C., 2015. Genet. Mol. Res., 14:1763-70. https://doi.org/10.4238/2015.March.13.3[CrossRef]
- Zhang, G., Chen, W., Xue, M., Wang, Z., Chang, H., Han, X., Liao, X. and Wang, D.J., 2008. J. Genet. Genom., 35: 233-238.
Supplementary material
Services
Article usage statistics
Loading…