
Plectorhinchus orientalis and Plectorhinchus vittatus were two species of colorful coral reef sweetlips which distribute in the areas of Indo-Western Pacific. The two species have long been considered as a synonym (oriental sweetlips) in morphology. In order to investigate the validity of two species at the molecular level, complete mitochondrial genomes of the two species were first determined. The genomes were 16,546 bp (P. orientalis) and 16,545 bp (P. vittatus) in size, respectively, which both consisted of a typical structure of 13 protein-coding genes, 22 transfer RNA genes, 2 ribosomal RNA genes, and one noncoding control region. Genomic composition, organization and gene order were similar to that obtained in most vertebrates. By comparative analysis of the two genomes, 941 variable sites (5.69%) were found. Sequence divergences of 13 protein-coding genes, 2 rRNA genes and one control region which are commonly used as molecular markers between the two species ranged from 2.4% (12S rRNA) to 11.2% (ND6), all divergence values were larger than 2%. Great variations of Cyt b and COI between P. orientalis and P. vittatus were revealed to be 6.0% and 7.4%, respectively, which were largely greater than the threshold of species diagnosis divergence value of 2%. Inner individual divergence values of each species were less than 0.5%. In the molecular phylogenetic trees, the longer branch length also clearly distinguished the independent placement of the two species. These results revealed great genetic differences between P. orientalis and P. vittatus, and strongly suggested that they might be two distinct species and should not be placed as synonym.
Research Article · Volume 51, Issue 3, 19 March 2019 · Open Access
Complete Mitochondrial Genomes of Two Oriental Sweetlips, Plectorhinchus orientalis and Plectorhinchus vittatus (Perciformes: Haemulidae) with the Molecular Analysis on their Synonym Controversies
· · · · · ·
Affiliations & Notes ⌄
- 1College of Animal Technology, Zhongkai University of Agriculture and Engineering, Guangzhou, China , * Corresponding author: cheetahliang@126.com
Article Info ⌄
- Journal:
- Pakistan Journal of Zoology
- Published:
- 19 March 2019

From the article
- The mitochondrial genome of two synonyms debated species P. orientalis and P. vittatus were first determined in this study.
- The lengths of the two mitogenome are 16,546 bp and 16,545 bp, which both consist of 13 typical vertebrate protein-coding genes, 22 transfer RNA (tRNA) genes, 2 ribosomal RNA (rRNA) genes and one putative control region.
- All sequence divergences of 13 protein-coding genes, 2 rRNA genes and one control region which are commonly used as molecular markers between the two species are larger than the species diagnosis divergence value 2%.
- These results above reveal great genetic differences between P. orientalis and P. vittauts, and strongly suggest that they are two distinct species and should not be placed as synonyms.
Selected from the article's own text.
Abstract
Introduction
The vertebrate mitochondrial genome (mitogenome) is a small, double-stranded and circular DNA ranging in size from 15-20 kb. The structural gene organization is quite conserved within vertebrate mitogenome which contains 13 protein-coding genes, 2 ribosomal RNA genes (12S and 16S), 22 transfer RNA genes and one noncoding control region. In addition, mtDNA possesses two main non-coding regions involved in replication and transcription processes: the control region or D-loop and the light-strand replication origin or OL (Clayton, 1992; Shadel and Clayton, 1997; Boore, 1999). The mitochondrial DNA has been extensively used as a marker for molecular evolution, genetic diversity studies and phylogenetic analyses due to its compact size, maternal inheritance, rapid evolutionary rate and lack of recombination (Inoue et al., 2001; Miya et al., 2003; Saitoh et al., 2006; Kawahara et al., 2008). In fish, the mitogenome was first reported in freshwater loach (Crossostoma lacustre) by Tzeng et al. (1992). At the time of writing, complete mitogenomes from more than 472 species in Perciformes are available in NCBI database.
Family Haemulidae belongs to the suborder Percodei of order Perciformes, which comprised two subfamilies: Plectorhynchinae (sweetlips) and Haemulinae (grunts). Sweetlips are globally marine fish and mainly found in the oceanic waters of tropical, subtropical water along the Indo-Western Pacific. Most colorful sweetlips represent a drastic change in their external coloration appearance from juvenile to adult, which makes difficulties in species identification. Two oriental sweetlips Plectorhinchus orientalis (Bloch, 1793) and Plectorhinchus vittatus (Linnaeus, 1758) are common colorful sweetlips and mainly distributed in the areas of Indo-Western Pacific. P. vittatus has been widely known as P. orientalis (Satapoomin and Randall 2000), and most studies suggested P. orientalis and P. vittatus refer to the same species: Oriental sweetlips (McKay, 1984, 2001; Randall and Lim, 2000; Gillibrand et al., 2007; Unsworth, 2010) and considered P. orientalis as synonym of P. vittatus (Randall and Johnson, 2000; McKay, 2001; Randall, 2005; Froese and Pauly, 2014). Randall and Johnson (2000) has resurrected P. vittatus (Linnaeus) as an older name. Recently, some studies have separated oriental sweetlips from the Indian Ocean and Pacific Ocean populations and considered P. vittatus as the Indian Ocean populations (Indian Ocean oriental sweetlips) and P. orientalis (oriental sweetlips) as the Pacific Ocean populations. Despite a large number of morphology-based hypotheses, no molecular studies have been examined on the two debated species. As mention above, mitochondrial DNA has become a very useful marker for species identification and phylogenetic studies. Thus, further studies of genetic characteristics of P. orientalis and P. vittatus based on multiple mitochondrial gene markers appear necessary to recover conclusive phylogenetic relationships of the two species and resolve the classification and identification problem.
In the present study, we first reported the complete mitogenome sequences of P. orientalis and P. vittatus and further compared their genome structure and organization, nucleotide variation and codon usage. We also reported the phylogenetic analysis using protein sequences from P. orientalis, P. vittatus and other Haemulidae species to clarify the interrelationship of the two species and investigate their evolutionary position within Haemulidae.
Materials and Methods
Sweetlips samples collection and genomic DNA extraction
Sample of P. orientalis was collected in its natural habitats, the coral reef areas of Jiyin Island in Paracel Islands. Sample of P. vittatus was a vouchered specimens obtained from SAIAB (South African Institute for Aquatic Biodiversity). A small piece of fresh muscle was sampled and preserved in 95% ethanol and total genomic DNA was extracted using a Tissue Genomic DNA Extraction kit (Omega, USA) following the manufacturer’s protocol and stored at -20°C. All experimental procedures were conducted in conformity with institutional guidelines for the care and use of laboratory animals, and protocols were approved by the Institutional Animal Care and Use Committee in Zhongkai University of Agriculture and Engineering, Guangdong, China.
Primer design and long-PCR amplification
The complete mitochondrial genomes of P. orientalis and P. vittatus were both amplified using long PCR technique (Miya and Nishida, 1999). Three sets of primers were designed from conservative regions of the genes for 16SrRNA , CO II and tRNA(Leu) to efficiently amplify the complete mitochondrial genome in three long-PCRs using EX Taq DNA polymerase (TaKaRa, Japan). All PCR products were purified using QIAquick Gel Extraction Kit (Qiagen, German).
The purified PCR products were then cloned into the pUCm-T cloning vectors (Invitrogen, USA) and sequenced according to the manufacturer’s protocol by using T7 and M13R inner primers of pUCm-T vector. Primer walking method was applied for sequencing the DNA fragment. Each segment overlapped the next contig by 80–120 bp to ensure the accuracy of the sequence.
Sequence analysis
The primary DNA sequence data was characterized by BLAST tools at NCBI database (www.ncbi.nlm.nih.gov). Then the DNA sequences were edited and analyzed by the computer programs Vector NTI Suite 8 (Invitrogen, USA). The locations of the 13 protein-coding genes were determined by comparisons with nucleotide or amino acid sequences of other bony fish mitochondrial genomes. The 22 tRNA genes and their anticodon sequences were identified by their proposed cloverleaf secondary structures drawn by tRNAscan-SE software (Lowe and Eddy, 1997). The two ribosomal RNA (rRNA) genes and the control region were identified by sequence homology and proposed secondary structure (Gutell et al., 1993).
Phylogenetic analysis
To determine the phylogenetic position of P. orientalis and P. vittatus in the subfamily Plectorhynchinae, sequences of Cytb and COI genes of 21 ingroup species in Plectorhynchinae and 4 outgroup species in Haemulinae from GenBank were selected (Table I). individuals of certain species Besides, in order to examine the evolutionary status of Haemulidae of the phylogenetic relationships in Percoidei species, 12 protein-coding sequences of 42 species belonged to 25 families in the suborder Percoidei and one outgroup species Salarias fasciatus in suborder Blennioidei were also selected (Table II). Both datasets were aligned with Clustal X 1.85 (Thompson et al., 1994) with default gap penalties. The molecular phylogeny was analyzed by Maximum Likelihood (ML) and Bayesian Inference (BI) methods. The Modeltest 3.7 software (Posada and Crandall, 1998) was used as a guide to determine the best-fit evolutionary model under the Akaike information criterion (AIC) (Posada and Buckley, 2004) and the GTR (general time reversible) model was chosen in the data computing.
Results
Genome information
The complete mitochondrial genomes of P. orientalis and P. vittatus were sequenced as 16,546 bp and 16,545 bp in length, which have been submitted to GenBank database (Accession no. KP966562, KP976103). The structural organization and arrangement of both genomes consisted of 13 typical vertebrate protein-coding genes, 22 transfer RNA (tRNA) genes, 2 ribosomal RNA (rRNA) genes and one putative control region (Fig. 1A, B; Table III). Overall base compositions of L-strand nucleotide sequences in the two mitochondrial genome were as follows, P. orientalis: A, 27.9%; G, 16.4%; T, 24.7%; and C, 31.0%, A+T=52.6%C+G=47.4%; P. vittatus: A, 28.0%; G, 16.4%; T, 24.7%; and C, 30.9%, A+T=52.7%C+G=47.3% (Table IV).
Table III.- Main charateristic of mitochondrial genome of P. orientalis and P. vittatus.
| Gene | Stra-nd | P. orientalis | P. vittatus | Codon | |||||
| Position From -to | Nucle-otide Size /bp | Interg-enic nucle-otide | Position From-to | Nucle-otide Size/ bp | Interg-enic nucle-otide | Start | Stop | ||
| tRNAPhe | H | 1-69 | 69 | 0 | 1-69 | 69 | 0 | ||
| 12S rRNA | H | 70-1020 | 951 | 0 | 70-1021 | 952 | 0 | ||
| tRNAval | H | 1021-1091 | 71 | 0 | 1022-1092 | 71 | 0 | ||
| 16S rRNA | H | 1092-2786 | 1695 | 0 | 1093-2783 | 1691 | 0 | ||
| tRNALeu(UUR) | H | 2787-2860 | 74 | 0 | 2784-2857 | 74 | 0 | ||
| ND1 | H | 2861-3835 | 975 | 5 | 2858-3832 | 975 | 5 | ATG/ ATG | TAA/ TAG |
| tRNAIle | H | 3841-3910 | 70 | -1 | 3838-3907 | 70 | -1 | ||
| tRNAGln | L | 3910-3980 | 71 | -1 | 3907-3977 | 71 | -1 | ||
| tRNAMet | H | 3980-4049 | 70 | 0 | 3977-4046 | 70 | 0 | ||
| ND2 | H | 4050-5096 | 1047 | 0 | 4047-5093 | 1047 | 0 | ATG/ ATG | TAA/ TAA |
| tRNATrp | H | 5097-5168 | 72 | 0 | 5094-5165 | 72 | 0 | ||
| tRNAAla | L | 5169-5237 | 69 | 1 | 5166-5234 | 69 | 1 | ||
| tRNAAsn | L | 5239-5311 | 73 | 40 | 5236-5308 | 73 | 39 | ||
| tRNACys | L | 5352-5418 | 67 | -1 | 5348-5415 | 68 | -1 | ||
| tRNATyr | L | 5418-5488 | 71 | 1 | 5415-5486 | 72 | 1 | ||
| COI | H | 5490-7049 | 1557 | -13 | 5488-7050 | 1563 | -13 | GTG/ GTG | AGG/ AGG |
| tRNASer(UCN) | L | 7037-7107 | 71 | 3 | 7038-7108 | 71 | 3 | ||
| tRNAAsp | H | 7111-7182 | 72 | 3 | 7112-7183 | 72 | 4 | ||
| COII | H | 7186-7876 | 691 | 0 | 7188-7878 | 691 | 0 | ATG/ ATG | T--/ T-- |
| tRNALys | H | 7877-7951 | 75 | 1 | 7879-7953 | 75 | 1 | ||
| ATPase8 | H | 7953-8120 | 168 | -10 | 7955-8122 | 168 | -10 | ATG/ ATG | TAA/ TAA |
| ATPase6 | H | 8111-8793 | 683 | 0 | 8113-8795 | 683 | 0 | ATG/ ATG | TA-/ TA- |
| COIII | H | 8794-9578 | 785 | 0 | 8796-9580 | 785 | 0 | ATG/ ATG | TA- /TA- |
| tRNAGly | H | 9579-9650 | 72 | 0 | 9581-9652 | 72 | 0 | ||
| ND3 | H | 9651-9999 | 349 | 0 | 9653-10001 | 349 | 0 | ATG/ ATG | T--/ T-- |
| tRNAArg | H | 10000-10068 | 69 | 0 | 10002-10070 | 69 | 0 | ||
| ND4L | H | 10069-10365 | 297 | -7 | 10071-10367 | 297 | -7 | ATG/ ATG | TAA/ TAA |
| ND4 | H | 10359-11739 | 1381 | 0 | 10361-11741 | 1381 | 0 | ATG/ ATG | T--/ T-- |
| tRNAHis | H | 11740-11808 | 69 | 0 | 11742-11810 | 69 | 0 | ||
| tRNASer(AGY) | H | 11809-11875 | 67 | 4 | 11811-11877 | 67 | 4 | ||
| tRNALeu(CUN) | H | 11880-11952 | 73 | 0 | 11882-11954 | 73 | 0 | ||
| ND5 | H | 11953-13791 | 1839 | -4 | 11955-13793 | 1839 | -4 | ATG/ ATG | TAG/ TAA |
| ND6 | L | 13788-14309 | 522 | 0 | 13790-14311 | 522 | 0 | ATG/ ATG | TAA/ TAA |
| tRNAGlu | L | 14310-14378 | 69 | 4 | 14312-14380 | 69 | 4 | ||
| Cytb | H | 14383-15523 | 1141 | 0 | 14385-15525 | 1141 | 0 | ATG/ ATG | T--/ T-- |
| tRNAThr | H | 15524-15595 | 72 | 33 | 15526-15597 | 72 | 29 | ||
| tRNAPro | L | 15629-15698 | 70 | 0 | 15627-15696 | 70 | 0 | ||
| D-loop | H | 15699-16546 | 848 | 0 | 15697-16545 | 849 | 0 | ||
Table IV.- Base composition of mtDNA in P. orientalis and P. vittatus.
| P. orientalis | P. vittatus | |||||||||||
| T% | C% | A% | G% | A+T% | C+G% | T% | C% | A% | G% | A+T% | C+G% | |
| Mitochondrial genome | 24.7 | 31.0 | 27.9 | 16.4 | 52.6 | 47.4 | 24.7 | 30.9 | 28.0 | 16.4 | 52.7 | 47.3 |
| 13 protein-coding genes | 26.5 | 32.4 | 25.2 | 15.9 | 51.7 | 48.3 | 26.5 | 32.3 | 25.4 | 15.8 | 51.9 | 48.1 |
| 1st | 20.0 | 28.9 | 25.7 | 25.5 | 45.7 | 54.4 | 20.0 | 29.7 | 26.2 | 24.6 | 46.2 | 54.3 |
| 2nd | 40.0 | 27.8 | 18.3 | 13.5 | 58.3 | 41.3 | 39.0 | 27.9 | 18.4 | 14.5 | 57.4 | 42.4 |
| 3rd | 19.0 | 40.5 | 31.5 | 8.7 | 50.5 | 49.2 | 21.0 | 39.3 | 31.7 | 8.3 | 52.7 | 47.6 |
| 22 tRNAs | 23.8 | 25.9 | 29.9 | 20.4 | 53.7 | 46.3 | 24.0 | 25.7 | 29.8 | 20.4 | 53.8 | 46.1 |
| 2 rRNAs | 20.6 | 26.2 | 32.5 | 20.8 | 53.1 | 47.0 | 20.4 | 26.3 | 32.5 | 20.8 | 52.9 | 47.1 |
| Control region | 29.8 | 25.8 | 29.5 | 14.9 | 59.3 | 40.7 | 29.1 | 25.9 | 29.6 | 15.4 | 58.7 | 41.3 |
Protein-coding genes
The 13 protein-coding genes in the two sweetlips mtDNA were similar in length to their corresponding vertebrate counterparts. The total length of the protein-coding genes was 11,435 bp in P. orientalis and 11,441 bp in P. vittatus without introns, accounting for 69.12% and 69.15% of the complete genome. A6 bp differences of the protein-coding genes was found between the two species in gene COI, which was 1557 in P. orientalis and 1563 in P. vittatus (Table III). All protein-coding genes use ATG as a start codon except for COI, which started with GTG. A diverse pattern of codon usage was found within stop codons: six genes ended with TAA: ND1 (P. orientalis), ND2, ATPase8, ND4L, ND5 (P. vittatus) and ND6, two ended with TAG: ND1 (P. vittatus) and ND5 (P. orientalis), one ended with AGG: COI, the remaining genes had incomplete stop codons, TA (ATPase6, COIII) or T: COII, ND3, ND4 and Cyt b. Among the 13 protein-coding genes, three reading-frame overlaps were found: the pair of gene ATPase 8 and ATPase 6 overlapped by 10 nucleotides, ND4L and ND4 overlapped by 7 nucleotides, ND5 and ND6 overlapped by 4 nucleotides, no overlaps were between ATPase and COIII.
The base composition of the two sweetlips mitochondrial protein-coding genes is summarized in Table IV. The most frequent nucleotides at the first, second and third codon positions were C (28.9%, 29.7%), T (40.0%, 39.0%), C (40.5%, 39.3%) in P. orientalis and P. vittatus, respectively. The frequency of nucleotide G at the third codon position was relatively low (only 8.7%, 8.3%), showing a strong bias against G at this position. In addition, pyrimidines at the second codon position were over-represented (T+C=67.8%, 66.9%).
Codon usage in 13 protein-coding genes of the two sweetlips were analyzed and shown in Table V. The total number of codons for 20 amino acids were 3789 (P. orientalis) and 3791 (P. vittatus) excluding start and stop codons. The most frequent used amino acids are Leu (17.5%, 17.2%), followed by Ile (7.3%, 7.2%), Ser (6.4%, 6.5%), Gly (6.2%, 6.2%), and Val (5.7%, 5.5%). For amino acids with four-fold degenerate third positions, codon families ending in C were the most frequent, followed by codons ending in A. Among two-fold degenerate codons, C appeared to be used more than T in pyrimidine codon families, whereas purine codon families ended mostly with A.
Transfer RNA genes and ribosomal RNA genes
The two sweetlips mitochondrial genomes contain 22 tRNA genes, which are interspersed between rRNA and protein-coding genes, ranging from 67 (tRNACys, tRNASer(AGY)) to 76 (tRNALys(UUR)) nucleotides in length (Table III). Two forms of tRNA-Leu (UUR and CUN) and tRNA-Ser (UCN-AGY) in the two sweetlips were identified. The anticodons of 22 tRNA genes were shown in Table III. Two ribosomal RNA genes, the small subunit (12S) and the large subunit (16S) of rRNAs were 951bp and 1,695 bp in P. orientalis and 952bp and 1,691 bp in P. vittatus, respectively. The two ribosomal RNA genes were located between the genes of tRNA-Phe and tRNA-Leu, separated by the gene tRNA-Val.
Noncoding sequence
The light strand replication origin (OL) was comprised of 40 nucleotides in P. orientalis, and 39 nucleotides in P. vittatus, which could be folded into a stable stem-loop secondary structure containing 22 bp in the stem, 15 or 16 bp in the loop. The conserved motif of the two sweetlips were also 5’-GGCGG-3’ found at the base of the stem within the tRNA-Cys gene. The control region was located between the tRNAPro and tRNAPhe genes and determined to be 848 bp in P. orientalis and 849 bp in P. vittatus. The control regions of the two species were both heavily biased towards A+T nucleotides with A+T content 59.3% in P. orientalis and 58.7% in P. vittatus (Table III).
Table V.- Codon usage in P. orientalis and P. vittatus mitochondrial protein-coding genes.
| Amino acid number | Codon | P. orientalis | P. vittatus | Amino acid number | Codon | P. orientalis | P. vittatus | ||||
| n | (%) | n | (%) | n | (%) | n | (%) | ||||
| Phe | TTT | 68 | 1.8 | 68 | 1.8 | Tyr | TAT | 33 | 0.9 | 41 | 1.1 |
| TTC | 164 | 4.3 | 145 | 3.8 | TAC | 85 | 2.2 | 80 | 2.1 | ||
| Leu | TTA | 52 | 1.4 | 47 | 1.2 | Stop | TAA | 0 | 0 | 7 | 0.2 |
| TTG | 21 | 0.6 | 26 | 0.7 | TAG | 1 | 0 | 0 | 0 | ||
| CTT | 133 | 3.5 | 136 | 3.6 | His | CAT | 27 | 0.7 | 25 | 0.7 | |
| CTC | 194 | 5.1 | 194 | 5.1 | CAC | 79 | 2.1 | 84 | 2.2 | ||
| CTA | 194 | 5.1 | 190 | 5 | Gln | CAA | 87 | 2.3 | 86 | 2.3 | |
| CTG | 69 | 1.8 | 59 | 1.6 | CAG | 13 | 0.3 | 14 | 0.4 | ||
| Ile | ATT | 123 | 3.2 | 120 | 3.2 | Asn | AAT | 24 | 0.6 | 40 | 1.1 |
| ATC | 157 | 4.1 | 153 | 4 | AAC | 97 | 2.6 | 80 | 2.1 | ||
| ATA | 91 | 2.4 | 95 | 2.5 | Lys | AAA | 67 | 1.8 | 69 | 1.8 | |
| Met | ATG | 59 | 1.6 | 64 | 1.7 | AAG | 7 | 0.2 | 3 | 0.1 | |
| Val | GTT | 46 | 1.2 | 51 | 1.3 | Asp | GAT | 20 | 0.5 | 19 | 0.5 |
| GTC | 79 | 2.1 | 67 | 1.8 | GAC | 56 | 1.5 | 55 | 1.5 | ||
| GTA | 64 | 1.7 | 63 | 1.7 | Glu | GAA | 79 | 2.1 | 78 | 2.1 | |
| GTG | 27 | 0.7 | 25 | 0.7 | CAG | 19 | 0.5 | 16 | 0.4 | ||
| Ser | TCT | 46 | 1.2 | 46 | 1.2 | Cys | TGT | 4 | 0.1 | 7 | 0.2 |
| TCC | 72 | 1.9 | 70 | 1.8 | TGC | 19 | 0.5 | 22 | 0.6 | ||
| TCA | 62 | 1.6 | 61 | 1.6 | Stop | TGA | 97 | 2.6 | 96 | 2.5 | |
| TCG | 6 | 0.2 | 6 | 0.2 | Trp | TGG | 23 | 0.6 | 18 | 0.5 | |
| Pro | CCT | 58 | 1.5 | 74 | 2 | Arg | CGT | 8 | 0.2 | 15 | 0.4 |
| CCC | 110 | 2.9 | 112 | 3 | CGC | 19 | 0.5 | 23 | 0.6 | ||
| CCA | 49 | 1.3 | 52 | 1.4 | CGA | 43 | 1.1 | 42 | 1.1 | ||
| CCG | 8 | 0.2 | 10 | 0.3 | CGG | 5 | 0.1 | 11 | 0.3 | ||
| Thr | ACT | 44 | 1.2 | 46 | 1.2 | Ser | AGT | 12 | 0.3 | 10 | 0.3 |
| ACC | 123 | 3.2 | 124 | 3.3 | AGC | 45 | 1.2 | 53 | 1.4 | ||
| ACA | 125 | 3.3 | 118 | 3.1 | Stop | AGA | 0 | 0 | 5 | 0.1 | |
| ACG | 13 | 0.3 | 14 | 0.4 | AGG | 0 | 0 | 11 | 0.3 | ||
| Ala | GCT | 65 | 1.7 | 57 | 1.5 | Gly | GGT | 22 | 0.6 | 30 | 0.8 |
| GCC | 147 | 3.9 | 148 | 3.9 | GGC | 89 | 2.3 | 80 | 2.1 | ||
| GCA | 102 | 2.7 | 103 | 2.7 | GGA | 80 | 2.1 | 88 | 2.3 | ||
| GCG | 25 | 0.7 | 15 | 0.4 | GGG | 46 | 1.2 | 37 | 1 | ||
The incomplete T/TA of the stop codon is not included.
Sequence comparison between P. orientalis and P. vittatus
The comparison analysis of 16 genes between P. orientalis and P. vittatus were showed in Table VI. The complete mitogenome of the two sweetlips were 16,546 bp (P. orientalis) and 16,545 bp (P. vittatus) in length, but there were 941 variable sites (5.69%) in the two mitogenomes, the sequence divergence value was revealed to be 6.5% based on the Kimura-2 Parameter model. The differences of 13 protein-coding genes, 2 ribosomal RNA genes and one control region which are commonly used as molecular markers between the two species were also analyzed. That showed great genetic differences between the two sweetlips existed in all 16 genes. The divergence values based on K-2-P model between P. orientalis and P. vittatus ranged from 2.4% (12S rRNA) to 11.2% (ND6) with nucleotide mutation ranged from 6 bp to 132 bp, all divergence values were larger than 2%, even in the two ribosomal RNA genes (12 and 16 rRNAs) which retained very low evolutionary rate, revealing a significant genetic differences between the two sweetlips at molecular level.
Table VI.- Comparison analysis of 16 gene sequences between P. orientalis and P. vittatus.
| Length (P. orientalis) | Length(P. vittatus) | Number of variable sites (bp) | Bases variation (%) | Sequence divergence (%) | |
| D-loop | 848 | 849 | 83 | 9.78 | 10.6 |
| 12S rRNA | 951 | 952 | 22 | 2.31 | 2.4 |
| 16S rRNA | 1695 | 1691 | 45 | 2.66 | 2.7 |
| COI | 1557 | 1563 | 94 | 6.03 | 6.4 |
| COII | 691 | 691 | 23 | 3.33 | 3.4 |
| COIII | 785 | 785 | 41 | 5.22 | 5.5 |
| ND1 | 975 | 975 | 76 | 7.79 | 8.4 |
| ND2 | 1047 | 1047 | 91 | 8.69 | 9.4 |
| ND3 | 349 | 349 | 26 | 7.49 | 8 |
| ND4L | 297 | 297 | 12 | 4.04 | 4.2 |
| ND4 | 1381 | 1381 | 109 | 7.89 | 8.5 |
| ND5 | 1839 | 1839 | 132 | 7.18 | 7.8 |
| ND6 | 522 | 522 | 53 | 10.15 | 11.2 |
| Cytb | 1141 | 1141 | 82 | 5.69 | 7.7 |
| ATPase6 | 683 | 683 | 40 | 5.86 | 6.2 |
| ATPase8 | 168 | 168 | 6 | 3.57 | 3.7 |
| Whole sequences | 16546 | 16545 | 941 | 5.69 | 6.5 |
Phylogenetic analysis
Molecular phylogenetic trees of 21 sweetlips (Plectorhynchinae) were constructed using ML and BI methods based on combined Cyt b and COI sequences, the trees were well divided the sweetlilps into three groups with high bootstrap values and posterior probabilities (Fig. 2). Group one composed sweetlips with beautiful coloration pattern, group two and three composed sweetlips with simple patterns and dark appearances. Two sweetlips P. orientalis and P. vittatus were positioned in group one, clustering together as sister species and closely related to the cluster P. lineatus and P. diagrammus which also possessed black stripes along the body, indicating their closed relationships with each other. Another phylogenetic trees constructed from 42 Percoidei species of 25 families formed 5 large groups, Diagramma pictum, Parapristipoma trilineatum, P. orientalis and P. vittatus formed a monophyletic Haemulidae in group I, sister to the cluster Lethrinus obsoletus + Monotaxis grandoculis. The species Hapalogenys nigripinnis, which was a Haemulidae member morphologically, was separated from Haemulidae group. It was placed in group IV and clustered with Sillago sihama, revealing its distant relationship with Haemulidae species.
Discussion
Similar organization of two mitogenomes with other vertebrates
The two mitogenomes both consisted of 13 typical vertebrate protein-coding genes, 22 transfer RNA (tRNA) genes, 2 ribosomal RNA (rRNA) genes and one putative control region, which were similar to other vertebrate mitogenomes. As in other vertebrate species (Miya et al., 2003; Oh et al., 2007; Ponce et al., 2008; Catanese et al., 2010), most genes were encoded on the H-strand except for one protein-coding gene ND6 and 8 tRNA genes (Gln, Ala, Asn, Cys, Tyr, SerUCN, Glu and Pro) which were encoded on the L-strand. As shown in Table IV, the contents of A+T of the two sweetlips were both higher than that of C+G, indicating a strong compositional base bias in the mitochondrial genome which was in accordance with the variation tendency of the A+T content in other vertebrates.
For 13 protein-coding genes (Table V), variances were observed in stop codons, which seemed to be a tendency in fish mitochondrial genomes (Miya and Nishida, 1999; Ponce et al., 2008; Catanese et al., 2010). The three reading-frame overlaps observed between protein coding genes showed different from the previously reported species that 1 nucleotide was overlapped between the two genes (Oh et al., 2007; Ponce et al., 2008; Catanese et al., 2010). As shown in Table IV, the base composition of the two sweetlips mitochondrial protein-coding genes showed a strong bias against G, which seemed due to the hydrophobic characteristic of the proteins (Naylor et al., 1995). These typical features of protein-coding genes were also found in most vertebrates (Oh et al., 2007; Catanese, 2010; Cheng et al., 2012a, b). These codon usage patterns in protein coding genes were in accordance with the overall bias against G, because G was the least common third position nucleotide in all codons except for glycine, in which G was more frequent than T. All these features were very similar to other bony fish (Miya et al., 2003; Ponce et al., 2008; Cheng et al., 2012a, b).
For tRNAs, They showed the typical arrangement in vertebrates. Most of them could be folded into the typical secondary structure-canonical cloverleaf, which were determined by the tRNAscan-SE software (Lowe and Eddy, 1997). The two ribosomal RNA genes were located between the genes of tRNA-Phe and tRNA-Leu, separated by the gene tRNA-Val, as in other vertebrates (Miya et al., 2001; Oh et al., 2007; Catanese et al., 2010). For noncoding sequences, the light strand replication origin (OL) in P.orientlais and P. vittatus was positioned in a cluster of five tRNA genes known as the WANCY region between the tRNAAsn and tRNACys genes as most of the vertebrates.
The differences of mitogenomes between P. orientalis and P. vittatus
Avise and Walker (1999) revealed divergence values between species of vertebrates in Cyt b were ordinarily greater than 2%. Hebert (2003a) and (2003b) studied the COI sequences of 13320 species from 11 phyla and suggested that the threshold of divergence values in COI for species diagnosis was 2%. Intraspecific divergences were rarely greater than 2% and most were less than 1% (Hebert, 2003b; Avise, 2000). In our study, sequence divergences were revealed in COI and Cyt b between the two sweetlips were 6.4% and 7.7%, respectively, largely greater than the 2% value suggested by Hebert. The other 14 genes in Table VI were also larger than the threshold 2% value, even in the two highly conserved ribosomal RNA genes. In our previous studies, we had investigated the phylogenetic relationship of 17 sweetlips involved 3 individuals of P. orientalis and 3 individuals of P. vittatus based on Cyt b and COI genes (Liang et al., 2016). The result revealed that sequence divergences in each individual sample of P. orientalis and P. vittatus were all less than 0.5% in the two genes. The study also discovered that the divergence value between P. orientalis and P. vittatus was larger than some inter-sweetlips species values like Plectorhinchus chubbi vs Plectorhinchus sordidus (COI: 3.6%; Cytb: 3.4%), Plectorhinchus chubby vs Plectorhinchus plafairi (COI: 4.8%; Cytb: 5.0%) and Plectorhinchus sordidus vs Plectorhinchus plafairi (COI: 5.7%; Cytb: 4.5%). All these pieces of evidences indicated that great sequence variation and molecular differentiation were existed in the two sweetlips, suggested that they might be considered as two separate species.
Phylogenetic analysis of P. orientalis and P. vittatus
Phylogenetic trees constructed from 21 Haemulidae species based on the the combined sequences of Cyt b, COI were well divided the sweetlilps into three groups (Fig. 2). Group one composed sweetlips with beautiful coloration pattern, group two and three composed sweetlips with simple patterns and dark appearances, which was in accordance with traditional morphological classifications (McKay, 1984, 2001). The two sweetlips P. orientalis and P. vittatus were positioned in group one, clustering together as sister species and closely related to the cluster P. lineatus and P. diagrammus, which was consistent with the molecular phylogeny of Haemulidae species based on 16S rRNA and TMO-4C4. By morphological diagnosis, they all had black stripes and bands on their bodies. In the phylogenetic trees, the long branch clearly distinguished the separated evolutionary positions of the two orientalis sweetlips. Along with the great genetic differences result of sequence comparison analysis on 16 molecular marker genes above, we suggested that P. orientalis and P. vittatus might be placed as two distinct species and were not synonym.
The phylogenetic position of Haemulidae among the Percoidei was also examined in this study (Fig. 3). The tree revealed 4 Haemulidae species Diagramma pictum, Parapristipoma trilineatum, P. orientalis and P. vittatus formed a monophyletic group except for Hapalogenys nigripinnis, which was placed in an independent position out of the Haemulidae clusters. Such finding was not congruent with the traditional morphological studies (Shen, 1993; McKay, 2001; Nelson, 2006) but agreed with some other morphology and molecule-based studies which suggested that the genus Hapalogenys were removed from Haemulidae (Springer and Raasch, 1995; Leis and Carson-Ewart, 2000; Froese and Pauly, 2014). Recent phylogenetic analysis on the relationships of Hapalogenys and Haemulidae also revealed a distant relationship between them (Ren and Zhang, 2007; Sanciangco et al., 2011). Our result was in agreement with those molecular reports, indicating the fundamental status of Hapalogenys in the Percoidei may need to be redefined. The family Haemulidae was grouped with family Lethrinidae as sister lineage and was closely related to families Lutjanidae, Caesionidae, Emmelichthyidae and Monodactylidae. Traditionally, potential sister groups to Haemulidae as well as its placement among Percoidei were uncertain either in morphological or in molecular studies (Johnson, 1981; Sanciangco et al., 2011; Tavera et al., 2012). Recent studies on higher-level relationships of percomorphs and acanthomorphs have shown potential outgroups for Haemulidae on the basis of molecular characters but the relationships and placement of Haemulidae varied through time according to different authors (Dettai and Lecointre, 2005; Chen et al., 2007; Craig and Hastings, 2007; Smith and Craig, 2007; Li et al., 2009). The current studies on Haemulidae relationships by Tavera et al. (2012) have revealed Sillaginidae sister clade to Haemulidae, but the support values were relatively low. Our molecular phylogenetic study on the placement of Haemulidae among Percoidei included the previously suggested potential Haemulidae-close families. The result recovered Haemulidae sister to Lethrinidae and was placed in a cluster comprised of families Lutjanidae, Caesionidae, Emmelichthyidae and Monodactylidae, which were consistent with the studies of Tavera et al. (2012). However, the Percoidei is the largest suborder of the Perciformes and the sequences of most Percoidei species are not available. A complete mitochondrial genomes are needed to be sequenced for further detailed analysis of the evolutionary relationships of Haemulidae within Percoidei species.
Conclusions
The mitochondrial genome of two synonyms debated species P. orientalis and P. vittatus were first determined in this study. The lengths of the two mitogenome are 16,546 bp and 16,545 bp, which both consist of 13 typical vertebrate protein-coding genes, 22 transfer RNA (tRNA) genes, 2 ribosomal RNA (rRNA) genes and one putative control region. Genomic composition, organization, and gene order of the two genomes are similar to that obtained in most vertebrates. All sequence divergences of 13 protein-coding genes, 2 rRNA genes and one control region which are commonly used as molecular markers between the two species are larger than the species diagnosis divergence value 2%. And divergence values of Cyt b (6.0%) and COI (7.4%) are also largely greater than 2%. Furthermore, molecular phylogenetic trees also clearly distinguish the independent position of the two species. These results above reveal great genetic differences between P. orientalis and P. vittauts, and strongly suggest that they are two distinct species and should not be placed as synonyms.
Acknowledgments
The study was supported by the Natural Science Foundation of Guangdong Province, China (2016A030310236) and Foundation for Young Talents in Higher Education of Guangdong, China (2014KQNCX164). We wish to thank Bernard Mackenzie (SAIAB South African Institute for Aquatic Biodiversity, Grahamstown, South Africa) for his kind assistance in providing samples of P. vittatus. We would also like to thank the College of Animal Science in South China Agricultural University for their laboratory facilities and experimental support to this study.
Statement of conflict of interest
Authors declare that they have no competing interests.
Figures
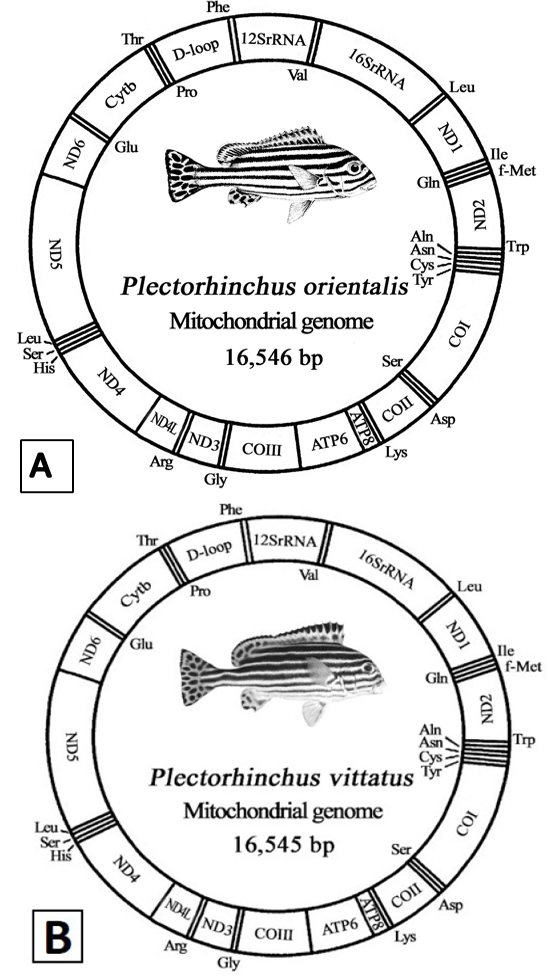
Mitochondrial genome of P. Orientalis (A) and P. Vittatus (B).
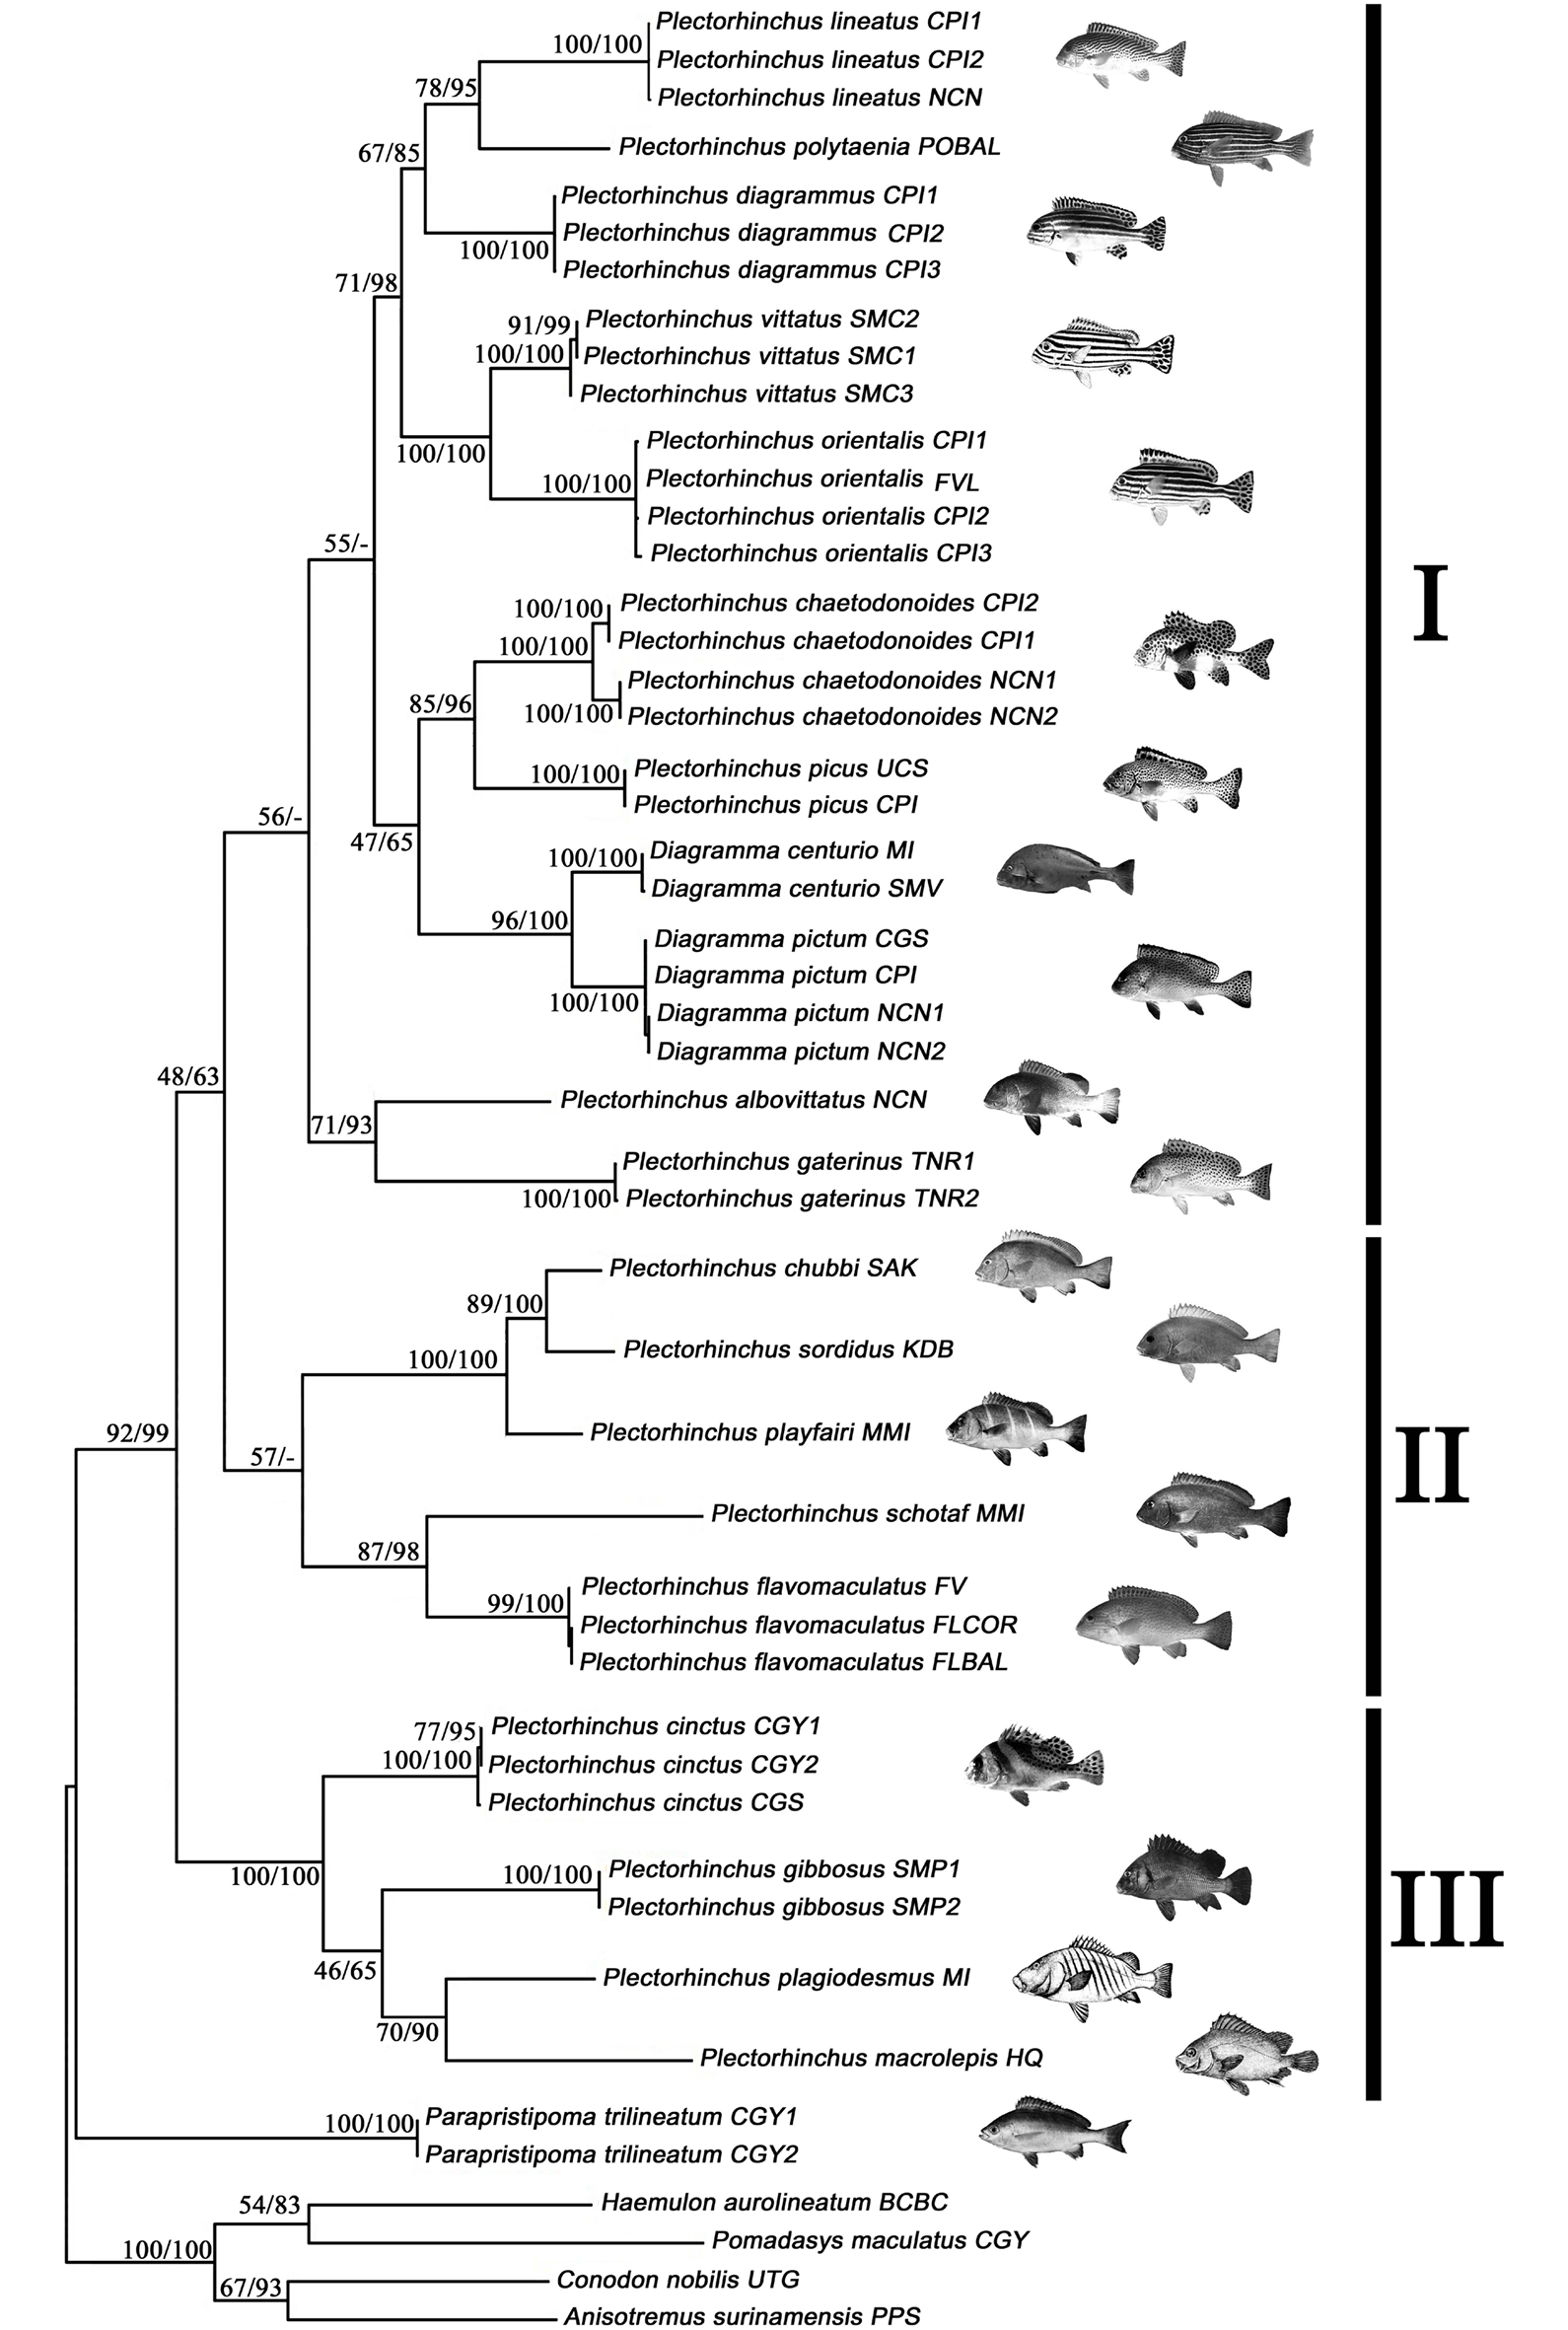
Molecular phylogenetic trees of 21 Haemulidae species based on combined cyt b and COI dataset constructed by maximum likelihood (ML) and Bayesian inference (BI) methods. Numbers at the nodes are bootstrap values of ML and Bayesian posterior probabilities, respectively. Pictures of species were the Fishbase website provided by Randall JE, Cornish, A, FAO and website of eol.org
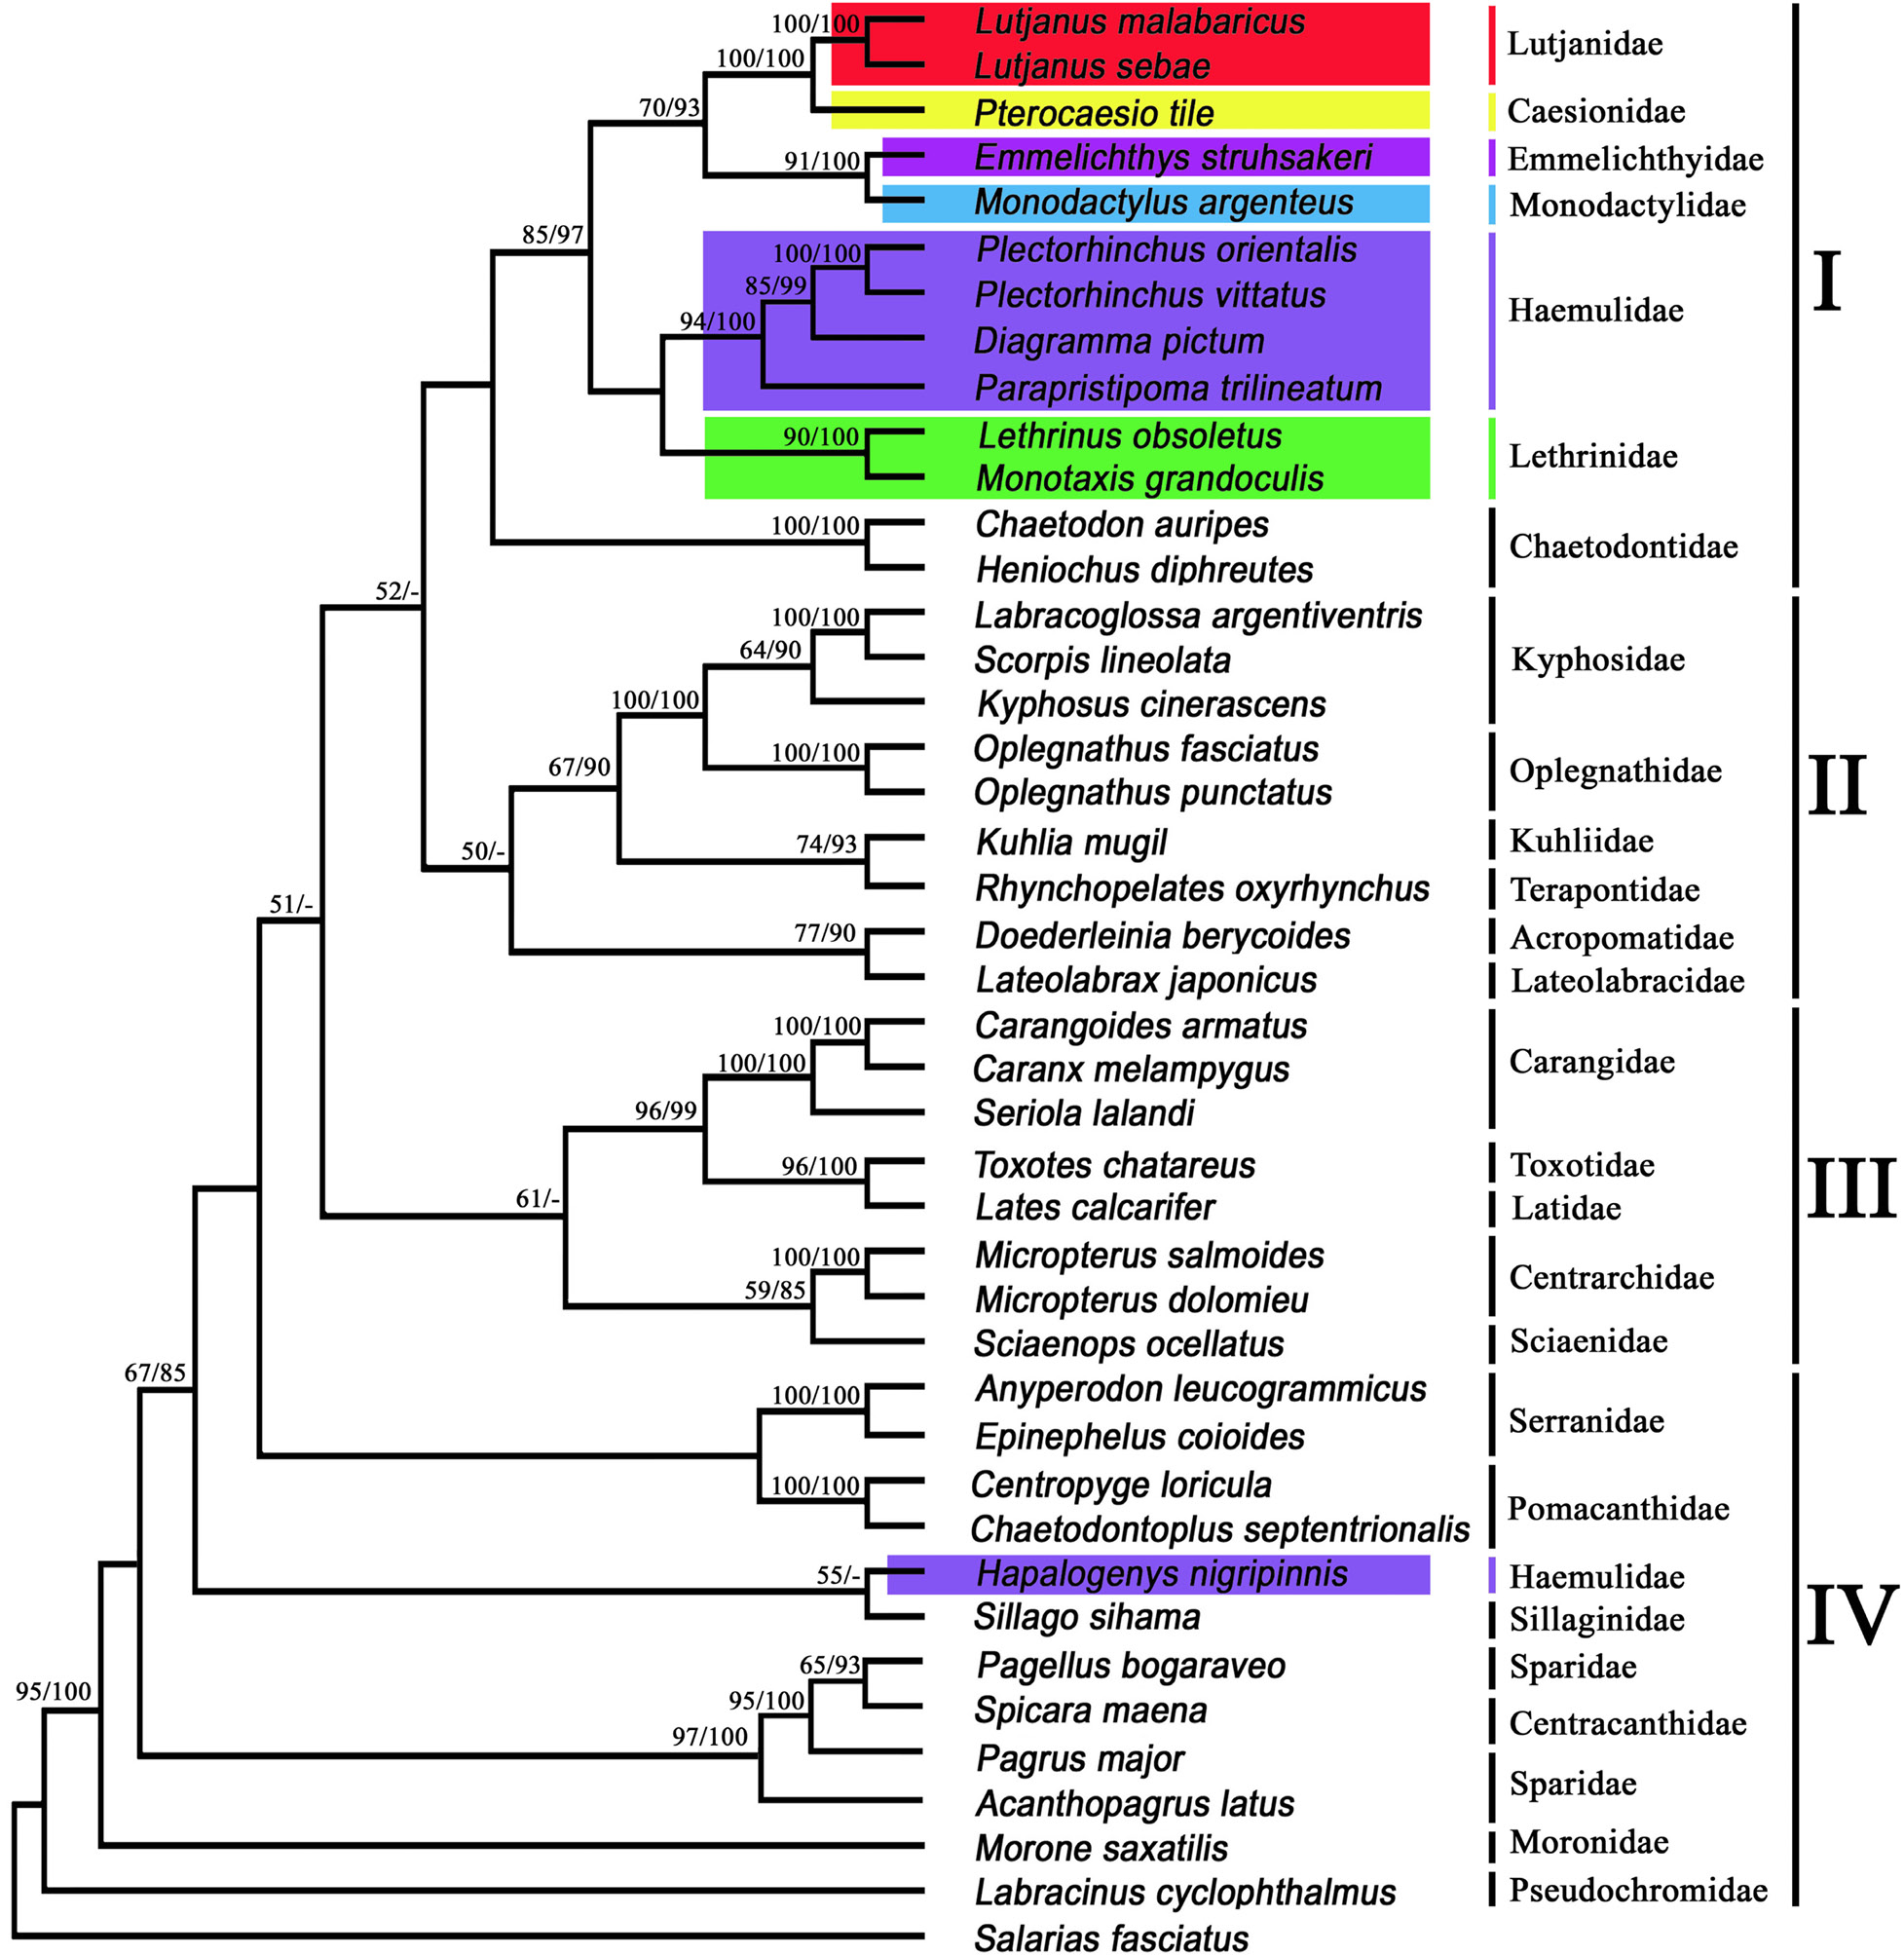
Molecular phylogenetic trees of 42 Percoidei species based on 12 protein-coding genes (excluding the ND6 gene and the 3rd codon positions) constructed by maximum likelihood (ML) and Bayesian inference (BI) methods. Numbers at the nodes are bootstrap values of ML and Bayesian posterior probabilities, respectively
References
- Anyperodon leucogrammicus
- Parapristipoma trilineatum
- Plectorhinchus orientalis
- Broughton and Reneau, 2006
- Labracoglossa argentiventris
- Rhynchopelates oxyrhynchus
- Chaetodontoplus septentrionalis
- Labracinus cyclophthalmus
- Table II.- Species used for Haemulidae phylogenetic analysis, along with GenBank accession numbers of COI and Cyt b gene sequences.
- Plectorhinchus albovittatus
- Plectorhinchus chaetodonoides
- Plectorhinchus diagrammus
- Plectorhinchus flavomaculatus
- Plectorhinchus macrolepis
- Plectorhinchus orientalis
- Plectorhinchus plagiodesmus
- Plectorhinchus polytaenia
- Parapristipoma trilineatum
- BI analysis was implemented in Mrbayes version 3.1.2 (Ronquist and Huelsenbeck, 2003), The MCMC (Markov Chain Monte Carlo) simulation was run for 10 million generations, with trees sampled and saved every 1000 generations (10,000 trees saved per run), and the bootstrap value of internal branch of the phylogenetic tree was supported by the posterior probabilities.
Services
Article usage statistics
Loading…